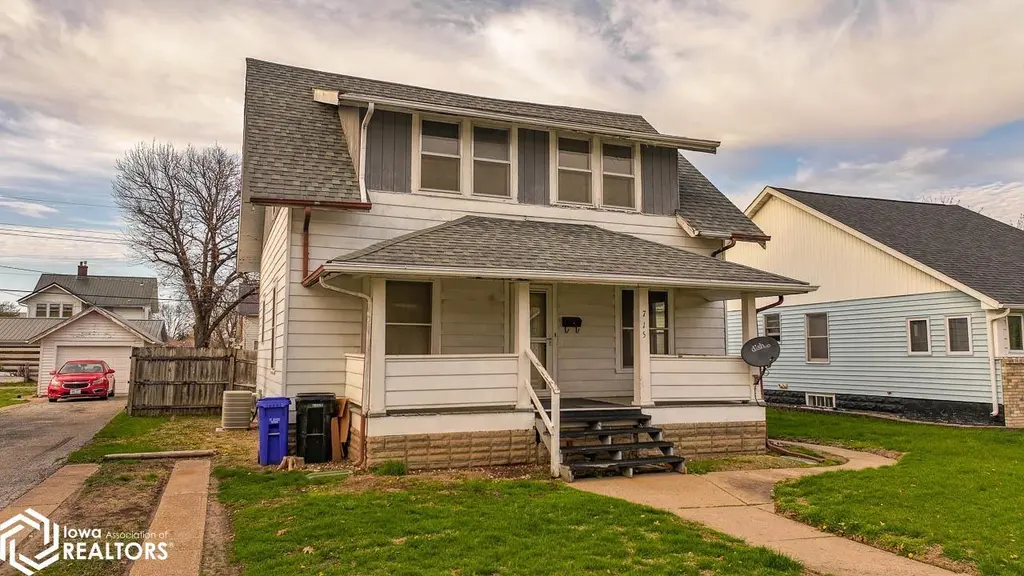
715 E Williams St · Ottumwa, IA
Flood risk 1/10 · Minimal
- FEMA flood zone
- X (unshaded)
- Chance of flooding over 30 yrs
- 0.0%
- Est. flood insurance / yr
- $473 – $860
Fire risk 4/10 · Minor
- Est. fire insurance / yr
- $902 – $1,676
Heat risk 3/10 · Minor
- Hot days now (above 106°F)
- 7 days/yr
- Hot days in 30 yrs
- 15 days/yr
Wind risk 2/10 · Minimal
- Chance of severe wind over 30 yrs
- —
Air-quality risk 2/10 · Minimal
- Unhealthy air days now
- 1 days/yr
- Unhealthy air days in 30 yrs
- 1 days/yr
Risk factors via First Street. Map © Google.
Why this score? — see what drove the C grade
The composite is a weighted blend of 9 inputs, each scored 0–100. Each bar is that input's sub-score; the figure is the points it added to the 100-point composite (weight × sub-score).
- Cash flow +26.2/30.0
- DSCR +8.9/10.0
- 1% rule +7.1/10.0
- Schools +4.3/10.0
- Livability +4.0/5.0
- Rent growth +2.5/5.0
- Condition / age +2.5/5.0
- ARV discount +0.0/15.0
- Appreciation +0.0/10.0
$114,999
🖨 Deal sheet 📄 Offer letter ✓ Due diligence
Listing remarks MLS
Affordable In-Town Living with Investment Potential – Ottumwa, IA Discover this 3-bedroom, 1-bath home in the heart of Ottumwa, offering 1,238 sq ft of comfortable living space on a 0.15-acre lot in Wapello County. This property features generously sized bedrooms, a spacious living room, and hardwood floors that add warmth and character throughout. The home includes a solid basement with excellent potential for storage or future finishing, along with a detached 2-car garage and concrete pad for additional parking or outdoor use. Ideal for owner-occupants or investors, this property offers strong rental potential and an excellent value-add opportunity. Affordable homes with this kind of space and upside are increasingly hard to find—schedule your showing today. KEY FEATURES 3 Bedrooms / 1 Bathroom 1,238 Sq Ft Spacious living room Hardwood floors Large bedrooms Solid basement with potential Detached 2-car garage Concrete pad In-town location Strong rental/investment opportunity
Key facts
- Solid basement
- Concrete pad
- In-town location
Tags
Neighborhood map
What this means for you Summary
Snapshot
- This is a 3-bed/1.0-bath single-family listed at $115k.
Deal economics
- At list price, monthly cash flow is $294 ($4k/yr) — positive.
- The deal already cash-flows at list — no discount required.
- Meets the 1% rule at list price ($1k rent vs $115k).
- Recommended offer: $113k (1.5% below list) — sets the bar for market timing.
- Cap rate 9.4% vs local median 5.9% in Ottumwa — top-decile yield for the area; either an underpriced asset or a hidden risk that comps aren't pricing in. Stress-test before assuming the spread holds.
Location & tenants
- Location reads 80/100 on livability (#91 in IA, #1,900 nationally) — a professional / high-income tenant draw. Strengths: cost of living A+, housing A+, health & safety A+; Watch: crime D-, employment D-.
- Ottumwa Community School District (town): math 50% / reading 54% proficiency, ranked #277 of 289 in IA (top 96%) — acceptable for families but not a draw, mixed tenant base, ~2y average lease.
- Market conditions: 186 active listings in the ZIP; 44 units permitted in Wapello County in 2024 (0 in 5+ unit buildings).
Forward outlook
- Local home prices are declining (-3.0%/yr); year-one equity from $795 of loan paydown is wiped out by about $3k of value loss. Plan a longer hold.
- Wapello County population projected at +5% by 2050 — modest demand growth; plan on rents tracking national, not racing it.
- At projected returns (-3.0% appreciation + 3.0% rent growth), your $32k cash investment doubles in ~10 years — after that, you're playing with house money.
Negotiation context
- It's been on market 24 days — a 2% lower offer ($113k) is reasonable based on typical stale-listing flexibility.
- Current owner paid $59k; list at $115k implies a 95% gain — meaningful room to come down on a strong offer.
Risks & watch-outs
- Watch-outs: built in 1930 — expect roof / HVAC / electrical / plumbing capex.
Questions for the listing agent
- Built in 1930 — when were the roof, HVAC, electrical panel, plumbing, and water heater last replaced?
- Is there a deadline driving the sale (1031 exchange, divorce, estate, relocation)? That informs how much negotiation room exists.
- Crime grade is D in this area — have there been break-ins, vandalism, or insurance claims at this property in the last 3 years? What carrier currently insures it and at what premium?
- What's the average days-on-market for RENTAL listings here right now (not sales)? A rising rental-DOM trend means longer vacancies and softer asking-rent achievability than the comps imply.
- What's the recent tenant-quality profile in this submarket — average credit score on applications, eviction rate, late-payment / NSF rate, and stable-employment percentage? A property-management company in the area should have these aggregated.
- How much new for-sale + rental construction is in the pipeline within 1–3 miles? Heavy new supply typically softens prices + rents 12–24 months out; constrained supply supports both.
Investment metrics
- 1% rule
- 1.21% ✓
- Cap rate
- 9.36%
- Cash-on-cash
- 10.96%
- DSCR
- 1.49
- GRM
- 6.9
CMA / ARV
- ARV (median comp)
- $90,879
- List price
- $114,999
- Delta
- 26.54%
- Verdict
- OVERPRICED
- Comps
- 20 within 1.0 mi
Show comp detail 12 sales within ~0.75 mi
| Address | Dist | Beds/Ba | Sqft | Sold | Price | $/sf | Match |
|---|---|---|---|---|---|---|---|
| 317 S Ward St | 0.45mi | 3/1.0 | 1,248 (+1%) | 8mo | $122,000 | $98 | 71 |
| 125 N Davis St | 0.44mi | 3/1.0 | 1,240 (+0%) | 10mo | $124,900 | $101 | 71 |
| 701 S Moore St | 0.59mi | 3/1.0 | 1,236 (-0%) | 11mo | $120,000 | $97 | 63 |
| 401 S Willard St | 0.52mi | 3/2.0 | 1,284 (+4%) | 5mo | $153,000 | $119 | 61 |
| 534 Ray St | 0.62mi | 3/2.0 | 1,216 (-2%) | 4mo | $139,900 | $115 | 61 |
| 249 S Ransom St | 0.38mi | 2/2.0 (-1) | 1,162 (-6%) | 3mo | $147,000 | $127 | 60 |
| 313 W Williams St | 0.64mi | 2/1.5 (-1) | 1,248 (+1%) | 3mo | $160,000 | $128 | 59 |
| 525 Boone Ave | 0.22mi | 2/1.0 (-1) | 1,120 (-10%) | 12mo | $88,000 | $79 | 59 |
| 514 Wabash Ave | 0.21mi | 3/1.5 | 1,092 (-12%) | 12mo | $119,500 | $109 | 58 |
| 916 S Weller St | 0.32mi | 3/1.0 | 1,070 (-14%) | 6mo | $134,000 | $125 | 57 |
| 549 Elma St | 0.61mi | 3/2.0 | 1,364 (+10%) | 8mo | $148,000 | $109 | 44 |
| 511 Ray St | 0.61mi | 3/2.0 | 1,389 (+12%) | 13mo | $178,500 | $129 | 37 |
Match score weights: distance 35% · size 25% · config 20% · recency 20%. Top-matched comps best support the ARV.
Projected returns pro-forma
-3.0% appreciation · 3.0% rent growth · sell at horizon
- IRR
- 0.1%
- Equity multiple
- 1.00×
- Total profit
- $122
- Equity at exit
- $17,147
- IRR
- 9.8%
- Equity multiple
- 1.76×
- Total profit
- $24,329
- Equity at exit
- $9,943
Cash invested: $32,200 (down + closing). Projections, not guarantees.
Landlord ↔ Tenant lean methodology
- Overall (STATE)
- 83 Strongly Landlord-Friendly
- State Iowa
- 83 Strongly Landlord-Friendly · R+6
- County
- — inherits STATE
- City
- — inherits STATE
ZIP-level market 52501
- Active inventory
- 186
- Price-to-rent
- 6.9×
Monthly cashflow live
- Estimated rent
- $1,387 medium interval (Pro) →
- Mortgage (P&I)
- −$603
- Tax from tax record
- −$150 /mo · $1,804/yr
- Insurance
- −$48
- HOA
- −$0
- Vacancy / Maint / Mgmt
- −$291
- Net cashflow
- $294
Break-even live
UW: 25.0% down · 7.5% · 30yr · 1.5% tax · 5.0% vac · 8.0% maint · 8.0% mgmt
Financing live
Cash to close
- Down payment
- $28,750
- Closing costs
- $3,450
- Reserves months
- —
- Total cash needed
- —
Loan-product check · same deal, 3 products live
Conventional
25% down · 7.5% · 30yr
- Down + closing
- —
- Monthly P&I
- —
- Monthly cashflow
- —
- DSCR
- —
- Eligible?
- —
Personal DTI + credit; lowest rate.
DSCR
20% down · 8.5% · 30yr
- Down + closing
- —
- Monthly P&I
- —
- Monthly cashflow
- —
- DSCR
- —
- Eligible?
- —
No personal income docs; deal must DSCR.
Hard money
10% down · 12.0% · 12mo
- Down + closing
- —
- Monthly P&I
- —
- Monthly cashflow
- —
- DSCR
- —
- Eligible?
- —
Short-term bridge; refi at stabilization.
Listing history 3 events
-
2026-05-15status Pending 1003-char remark
Show marketing remark (1003 chars)
Affordable In-Town Living with Investment Potential – Ottumwa, IA Discover this 3-bedroom, 1-bath home in the heart of Ottumwa, offering 1,238 sq ft of comfortable living space on a 0.15-acre lot in Wapello County. This property features generously sized bedrooms, a spacious living room, and hardwood floors that add warmth and character throughout. The home includes a solid basement with excellent potential for storage or future finishing, along with a detached 2-car garage and concrete pad for additional parking or outdoor use. Ideal for owner-occupants or investors, this property offers strong rental potential and an excellent value-add opportunity. Affordable homes with this kind of space and upside are increasingly hard to find—schedule your showing today. KEY FEATURES 3 Bedrooms / 1 Bathroom 1,238 Sq Ft Spacious living room Hardwood floors Large bedrooms Solid basement with potential Detached 2-car garage Concrete pad In-town location Strong rental/investment opportunity
-
2026-04-21$114,999 Active 1003-char remark
Show marketing remark (1003 chars)
Affordable In-Town Living with Investment Potential – Ottumwa, IA Discover this 3-bedroom, 1-bath home in the heart of Ottumwa, offering 1,238 sq ft of comfortable living space on a 0.15-acre lot in Wapello County. This property features generously sized bedrooms, a spacious living room, and hardwood floors that add warmth and character throughout. The home includes a solid basement with excellent potential for storage or future finishing, along with a detached 2-car garage and concrete pad for additional parking or outdoor use. Ideal for owner-occupants or investors, this property offers strong rental potential and an excellent value-add opportunity. Affordable homes with this kind of space and upside are increasingly hard to find—schedule your showing today. KEY FEATURES 3 Bedrooms / 1 Bathroom 1,238 Sq Ft Spacious living room Hardwood floors Large bedrooms Solid basement with potential Detached 2-car garage Concrete pad In-town location Strong rental/investment opportunity
-
2008-07-29soldstatus $59,000
ⓘ Source: listings_history table (triggers on properties + properties_extension) + one-shot
backfill from property_details.listing_events for pre-trigger history.
Tax reassessment forecast IA · Partial reset (capped growth)
- Current annual tax
- $1,804 · $150/mo
- Projected year-2 tax
- $1,805 · $150/mo
- Expected delta
- +$1/yr ($0/mo · 0.0%)
ⓘ Screening estimate from a state-policy table — verify with the county assessor before closing.
Climate risk First Street
- Flood 1/10 Low FEMA zone X (unshaded) · 0% chance over 30 yrs
- Wildfire 4/10 Moderate
- Heat 3/10 Moderate 7 d/yr ≥106°F today · 15 d/yr by 30 yrs out
- Wind 2/10 Low
- Air quality 2/10 Low 1 unhealthy d/yr today · 1 by 30 yrs out
Nearby sold comps map
Loading sold comps map…
Walkable amenities ~0.75 mi
Loading nearby amenities…
Taxation est. · year 1
- Rental income
- $16,639
- − Mortgage interest
- −$6,442
- − Property taxes
- −$1,804
- − Insurance
- −$575
- − Repairs & maintenance
- −$1,331
- − Management
- −$1,331
- − Depreciation
- −$3,345
- Taxable income
- $1,811
- Est. tax owed @ 24.0%
- −$435
- After-tax cash flow
- $3,095/yr
For passive investors: Depreciation is non-cash, so a rental often shows a tax loss while cash-flowing — sheltering income. Rental losses are passive: they offset passive income freely, and up to $25,000/yr can offset ordinary (W-2) income if you actively participate and your MAGI is under $100k (phasing out to $0 by $150k); unused losses carry forward. On sale, claimed depreciation is recaptured at up to 25%, and gains may owe capital-gains tax (a 1031 exchange can defer both). Figures are a year-1 estimate at your 24.0% rate — not tax advice; consult a CPA.
Schools (NCES district)
- District
- Ottumwa Community School District
- NCES district ID
- 1922110
- Math proficiency
- 50% ▼ -9.00%
- Reading proficiency
- 54% ▲ 1.00%
- Median HH income
- $39,864
- Composite
- 43.46/100
- National rank
- #3004
- State rank
- #277 of 289 in IA
Livability — Ottumwa
- Score
- 80/100
- State rank
- #91
- US rank
- #1900
Category grades
Schools grade is shown separately in the Schools card above.
Census & demographics
- Census place
- Ottumwa, IA
- Population (ZIP)
- 30,341
Population outlook (Wapello County) Hauer SSP2
- Today (2025)
- 35,472 people
- By 2030
- 35,563 · +0.3%
- By 2040
- 36,083 · +1.7%
- By 2050
- 37,287 · +5.1%
- By 2075
- 43,898 · +23.8%
- By 2100
- 52,973 · +49.3%
Race, ethnicity, and origin ACS 2023
- Neighborhood character
- Predominantly White (74%)
- Race & ethnicity
- White 74% Hispanic / Latino 14% Two or more races 7% Black 4% Pacific Islander 2% Asian 2%
- Hispanic origin (detail)
- Mexican 9%
- Common ancestry
- Iranian 4% Italian 1% Slovak 1%
- Foreign-born
- 11% · Canada
- Languages at home
- 84% English-only · Spanish 10% Other Asian/Pacific 3% Tagalog/Filipino 1%
Political lean MEDSL · Wapello
- 2024 margin
- Solid R (+31.4) · D 33.6% · R 65.0% · Other 1.4%
- 2008→2024 swing
- -45.0pp toward R · 2008: 13.5pp · 2024: -31.4pp
- All cycles
- 2024: R+31.4 2020: R+23.6 2016: R+20.8 2012: D+11.8 2008: D+13.5
Not yet ingested
- Civics
- —
Market trends
- HPI YoY
- ▼ -94.66%
- Current HPI
- 174.6021
- Rent YoY
- —
- Metro
- —
- State GDP YoY
- ▲ 2.48%
- F500 in state
- 4
Industry mix (Fortune 500 HQ in IA)
| Industry | F500 HQs | Revenue |
|---|---|---|
| Financial Services | 1 | $16B |
|
||
| Retail / Convenience | 1 | $15B |
|
||
Price history
+94.9% since first listed3 events — show timeline
- 2026-05-15 Pending — IAR
- 2026-04-21 Listed $114,999 IAR
- 2008-07-29 Sold (Public Records) $59,000 Public Records
Property tax history
+2.1%/yrLatest (2025): $1,804 · +5.3% YoY. Source: county tax records.
Cash-flow waterfall
monthlySold comps — $/sqft
last 12 mo · ≤1 miLoading sold comps…