 🌊 Lakefront
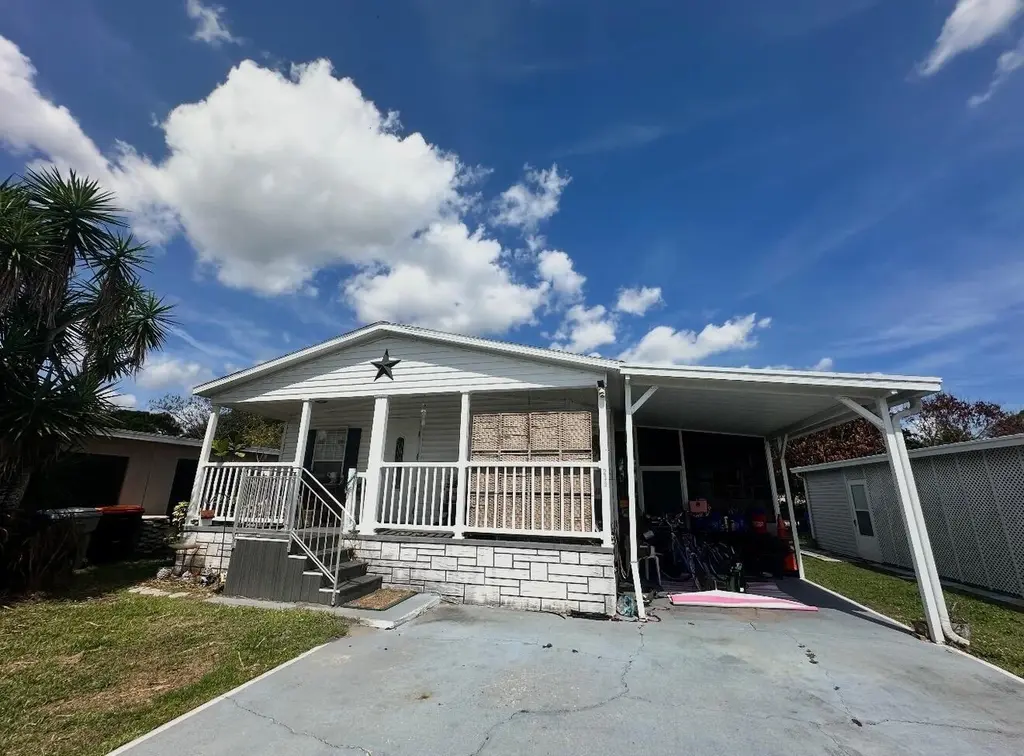
1455 90th Ave #235 · West Vero Corridor, FL
Flood risk No data
- FEMA flood zone
- —
- Chance of flooding over 30 yrs
- —
- Est. flood insurance / yr
- —
Fire risk No data
- Est. fire insurance / yr
- —
Heat risk No data
- Hot days now (above threshold)
- —
- Hot days in 30 yrs
- —
Wind risk No data
- Chance of severe wind over 30 yrs
- —
Air-quality risk No data
- Unhealthy air days now
- —
- Unhealthy air days in 30 yrs
- —
Risk factors via First Street. Map © Google.
Why this score? — see what drove the B grade
The composite is a weighted blend of 9 inputs, each scored 0–100. Each bar is that input's sub-score; the figure is the points it added to the 100-point composite (weight × sub-score).
- Cash flow +30.0/30.0
- 1% rule +10.0/10.0
- DSCR +10.0/10.0
- ARV discount +7.5/15.0
- Schools +4.2/10.0
- Livability +3.7/5.0
- Rent growth +2.7/5.0
- Condition / age +2.5/5.0
- Appreciation +0.0/10.0
$65,000
🖨 Deal sheet 📄 Offer letter ✓ Due diligence
Listing remarks
harming 2-bedroom, 2-bath manufactured home in the desirable all-age community of Lakewood Village in Vero Beach! This well-maintained 1,056 sq. ft. residence (built 2006) offers comfortable living with an open layout perfect for relaxing or entertaining. Enjoy the family-friendly, pet-friendly park atmosphere with great amenities, low lot rent, and convenient access to beaches, shopping, and dining. The home will be updated prior to closing with brand new flooring throughout and freshly painted walls for a move-in ready feel. Don't miss this affordable opportunity to own in one of Vero Beach's most welcoming all-age communities, schedule your showing today! More pictures to come!
Key facts
- Pet-friendly park
- Great amenities
- Low lot rent
Tags
Property features AI
Finance
- Other: Pets allowed (cats and dogs OK)
- HOA & community: Community association with monthly fees; Association amenities include clubhouse, fitness center, park, playground, pool, shuffleboard court, tennis courts, management, and on-site manager; Association fees cover grounds maintenance, sewer, trash, and water
Exterior
- Parking: Attached carport (1 covered space, 1 carport space); Total 2 parking spaces
- Utilities: Public water; Public sewer; Electricity available; Cable available
- Home design: Manufactured home; Single-story; Faces east; Resale condition
- Construction: Vinyl siding; Metal roof; Living area approximately 1,050; Building area approximately 1,860
- Exterior features: Not water-fronting
Interior
- Kitchen: Dishwasher; Microwave; Refrigerator; Freezer
- Bedrooms: 2 bedrooms on the main level
- Flooring: Vinyl flooring
- Bathrooms: 2 full bathrooms on the main level
- Heating & cooling: Electric heating; Central air conditioning
- Interior features: No notable interior features listed
Neighborhood map
What this means for you Summary
Snapshot
- This is a 3-bed/2.0-bath manufactured listed at $65k.
Deal economics
- At list price, monthly cash flow is $1k ($13k/yr) — positive.
- The deal already cash-flows at list — no discount required.
- Meets the 1% rule at list price ($2k rent vs $65k).
- Recommended offer: $64k (1.5% below list) — sets the bar for market timing.
- Cap rate 27.0% vs local median 4.0% in West Vero Corridor — top-decile yield for the area; either an underpriced asset or a hidden risk that comps aren't pricing in. Stress-test before assuming the spread holds.
Location & tenants
- Location reads 74/100 on livability (#273 in FL, #4,421 nationally) — a middle-class / working-renter tenant base. Strengths: cost of living A+, housing A+, commute A; Watch: amenities F, health & safety D-.
- Indian River (other): math 48% / reading 52% proficiency, ranked #35 of 73 in FL (top 48%) — acceptable for families but not a draw, mixed tenant base, ~2y average lease.
- Zoned schools: Dodgertown Elementary School (math 27% / reading 32%, grade F, #1,896 of 2,144 statewide, top 90%, 485 students, 78% FRL); Storm Grove Middle School (math 54% / reading 55%, grade B-, #183 of 571 statewide, top 34%, 1,020 students, 50% FRL); Vero Beach High School (math 28% / reading 43%, grade F, #367 of 667 statewide, top 57%, 2,847 students, 50% FRL).
- Market conditions: Rents flat; 380 active listings in the ZIP; 11 comparable units currently listed for rent nearby; rentals at typical pace (median 21d on market — plan ~3-4 weeks tenant-placement turnaround); 564 units permitted in Indian River County in 2024 (281 in 5+ unit buildings).
- This rent runs 36% of the median local income ($67k/yr) — at the standard rent-burdened threshold; future hikes will face affordability resistance.
Forward outlook
- Local home prices are declining (-3.0%/yr); year-one equity from $449 of loan paydown is wiped out by about $2k of value loss. Plan a longer hold.
- Indian River County population projected at +18% by 2050 — long-run rental-demand tailwind backs the buy-and-hold thesis.
- At projected returns (-3.0% appreciation + 0.6% rent growth), your $18k cash investment doubles in ~2 years — after that, you're playing with house money.
Negotiation context
- It's been on market 29 days — a 2% lower offer ($64k) is reasonable based on typical stale-listing flexibility.
Questions for the listing agent
- Is there a deadline driving the sale (1031 exchange, divorce, estate, relocation)? That informs how much negotiation room exists.
- Schools are F-rated, which usually means shorter tenancies and higher turnover. Who's the typical renter profile here, and what's been the actual vacancy rate?
- This sits on a lake — are riparian / water-frontage rights deeded with the parcel? Any dock permits, shoreline easements, or HOA water-use restrictions?
- What's the documented flood / surge / shoreline-erosion history here (FEMA AND non-FEMA — e.g., storm surge, creek backup, septic-field saturation)?
- Any water-quality or seasonal algae-bloom issues that affect tenant satisfaction or short-term-rental demand?
- What's the average days-on-market for RENTAL listings here right now (not sales)? A rising rental-DOM trend means longer vacancies and softer asking-rent achievability than the comps imply.
- What's the recent tenant-quality profile in this submarket — average credit score on applications, eviction rate, late-payment / NSF rate, and stable-employment percentage? A property-management company in the area should have these aggregated.
- How much new for-sale + rental construction is in the pipeline within 1–3 miles? Heavy new supply typically softens prices + rents 12–24 months out; constrained supply supports both.
Investment metrics
- 1% rule
- 3.05% ✓
- Cap rate
- 27.02%
- Cash-on-cash
- 74.03%
- DSCR
- 4.29
- GRM
- 2.7
CMA / ARV
No comps found within radius.
Projected returns pro-forma
-3.0% appreciation · 0.6% rent growth · sell at horizon
- IRR
- 71.1%
- Equity multiple
- 4.10×
- Total profit
- $56,333
- Equity at exit
- $9,692
- IRR
- 74.4%
- Equity multiple
- 7.76×
- Total profit
- $122,976
- Equity at exit
- $5,620
Cash invested: $18,200 (down + closing). Projections, not guarantees.
Landlord ↔ Tenant lean methodology
- Overall (STATE)
- 87 Strongly Landlord-Friendly
- State Florida
- 87 Strongly Landlord-Friendly · R+3
- County
- — inherits STATE
- City
- — inherits STATE
ZIP-level market 32966
- Home prices YoY
- -26.7%
- Rents YoY
- 0.6%
- Active inventory
- 380
- Price-to-rent
- 2.7×
Monthly cashflow live
- Estimated rent
- $1,980 high interval (Pro) →
- Mortgage (P&I)
- −$341
- Tax from tax record
- −$73 /mo · $880/yr
- Insurance
- −$27
- HOA
- −$0
- Vacancy / Maint / Mgmt
- −$416
- Net cashflow
- $1,123
Break-even live
UW: 25.0% down · 7.5% · 30yr · 1.5% tax · 5.0% vac · 8.0% maint · 8.0% mgmt
Financing live
Cash to close
- Down payment
- $16,250
- Closing costs
- $1,950
- Reserves months
- —
- Total cash needed
- —
Loan-product check · same deal, 3 products live
Conventional
25% down · 7.5% · 30yr
- Down + closing
- —
- Monthly P&I
- —
- Monthly cashflow
- —
- DSCR
- —
- Eligible?
- —
Personal DTI + credit; lowest rate.
DSCR
20% down · 8.5% · 30yr
- Down + closing
- —
- Monthly P&I
- —
- Monthly cashflow
- —
- DSCR
- —
- Eligible?
- —
No personal income docs; deal must DSCR.
Hard money
10% down · 12.0% · 12mo
- Down + closing
- —
- Monthly P&I
- —
- Monthly cashflow
- —
- DSCR
- —
- Eligible?
- —
Short-term bridge; refi at stabilization.
Rent comps 11 comps
| Address | Beds | Baths | Sqft | Rent | $/sqft | DOM | Units | Dist |
|---|---|---|---|---|---|---|---|---|
| 589 Johnathans Cay Vero Beach, FL | 3.0 | 2.0 | 1409 | $1,799 | $1.28 | 13d | 1 | 0.51mi |
| 8775 20th St #909 Vero Beach, FL | 2.0 | 2.0 | 1000 | $1,799 | $1.80 | 21d | 1 | 0.81mi |
| 8775 20th St #925 Vero Beach, FL | 3.0 | 2.0 | 1356 | $1,799 | $1.33 | 21d | 1 | 0.81mi |
| 8775 20th St #59 Vero Beach, FL | 2.0 | 2.0 | 1147 | $1,699 | $1.48 | 21d | 1 | 0.81mi |
| 1405 82nd Ave #19 Vero Beach, FL | 2.0 | 2.0 | 842 | $1,699 | $2.02 | 21d | 1 | 0.96mi |
| 344 Heritage Blvd Vero Beach, FL | 2.0 | 2.0 | 1000 | $1,499 | $1.50 | 21d | 1 | 0.98mi |
| 174 Congress St Vero Beach, FL | 2.0 | 2.0 | 1200 | $1,700 | $1.42 | 21d | 1 | 1.00mi |
| 2365 89th Dr Vero Beach, FL | 2.0 | 2.0 | 1182 | $1,700 | $1.44 | 21d | 1 | 1.02mi |
| 2240 86th Dr Vero Beach, FL | 2.0 | 2.0 | 951 | $1,875 | $1.97 | 21d | 1 | 1.12mi |
| 8415 22nd St Vero Beach, FL | 2.0 | 2.0 | 1100 | $2,000 | $1.82 | 13d | 1 | 1.27mi |
| 862 S Verona Trace Dr Vero Beach, FL | 3.0 | 2.5 | 903 | $2,300 | $2.55 | 21d | 1 | 1.27mi |
Listing history 17 events
-
2026-06-19days on market $65,000 Active 29 DOM
-
2026-06-18days on market $65,000 Active 28 DOM
-
2026-06-17days on market $65,000 Active 27 DOM
-
2026-06-16days on market $65,000 Active 26 DOM
-
2026-06-15days on market $65,000 Active 25 DOM
-
2026-06-14days on market $65,000 Active 23 DOM
-
2026-06-13days on market $65,000 Active 22 DOM
-
2026-06-10days on market $65,000 Active 20 DOM
-
2026-06-09days on market $65,000 Active 19 DOM
-
2026-06-08days on market $65,000 Active 18 DOM
-
2026-06-07days on market $65,000 Active 17 DOM
-
2026-06-05days on market $65,000 Active 14 DOM
-
2026-06-02days on market $65,000 Active 12 DOM
-
2026-06-01days on market $65,000 Active 11 DOM
-
2026-05-31days on market $65,000 Active 10 DOM
-
2026-05-30days on market $65,000 Active 9 DOM
-
2026-05-20$65,000 Active
ⓘ Source: listings_history table (triggers on properties + properties_extension) + one-shot
backfill from property_details.listing_events for pre-trigger history.
Tax reassessment forecast FL · Resets to sale price
- Current annual tax
- $880 · $73/mo
- Projected year-2 tax
- $880 · $73/mo
- Expected delta
- $0/yr ($0/mo · 0.0%)
ⓘ Screening estimate from a state-policy table — verify with the county assessor before closing.
Nearby sold comps map
Loading sold comps map…
Walkable amenities ~0.75 mi
Loading nearby amenities…
Taxation est. · year 1
- Rental income
- $23,758
- − Mortgage interest
- −$3,641
- − Property taxes
- −$880
- − Insurance
- −$325
- − Repairs & maintenance
- −$1,901
- − Management
- −$1,901
- − Depreciation
- −$1,891
- Taxable income
- $13,220
- Est. tax owed @ 24.0%
- −$3,173
- After-tax cash flow
- $10,301/yr
For passive investors: Depreciation is non-cash, so a rental often shows a tax loss while cash-flowing — sheltering income. Rental losses are passive: they offset passive income freely, and up to $25,000/yr can offset ordinary (W-2) income if you actively participate and your MAGI is under $100k (phasing out to $0 by $150k); unused losses carry forward. On sale, claimed depreciation is recaptured at up to 25%, and gains may owe capital-gains tax (a 1031 exchange can defer both). Figures are a year-1 estimate at your 24.0% rate — not tax advice; consult a CPA.
Schools (NCES district)
- District
- Indian River
- NCES district ID
- 1200930
- Math proficiency
- 48% ▼ -9.00%
- Reading proficiency
- 52% ▼ -3.00%
- Median HH income
- $46,597
- Composite
- 42.45/100
- National rank
- #3218
- State rank
- #35 of 73 in FL
Livability — West Vero Corridor
- Score
- 74/100
- State rank
- #273
- US rank
- #4421
Category grades
Schools grade is shown separately in the Schools card above.
Census & demographics
- Census place
- West Vero Corridor, FL
- County
- Indian River County · 143,738 people
- Metro
- Sebastian-Vero Beach, FL
- Population (ZIP)
- 20,686
- Household income
- $66,771
- Rent vs Own
- Severe rent burden
- 766.0
Population outlook (Indian River County) Hauer SSP2
- Today (2025)
- 165,104 people
- By 2030
- 172,869 · +4.7%
- By 2040
- 185,640 · +12.4%
- By 2050
- 194,465 · +17.8%
- By 2075
- 211,115 · +27.9%
- By 2100
- 211,781 · +28.3%
Race, ethnicity, and origin ACS 2023
- Neighborhood character
- Predominantly White (83%)
- Race & ethnicity
- White 83% Hispanic / Latino 9% Two or more races 7% Black 5%
- Hispanic origin (detail)
- Puerto Rican 4% Cuban 1%
- Common ancestry
- Romanian 5% Lithuanian 3% Slovak 2%
- Foreign-born
- 8% · Canada, Jamaica
- Languages at home
- 90% English-only · Spanish 7% Russian/Polish/Slavic 1% French/Haitian/Cajun 1%
Political lean MEDSL · Indian River
- 2024 margin
- Strong R (+27.4) · D 36.0% · R 63.4%
- 2008→2024 swing
- -12.5pp toward R · 2008: -14.8pp · 2024: -27.4pp
- All cycles
- 2024: R+27.4 2020: R+21.6 2016: R+24.5 2012: R+22.3 2008: R+14.8
Not yet ingested
- Civics
- —
Market trends
- HPI YoY
- ▼ -102.01%
- Current HPI
- 280.669
- Rent YoY
- ▲ 0.60%
- Metro
- Sebastian-Vero Beach, FL
- State GDP YoY
- ▲ 3.28%
- F500 in state
- 36
Industry mix (Fortune 500 HQ in FL)
| Industry | F500 HQs | Revenue |
|---|---|---|
| Industrial Technology | 2 | $29B |
|
||
| Insurance | 2 | $17B |
|
||
| Retail | 1 | $60B |
|
||
| Technology Distribution | 1 | $58B |
|
||
| Homebuilding | 1 | $35B |
|
||
| Technology Manufacturing | 1 | $35B |
|
||
Price history
1 event — show timeline
- 2026-05-20 Listed $65,000 Beaches MLS
Property tax history
+8.5%/yrLatest (2018): $880 · +5.9% YoY. Source: county tax records.
Cash-flow waterfall
monthlySold comps — $/sqft
last 12 mo · ≤1 miLoading sold comps…