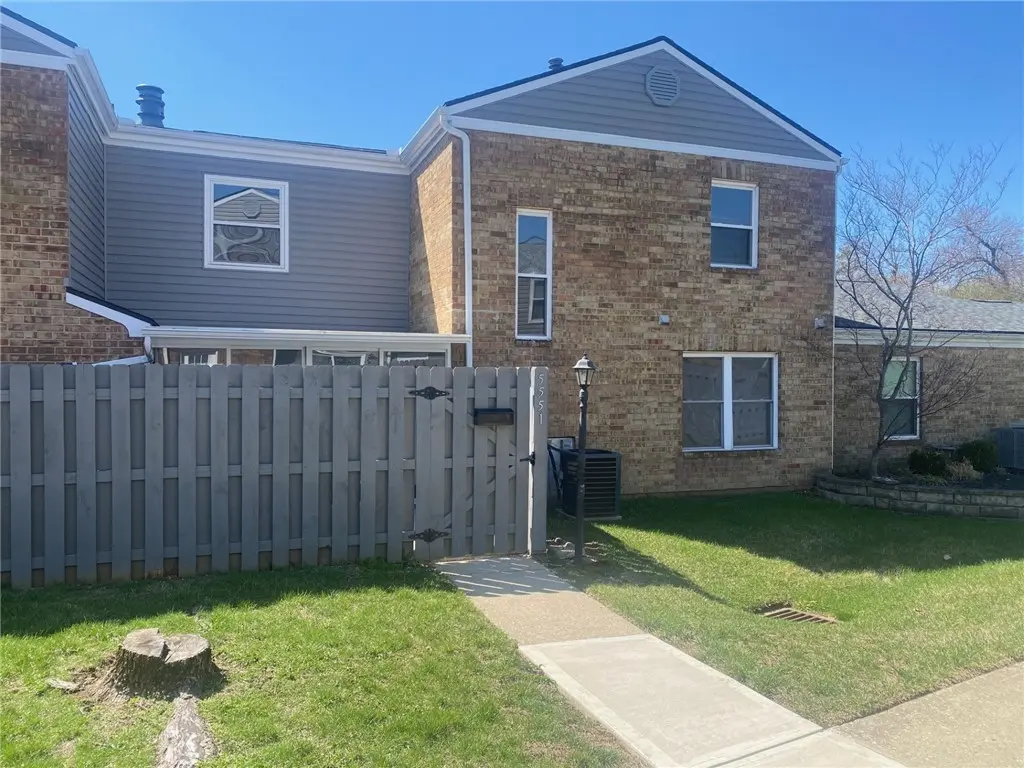
5551 Hummock Rd · Trotwood, OH
Flood risk 1/10 · Minimal
- FEMA flood zone
- X (unshaded)
- Chance of flooding over 30 yrs
- 0.0%
- Est. flood insurance / yr
- $507 – $1,088
Fire risk 1/10 · Minimal
- Est. fire insurance / yr
- $713 – $1,323
Heat risk 4/10 · Minor
- Hot days now (above 101°F)
- 7 days/yr
- Hot days in 30 yrs
- 19 days/yr
Wind risk 2/10 · Minimal
- Chance of severe wind over 30 yrs
- —
Air-quality risk 3/10 · Minor
- Unhealthy air days now
- 3 days/yr
- Unhealthy air days in 30 yrs
- 4 days/yr
Risk factors via First Street. Map © Google.
Why this score? — see what drove the D+ grade
The composite is a weighted blend of 9 inputs, each scored 0–100. Each bar is that input's sub-score; the figure is the points it added to the 100-point composite (weight × sub-score).
- Cash flow +21.8/30.0
- 1% rule +8.8/10.0
- DSCR +7.0/10.0
- Livability +3.0/5.0
- Rent growth +2.5/5.0
- Condition / age +2.5/5.0
- Schools +1.2/10.0
- ARV discount +0.1/15.0
- Appreciation +0.0/10.0
$94,900
🖨 Deal sheet 📄 Offer letter ✓ Due diligence
Listing remarks MLS
Located in the Salem Bend Condos; it has a new roof, new furnace and A/C, newer water heater, laminate flooring and replacement windows. Front patio was partially enclosed with a glass front. Condo offers a swimming pool, children's playground and tennis court. Fireplace is not warranted.
Key facts
- New furnace
- Laminate flooring
- Newer water heater
Tags
Neighborhood map
What this means for you Summary
Snapshot
- This is a 2-bed/1.5-bath condo listed at $95k.
Deal economics
- At list price, monthly cash flow is $147 ($2k/yr) — positive.
- The deal already cash-flows at list — no discount required.
- Meets the 1% rule at list price ($1k rent vs $95k).
- Recommended offer: $89k (6.0% below list) — sets the bar for market timing.
- Cap rate 8.1% vs local median 6.5% in Trotwood — meaningfully above typical; check what's discounted (condition, days-on-market, listing class) to confirm the premium yield is real.
Location & tenants
- Location reads 59/100 on livability (#1,014 in OH) — a working-class tenant base; expect higher turnover. Strengths: cost of living A+, housing A; Watch: employment D, schools F, crime F.
- Trotwood-Madison City (suburban): math 9% / reading 21% proficiency, ranked #645 of 656 in OH (top 98%) — low school quality limits family demand, transient renter base, plan for 1-2y turnover; 78% free/reduced lunch — lower-income household profile, screen leases tightly.
- Market conditions: 48 active listings in the ZIP; 8 comparable units currently listed for rent nearby; rentals at typical pace (median 14d on market — plan ~3-4 weeks tenant-placement turnaround); 907 units permitted in Montgomery County in 2024 (416 in 5+ unit buildings).
- This rent runs 30% of the median local income ($52k/yr) — at the standard rent-burdened threshold; future hikes will face affordability resistance.
Forward outlook
- Local home prices are declining (-3.0%/yr); year-one equity from $656 of loan paydown is wiped out by about $3k of value loss. Plan a longer hold.
- Montgomery County population projected at -10% by 2050 — secular population decline; favor cash flow + early exit over multi-decade hold.
Negotiation context
- It's been on market 71 days — a 6% lower offer ($89k) is reasonable based on typical stale-listing flexibility.
- 11 sale attempts since 16y ago with the ask held roughly flat each time — persistent listings suggest the price (not the market) is what's stuck; bring a comps-based counter.
- Current owner paid $33k; list at $95k implies a 188% gain — meaningful room to come down on a strong offer.
Questions for the listing agent
- It's been on market 71 days. Have you received any prior offers? Is the seller open to a 6% concession, seller financing, or rate buy-down credit?
- Built in 1973 — when were the roof, HVAC, electrical panel, plumbing, and water heater last replaced?
- What does the HOA fee cover, when was the last increase, and are there any pending special assessments or reserve-fund shortfalls?
- Any open or pending special assessments — roof, HVAC, plumbing, elevator, façade? What's the per-unit balance and payoff schedule, and is the seller paying it off at close or rolling it to the buyer?
- Why hasn't it sold? Are there any deal-killer items the seller is aware of (foundation, flood, title, zoning, code violations)?
- Is there a deadline driving the sale (1031 exchange, divorce, estate, relocation)? That informs how much negotiation room exists.
- Schools are F-rated, which usually means shorter tenancies and higher turnover. Who's the typical renter profile here, and what's been the actual vacancy rate?
- Crime grade is F in this area — have there been break-ins, vandalism, or insurance claims at this property in the last 3 years? What carrier currently insures it and at what premium?
- The area grade is low — what's the realistic commute time and amenity access for the typical tenant pool here? Any planned neighborhood developments (good or bad) we should know about?
- What's the average days-on-market for RENTAL listings here right now (not sales)? A rising rental-DOM trend means longer vacancies and softer asking-rent achievability than the comps imply.
- What's the recent tenant-quality profile in this submarket — average credit score on applications, eviction rate, late-payment / NSF rate, and stable-employment percentage? A property-management company in the area should have these aggregated.
- How much new apartment / multifamily construction is in the pipeline within 1–3 miles? Heavy new supply (>2% of stock underway) typically softens rents 12–24 months out; light construction supports rent growth.
Investment metrics
- 1% rule
- 1.38% ✓
- Cap rate
- 8.15%
- Cash-on-cash
- 6.63%
- DSCR
- 1.30
- GRM
- 6.0
CMA / ARV
- ARV (median comp)
- $81,569
- List price
- $94,900
- Delta
- 16.34%
- Verdict
- OVERPRICED
- Comps
- 20 within 1.0 mi
Projected returns pro-forma
-3.0% appreciation · 3.0% rent growth · sell at horizon
- IRR
- -5.9%
- Equity multiple
- 0.78×
- Total profit
- $-5,863
- Equity at exit
- $14,150
- IRR
- 3.9%
- Equity multiple
- 1.29×
- Total profit
- $7,599
- Equity at exit
- $8,205
Cash invested: $26,572 (down + closing). Projections, not guarantees.
Landlord ↔ Tenant lean methodology
- Overall (STATE)
- 73 Landlord-Friendly
- State Ohio
- 73 Landlord-Friendly · R+6
- County
- — inherits STATE
- City
- — inherits STATE
ZIP-level market 45426
- Home prices YoY
- -12.0%
- Active inventory
- 48
- Price-to-rent
- 6.0×
Monthly cashflow live
- Estimated rent
- $1,310 high interval (Pro) →
- Mortgage (P&I)
- −$498
- Tax from tax record
- −$91 /mo · $1,093/yr
- Insurance
- −$40
- HOA
- −$260
- Vacancy / Maint / Mgmt
- −$275
- Net cashflow
- $147
Break-even live
UW: 25.0% down · 7.5% · 30yr · 1.5% tax · 5.0% vac · 8.0% maint · 8.0% mgmt
Financing live
Cash to close
- Down payment
- $23,725
- Closing costs
- $2,847
- Reserves months
- —
- Total cash needed
- —
Loan-product check · same deal, 3 products live
Conventional
25% down · 7.5% · 30yr
- Down + closing
- —
- Monthly P&I
- —
- Monthly cashflow
- —
- DSCR
- —
- Eligible?
- —
Personal DTI + credit; lowest rate.
DSCR
20% down · 8.5% · 30yr
- Down + closing
- —
- Monthly P&I
- —
- Monthly cashflow
- —
- DSCR
- —
- Eligible?
- —
No personal income docs; deal must DSCR.
Hard money
10% down · 12.0% · 12mo
- Down + closing
- —
- Monthly P&I
- —
- Monthly cashflow
- —
- DSCR
- —
- Eligible?
- —
Short-term bridge; refi at stabilization.
Rent comps 8 comps
| Address | Beds | Baths | Sqft | Rent | $/sqft | DOM | Units | Dist |
|---|---|---|---|---|---|---|---|---|
| 5530 Autumn Hills Dr Dayton, OH | 1.0–2.0 | 1.0–2.0 | 737 | $1,035 | $1.40 | 2d | 5 | 0.34mi |
| 5900 Macduff Dr Dayton, OH | 1.0–4.0 | 1.0–2.0 | 1104 | $1,238 | $1.12 | 2d | 17 | 0.64mi |
| 4564 Linchmere Dr Dayton, OH | 3.0 | 3.0 | 1096 | $1,595 | $1.46 | 14d | 1 | 0.70mi |
| 5 Belle Meadows Dr Dayton, OH | 1.0–3.0 | 1.0–2.5 | 950 | $1,159 | $1.22 | 2d | 1 | 0.71mi |
| 4724 Stonehedge St Dayton, OH | 3.0 | 2.0 | 1404 | $1,445 | $1.03 | 43d | 1 | 0.90mi |
| 4303 Drowfield Dr Dayton, OH | 2.0 | 1.5 | 1100 | $1,500 | $1.36 | 14d | 1 | 1.27mi |
| 5200 Greencroft Dr Dayton, OH | 2.0 | 2.0 | 1115 | $1,200 | $1.08 | 21d | 1 | 1.46mi |
| 5200 Greencroft Dr Dayton, OH | 2.0 | 2.0 | 1116 | $1,200 | $1.08 | 2d | 1 | 1.47mi |
HOA detail condo
- Monthly dues
- $260 · $3,120/yr
- Likely covers
- waterpool
- Assessments
- None detected in remarks — confirm with the listing agent.
Listing history 50 events
-
2026-06-18days on market $94,900 Active 71 DOM
-
2026-06-17days on market $94,900 Active 70 DOM
-
2026-06-16days on market $94,900 Active 69 DOM
-
2026-06-15days on market $94,900 Active 68 DOM
-
2026-06-14days on market $94,900 Active 66 DOM
-
2026-06-13days on market $94,900 Active 65 DOM
-
2026-06-10days on market $94,900 Active 63 DOM
-
2026-06-09days on market $94,900 Active 62 DOM
-
2026-06-08days on market $94,900 Active 61 DOM
-
2026-06-07days on market $94,900 Active 60 DOM
-
2026-06-03days on market $94,900 Active 56 DOM
-
2026-06-02days on market $94,900 Active 55 DOM
-
2026-06-01days on market $94,900 Active 54 DOM
-
2026-05-31days on market $94,900 Active 53 DOM
-
2026-05-31days on market $94,900 Active 52 DOM
-
2026-05-15status Active 289-char remark
Show marketing remark (289 chars)
Located in the Salem Bend Condos; it has a new roof, new furnace and A/C, newer water heater, laminate flooring and replacement windows. Front patio was partially enclosed with a glass front. Condo offers a swimming pool, children's playground and tennis court. Fireplace is not warranted.
-
2026-04-09status Pending 289-char remark
Show marketing remark (289 chars)
Located in the Salem Bend Condos; it has a new roof, new furnace and A/C, newer water heater, laminate flooring and replacement windows. Front patio was partially enclosed with a glass front. Condo offers a swimming pool, children's playground and tennis court. Fireplace is not warranted.
-
2026-03-04status Active 289-char remark
Show marketing remark (289 chars)
Located in the Salem Bend Condos; it has a new roof, new furnace and A/C, newer water heater, laminate flooring and replacement windows. Front patio was partially enclosed with a glass front. Condo offers a swimming pool, children's playground and tennis court. Fireplace is not warranted.
-
2026-02-11historical 289-char remark
Show marketing remark (289 chars)
Located in the Salem Bend Condos; it has a new roof, new furnace and A/C, newer water heater, laminate flooring and replacement windows. Front patio was partially enclosed with a glass front. Condo offers a swimming pool, children's playground and tennis court. Fireplace is not warranted.
-
2026-02-08$94,900 Active 289-char remark
Show marketing remark (289 chars)
Located in the Salem Bend Condos; it has a new roof, new furnace and A/C, newer water heater, laminate flooring and replacement windows. Front patio was partially enclosed with a glass front. Condo offers a swimming pool, children's playground and tennis court. Fireplace is not warranted.
-
2025-08-26price $94,900
-
2025-05-02price $99,900
-
2025-03-31price $105,900
-
2024-02-29historical
-
2023-10-27price $99,900
-
2023-10-17price $103,900
-
2023-09-23price $109,900
-
2023-09-07$114,900 Active
-
2017-05-08soldstatus $33,000
-
2017-04-28soldstatus $33,000 Closed
-
2017-04-28soldstatus $33,000 Sold
-
2017-04-05historical Active/Pending
-
2017-02-16$35,000 Active
-
2017-01-30historical
-
2017-01-06$35,000 Active
-
2017-01-01historical
-
2016-07-26$35,000 Active
-
2016-06-17historical
-
2016-06-11price $35,000
-
2016-05-14price $39,900
-
2016-04-07price $49,900
-
2016-02-24$55,000 Active
-
2015-02-12soldstatus $28,000 Closed
-
2015-02-12soldstatus $28,000
-
2015-01-02soldstatus $28,000
-
2014-12-03historical
-
2014-08-07$34,500
-
2014-05-30historical
-
2013-09-19$37,500
-
2010-09-10soldstatus $15,500 Closed
ⓘ Source: listings_history table (triggers on properties + properties_extension) + one-shot
backfill from property_details.listing_events for pre-trigger history.
Tax reassessment forecast OH · Partial reset (capped growth)
- Current annual tax
- $1,093 · $91/mo
- Projected year-2 tax
- $1,287 · $107/mo
- Expected delta
- +$194/yr (+$16/mo · 17.7%)
ⓘ Screening estimate from a state-policy table — verify with the county assessor before closing.
Climate risk First Street
- Flood 1/10 Low FEMA zone X (unshaded) · 0% chance over 30 yrs
- Wildfire 1/10 Low
- Heat 4/10 Moderate 7 d/yr ≥101°F today · 19 d/yr by 30 yrs out
- Wind 2/10 Low
- Air quality 3/10 Moderate 3 unhealthy d/yr today · 4 by 30 yrs out
Nearby sold comps map
Loading sold comps map…
Walkable amenities ~0.75 mi
Loading nearby amenities…
Taxation est. · year 1
- Rental income
- $15,723
- − Mortgage interest
- −$5,316
- − Property taxes
- −$1,093
- − Insurance
- −$474
- − Repairs & maintenance
- −$1,258
- − Management
- −$1,258
- − HOA
- −$3,120
- − Depreciation
- −$2,761
- Taxable income
- $444
- Est. tax owed @ 24.0%
- −$106
- After-tax cash flow
- $1,656/yr
For passive investors: Depreciation is non-cash, so a rental often shows a tax loss while cash-flowing — sheltering income. Rental losses are passive: they offset passive income freely, and up to $25,000/yr can offset ordinary (W-2) income if you actively participate and your MAGI is under $100k (phasing out to $0 by $150k); unused losses carry forward. On sale, claimed depreciation is recaptured at up to 25%, and gains may owe capital-gains tax (a 1031 exchange can defer both). Figures are a year-1 estimate at your 24.0% rate — not tax advice; consult a CPA.
Schools (NCES district)
- District
- Trotwood-Madison City
- NCES district ID
- 3904869
- Math proficiency
- 9% ▼ -15.00%
- Reading proficiency
- 21% ▼ -11.00%
- Median HH income
- $33,529
- Composite
- 12.15/100
- National rank
- #9651
- State rank
- #645 of 656 in OH
Livability — Trotwood
- Score
- 59/100
- State rank
- #1014
- US rank
- #20073
Category grades
Schools grade is shown separately in the Schools card above.
Census & demographics
- Census place
- Trotwood, OH
- County
- Montgomery County · 459,541 people
- City population
- 19,754
- Metro
- Dayton-Kettering, OH
- Population (ZIP)
- 14,114
- Household income
- $51,908
- Rent vs Own
- Severe rent burden
- 852.0
Population outlook (Montgomery County) Hauer SSP2
- Today (2025)
- 523,241 people
- By 2030
- 514,948 · -1.6%
- By 2040
- 493,378 · -5.7%
- By 2050
- 469,639 · -10.2%
- By 2075
- 418,360 · -20.0%
- By 2100
- 353,315 · -32.5%
Race, ethnicity, and origin ACS 2023
- Neighborhood character
- Predominantly Black (69%)
- Race & ethnicity
- Black 69% White 22% Two or more races 7% Asian 2% Hispanic / Latino 1%
- Common ancestry
- Lithuanian 1% Serbian 1%
- Foreign-born
- 3% · Canada
- Languages at home
- 95% English-only · Other Asian/Pacific 1% Spanish 1% French/Haitian/Cajun 1%
Political lean MEDSL · Montgomery
- 2024 margin
- Toss-up / Even · D 49.8% · R 49.3%
- 2008→2024 swing
- -5.8pp toward R · 2008: 6.2pp · 2024: 0.5pp
- All cycles
- 2024: D+0.5 2020: D+2.2 2016: R+1.2 2012: D+3.1 2008: D+6.2
Not yet ingested
- Civics
- —
Market trends
- HPI YoY
- ▼ -44.94%
- Current HPI
- 329.0106
- Rent YoY
- —
- Metro
- Dayton-Kettering, OH
- State GDP YoY
- ▲ 1.98%
- F500 in state
- 48
Industry mix (Fortune 500 HQ in OH)
| Industry | F500 HQs | Revenue |
|---|---|---|
| Insurance | 3 | $145B |
|
||
| Industrial Machinery | 3 | $49B |
|
||
| Financial Services | 3 | $24B |
|
||
| Consumer Goods | 2 | $93B |
|
||
| Aerospace / Defense | 2 | $47B |
|
||
| Utilities | 2 | $33B |
|
||
Price history
+433.6% since first listed40 events — show timeline
- 2026-05-15 Relisted — Dayton MLS
- 2026-04-09 Pending — Dayton MLS
- 2026-03-04 Relisted — Dayton MLS
- 2026-02-11 Listing Removed — Dayton MLS
- 2026-02-08 Listed $94,900 Dayton MLS
- 2025-08-26 Price Changed $94,900 Dayton MLS
- 2025-05-02 Price Changed $99,900 Dayton MLS
- 2025-03-31 Price Changed $105,900 Dayton MLS
- 2024-02-29 Listing Removed — Dayton MLS
- 2023-10-27 Price Changed $99,900 Dayton MLS
- 2023-10-17 Price Changed $103,900 Dayton MLS
- 2023-09-23 Price Changed $109,900 Dayton MLS
- 2023-09-07 Listed $114,900 Dayton MLS
- 2017-05-08 Sold (Public Records) $33,000 Public Records
- 2017-04-28 Sold (MLS) $33,000 Dayton MLS
- 2017-04-28 Sold (MLS) $33,000 Dayton MLS
- 2017-04-05 Contingent — Dayton MLS
- 2017-02-16 Listed $35,000 Dayton MLS
- 2017-01-30 Listing Removed — Dayton MLS
- 2017-01-06 Listed $35,000 Dayton MLS
- 2017-01-01 Listing Removed — Dayton MLS
- 2016-07-26 Listed $35,000 Dayton MLS
- 2016-06-17 Listing Removed — Dayton MLS
- 2016-06-11 Price Changed $35,000 Dayton MLS
- 2016-05-14 Price Changed $39,900 Dayton MLS
- 2016-04-07 Price Changed $49,900 Dayton MLS
- 2016-02-24 Listed $55,000 Dayton MLS
- 2015-02-12 Sold (MLS) $28,000 Dayton MLS
- 2015-02-12 Sold (MLS) $28,000 Dayton MLS
- 2015-01-02 Sold (Public Records) $28,000 Public Records
- 2014-12-03 Listing Removed — Dayton MLS
- 2014-08-07 Listed $34,500 Dayton MLS
- 2014-05-30 Listing Removed — Dayton MLS
- 2013-09-19 Listed $37,500 Dayton MLS
- 2010-09-10 Sold (MLS) $15,500 Dayton MLS
- 2010-09-10 Sold (MLS) $15,500 Dayton MLS
- 2010-08-03 Listing Removed — Dayton MLS
- 2010-05-05 Listed $16,900 Dayton MLS
- 2004-05-06 Sold (Public Records) $53,000 Public Records
- 1985-10-15 Sold (Public Records) $17,784 Public Records
Property tax history
+0.7%/yrLatest (2025): $1,093 · +1.2% YoY. Source: county tax records.
Cash-flow waterfall
monthlySold comps — $/sqft
last 12 mo · ≤1 miLoading sold comps…