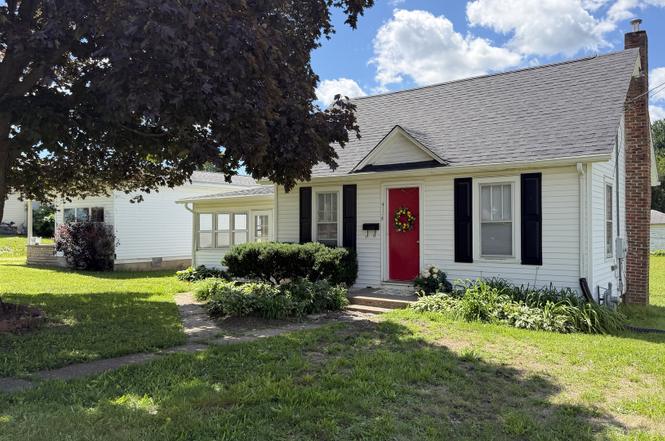
411 E North St · Morrison, IL
Flood risk 1/10 · Minimal
- FEMA flood zone
- X (unshaded)
- Chance of flooding over 30 yrs
- 0.0%
- Est. flood insurance / yr
- $473 – $860
Fire risk 1/10 · Minimal
- Est. fire insurance / yr
- $804 – $1,492
Heat risk 3/10 · Minor
- Hot days now (above 104°F)
- 7 days/yr
- Hot days in 30 yrs
- 16 days/yr
Wind risk 2/10 · Minimal
- Chance of severe wind over 30 yrs
- —
Air-quality risk 3/10 · Minor
- Unhealthy air days now
- 2 days/yr
- Unhealthy air days in 30 yrs
- 3 days/yr
Risk factors via First Street. Map © Google.
Why this score? — see what drove the C+ grade
The composite is a weighted blend of 9 inputs, each scored 0–100. Each bar is that input's sub-score; the figure is the points it added to the 100-point composite (weight × sub-score).
- Cash flow +27.0/30.0
- DSCR +9.4/10.0
- 1% rule +8.4/10.0
- ARV discount +7.5/15.0
- Livability +4.0/5.0
- Rent growth +2.5/5.0
- Condition / age +2.5/5.0
- Schools +2.3/10.0
- Appreciation +0.0/10.0
$63,000
🖨 Deal sheet 📄 Offer letter ✓ Due diligence
Listing remarks MLS
2/3 Bedroom ranch home with a new roof, and newer flooring and paint throughout. This cute and cozy home offers an enclosed sun porch, main floor laundry, an on-demand water heater, and a large back yard. This one is a great price and ready to move in.
Key facts
- Spacious backyard
- New storage shed
- Three-season sunroom
Tags
Property features AI
Finance
- Other: Ownership is fee simple
- Financial info: Special service area: No
- HOA & community: No master association fees required
Exterior
- Parking: No parking details provided
- Security: CO detectors
- Utilities: Public water; Public sewer; Gas water heater
- Home design: Detached single-family home; One-story
- Construction: Built approximately 71–80 years ago; Block foundation; Block and vinyl siding construction; Built before 1978
- Exterior features: Level lot; Lot dimensions approximately 51 x 120
Interior
- Kitchen: Galley-style kitchen (13 x 10) with luxury vinyl flooring; Range; Microwave
- Bedrooms: Master bedroom on main level (9 x 9) with luxury vinyl flooring; Bedroom 2 on main level (9 x 7) with luxury vinyl flooring; Additional enclosed porch (13 x 10) — listed as a room
- Flooring: Luxury vinyl flooring in living room, family room, kitchen, master bedroom, and bedroom 2
- Bathrooms: One full bathroom
- Heating & cooling: Natural gas forced-air heating; Central air conditioning; CO detectors
- Interior features: Five total rooms; Unfinished partial basement
- Laundry & utility: Laundry room; Washer; Dryer; Gas water heater
Neighborhood map
What this means for you Summary
Snapshot
- This is a 2-bed/1.0-bath other listed at $63k.
Deal economics
- At list price, monthly cash flow is $177 ($2k/yr) — positive.
- The deal already cash-flows at list — no discount required.
- Meets the 1% rule at list price ($847 rent vs $63k).
- Cap rate 9.7% vs local median 4.6% in Morrison — top-decile yield for the area; either an underpriced asset or a hidden risk that comps aren't pricing in. Stress-test before assuming the spread holds.
Location & tenants
- Location reads 81/100 on livability (#85 in IL, #1,376 nationally) — a professional / high-income tenant draw. Strengths: cost of living A+, housing A+, health & safety A+; Watch: commute F.
- Morrison CUSD 6 (town): math 22% / reading 31% proficiency, ranked #292 of 620 in IL (top 47%) — low school quality limits family demand, transient renter base, plan for 1-2y turnover.
- Zoned schools: Morrison High School (math 22% / reading 32%, grade F, #218 of 693 statewide, top 35%, 296 students, 0% FRL) — zoned schools average 0% FRL vs 32% district-wide (32 pts lower); this property's tenant base skews higher-income than the district average.
- Market conditions: 35 active listings in the ZIP; 19 units permitted in Whiteside County in 2024 (0 in 5+ unit buildings).
Forward outlook
- Local home prices are declining (-3.0%/yr); year-one equity from $436 of loan paydown is wiped out by about $2k of value loss. Plan a longer hold.
- Whiteside County population projected at -21% by 2050 — secular population decline; favor cash flow + early exit over multi-decade hold.
- At projected returns (-3.0% appreciation + 3.0% rent growth), your $18k cash investment doubles in ~10 years — after that, you're playing with house money.
Negotiation context
- Only 2 days on market — expect competitive offers; lowballing is unlikely to land.
- 10 sale attempts since 5y ago with the ask held roughly flat each time — persistent listings suggest the price (not the market) is what's stuck; bring a comps-based counter.
- Current owner paid $45k; 40% above their basis — modest negotiation headroom, anchor on the comps not their cost.
Risks & watch-outs
- Watch-outs: property tax is 2.6% of price; built in 1950 — expect roof / HVAC / electrical / plumbing capex.
Questions for the listing agent
- Built in 1950 — when were the roof, HVAC, electrical panel, plumbing, and water heater last replaced?
- Property tax is high relative to price — has the assessment been appealed recently, and will the sale trigger a re-assessment?
- Is there a deadline driving the sale (1031 exchange, divorce, estate, relocation)? That informs how much negotiation room exists.
- What's the average days-on-market for RENTAL listings here right now (not sales)? A rising rental-DOM trend means longer vacancies and softer asking-rent achievability than the comps imply.
- What's the recent tenant-quality profile in this submarket — average credit score on applications, eviction rate, late-payment / NSF rate, and stable-employment percentage? A property-management company in the area should have these aggregated.
- How much new for-sale + rental construction is in the pipeline within 1–3 miles? Heavy new supply typically softens prices + rents 12–24 months out; constrained supply supports both.
Investment metrics
- 1% rule
- 1.34% ✓
- Cap rate
- 9.67%
- Cash-on-cash
- 12.05%
- DSCR
- 1.54
- GRM
- 6.2
CMA / ARV
No comps found within radius.
Projected returns pro-forma
-3.0% appreciation · 3.0% rent growth · sell at horizon
- IRR
- 1.7%
- Equity multiple
- 1.06×
- Total profit
- $1,119
- Equity at exit
- $9,394
- IRR
- 11.3%
- Equity multiple
- 1.89×
- Total profit
- $15,692
- Equity at exit
- $5,447
Cash invested: $17,640 (down + closing). Projections, not guarantees.
Landlord ↔ Tenant lean methodology
- Overall (STATE)
- 43 Moderately Tenant-Leaning
- State Illinois
- 43 Moderately Tenant-Leaning · D+7
- County
- — inherits STATE
- City
- — inherits STATE
ZIP-level market 61270
- Home prices YoY
- -22.4%
- Active inventory
- 35
- Price-to-rent
- 6.2×
Monthly cashflow live
- Estimated rent
- $847 medium interval (Pro) →
- Mortgage (P&I)
- −$330
- Tax from tax record
- −$135 /mo · $1,621/yr
- Insurance
- −$26
- HOA
- −$0
- Vacancy / Maint / Mgmt
- −$178
- Net cashflow
- $177
Break-even live
UW: 25.0% down · 7.5% · 30yr · 1.5% tax · 5.0% vac · 8.0% maint · 8.0% mgmt
Financing live
Cash to close
- Down payment
- $15,750
- Closing costs
- $1,890
- Reserves months
- —
- Total cash needed
- —
Loan-product check · same deal, 3 products live
Conventional
25% down · 7.5% · 30yr
- Down + closing
- —
- Monthly P&I
- —
- Monthly cashflow
- —
- DSCR
- —
- Eligible?
- —
Personal DTI + credit; lowest rate.
DSCR
20% down · 8.5% · 30yr
- Down + closing
- —
- Monthly P&I
- —
- Monthly cashflow
- —
- DSCR
- —
- Eligible?
- —
No personal income docs; deal must DSCR.
Hard money
10% down · 12.0% · 12mo
- Down + closing
- —
- Monthly P&I
- —
- Monthly cashflow
- —
- DSCR
- —
- Eligible?
- —
Short-term bridge; refi at stabilization.
Listing history 3 events
-
2026-06-18days on market $63,000 Active 2 DOM
-
2026-06-17remarks 699-char remark
-
2026-06-17$63,000 Active 1 DOM
ⓘ Source: listings_history table (triggers on properties + properties_extension) + one-shot
backfill from property_details.listing_events for pre-trigger history.
Tax reassessment forecast IL · Partial reset (capped growth)
- Current annual tax
- $1,621 · $135/mo
- Projected year-2 tax
- $1,621 · $135/mo
- Expected delta
- $0/yr ($0/mo · 0.0%)
ⓘ Screening estimate from a state-policy table — verify with the county assessor before closing.
Climate risk First Street
- Flood 1/10 Low FEMA zone X (unshaded) · 0% chance over 30 yrs
- Wildfire 1/10 Low
- Heat 3/10 Moderate 7 d/yr ≥104°F today · 16 d/yr by 30 yrs out
- Wind 2/10 Low
- Air quality 3/10 Moderate 2 unhealthy d/yr today · 3 by 30 yrs out
Nearby sold comps map
Loading sold comps map…
Walkable amenities ~0.75 mi
Loading nearby amenities…
Taxation est. · year 1
- Rental income
- $10,160
- − Mortgage interest
- −$3,529
- − Property taxes
- −$1,621
- − Insurance
- −$315
- − Repairs & maintenance
- −$813
- − Management
- −$813
- − Depreciation
- −$1,833
- Taxable income
- $1,236
- Est. tax owed @ 24.0%
- −$297
- After-tax cash flow
- $1,829/yr
For passive investors: Depreciation is non-cash, so a rental often shows a tax loss while cash-flowing — sheltering income. Rental losses are passive: they offset passive income freely, and up to $25,000/yr can offset ordinary (W-2) income if you actively participate and your MAGI is under $100k (phasing out to $0 by $150k); unused losses carry forward. On sale, claimed depreciation is recaptured at up to 25%, and gains may owe capital-gains tax (a 1031 exchange can defer both). Figures are a year-1 estimate at your 24.0% rate — not tax advice; consult a CPA.
Schools (NCES district)
- District
- Morrison CUSD 6
- NCES district ID
- 1726710
- Math proficiency
- 22% ▼ -10.00%
- Reading proficiency
- 31% ▼ -12.00%
- Median HH income
- $51,562
- Composite
- 23.42/100
- National rank
- #7889
- State rank
- #292 of 620 in IL
Livability — Morrison
- Score
- 81/100
- State rank
- #85
- US rank
- #1376
Category grades
Schools grade is shown separately in the Schools card above.
Census & demographics
- Census place
- Morrison, IL
- Population (ZIP)
- 7,067
Population outlook (Whiteside County) Hauer SSP2
- Today (2025)
- 53,736 people
- By 2030
- 51,657 · -3.9%
- By 2040
- 47,169 · -12.2%
- By 2050
- 42,613 · -20.7%
- By 2075
- 32,691 · -39.2%
- By 2100
- 22,638 · -57.9%
Race, ethnicity, and origin ACS 2023
- Neighborhood character
- Predominantly White (92%)
- Race & ethnicity
- White 92% Two or more races 4% Hispanic / Latino 4% Black 1%
- Common ancestry
- Iranian 14% Lithuanian 4% Slovak 2%
- Foreign-born
- 2% · Canada
- Languages at home
- 96% English-only · Spanish 1%
Political lean MEDSL · Whiteside
- 2024 margin
- R (+14.7) · D 41.7% · R 56.4% · Other 2.0%
- 2008→2024 swing
- -32.3pp toward R · 2008: 17.6pp · 2024: -14.7pp
- All cycles
- 2024: R+14.7 2020: R+8.3 2016: R+6.3 2012: D+17.3 2008: D+17.6
Not yet ingested
- Civics
- —
Market trends
- HPI YoY
- ▼ -42.25%
- Current HPI
- 146.0419
- Rent YoY
- —
- Metro
- —
- State GDP YoY
- ▲ 1.59%
- F500 in state
- 60
Industry mix (Fortune 500 HQ in IL)
| Industry | F500 HQs | Revenue |
|---|---|---|
| Insurance | 4 | $201B |
|
||
| Consumer Goods | 4 | $87B |
|
||
| Industrial Machinery | 3 | $64B |
|
||
| Healthcare | 2 | $55B |
|
||
| Retail / Pharmacy | 1 | $148B |
|
||
| Agriculture / Food | 1 | $86B |
|
||
Price history
+35.5% since first listed35 events — show timeline
- 2026-06-16 Listed $63,000 MRED as Distributed by MLS Grid
- 2025-07-31 Sold (Public Records) $45,000 Public Records
- 2025-07-29 Sold (MLS) $45,000 NWIAR
- 2025-07-03 Pending — NWIAR
- 2025-06-20 Relisted — NWIAR
- 2025-06-08 Pending — NWIAR
- 2025-06-06 Relisted — NWIAR
- 2025-05-30 Pending — NWIAR
- 2025-05-22 Listed $54,900 NWIAR
- 2025-01-01 Listing Removed — RMLSA as Distributed by MLS Grid
- 2024-12-31 Listing Removed — MRED as Distributed by MLS Grid
- 2024-09-25 Price Changed — RMLSA as Distributed by MLS Grid
- 2024-09-10 Price Changed — RMLSA as Distributed by MLS Grid
- 2024-08-30 Listed — RMLSA as Distributed by MLS Grid
- 2024-08-12 Listing Removed — MRED as Distributed by MLS Grid
- 2022-10-28 Sold (MLS) $20,000 MRED as Distributed by MLS Grid
- 2022-10-28 Sold (MLS) $20,000 RMLSA as Distributed by MLS Grid
- 2022-10-28 Sold (MLS) $20,000 MRED as Distributed by MLS Grid
- 2022-10-04 Pending — MRED as Distributed by MLS Grid
- 2022-10-04 Listed $20,000 RMLSA as Distributed by MLS Grid
- 2022-10-04 Listed $20,000 MRED as Distributed by MLS Grid
- 2022-07-28 Price Changed $21,900 MRED as Distributed by MLS Grid
- 2022-06-24 Relisted — MRED as Distributed by MLS Grid
- 2022-06-24 Price Changed $24,900 MRED as Distributed by MLS Grid
- 2022-06-16 Listing Removed — MRED as Distributed by MLS Grid
- 2022-04-21 Price Changed $24,900 MRED as Distributed by MLS Grid
- 2022-03-18 Price Changed $26,900 MRED as Distributed by MLS Grid
- 2022-02-03 Price Changed $29,900 MRED as Distributed by MLS Grid
- 2022-01-07 Price Changed $31,900 MRED as Distributed by MLS Grid
- 2021-12-17 Listed $34,900 MRED as Distributed by MLS Grid
- 2021-11-11 Sold (MLS) $23,500 MRED as Distributed by MLS Grid
- 2021-10-11 Pending — MRED as Distributed by MLS Grid
- 2021-10-05 Price Changed $29,900 MRED as Distributed by MLS Grid
- 2021-08-26 Listed $34,900 MRED as Distributed by MLS Grid
- 2005-07-27 Sold (Public Records) $46,500 Public Records
Property tax history
+6.1%/yrLatest (2024): $1,621 · +7.3% YoY. Source: county tax records.
Cash-flow waterfall
monthlySold comps — $/sqft
last 12 mo · ≤1 miLoading sold comps…