 Duplex
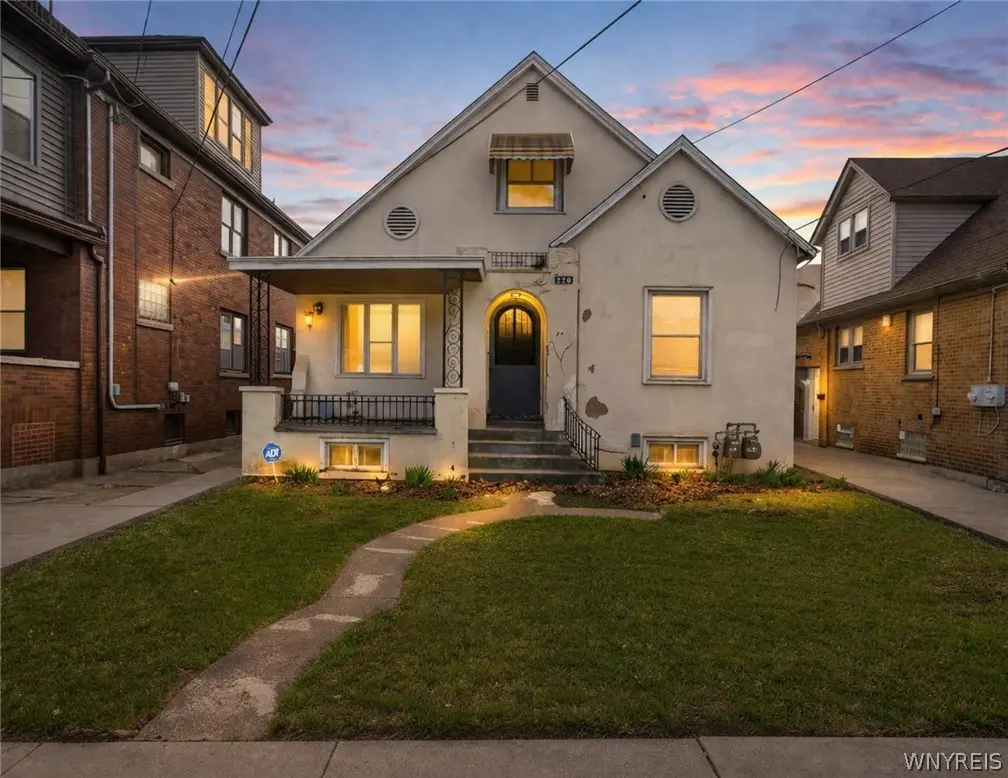
2247 Grand Ave · Niagara Falls, NY
Flood risk 1/10 · Minimal
- FEMA flood zone
- X (unshaded)
- Chance of flooding over 30 yrs
- 0.0%
- Est. flood insurance / yr
- $473 – $860
Fire risk 1/10 · Minimal
- Est. fire insurance / yr
- $691 – $1,283
Heat risk 3/10 · Minor
- Hot days now (above 94°F)
- 7 days/yr
- Hot days in 30 yrs
- 15 days/yr
Wind risk 1/10 · Minimal
- Chance of severe wind over 30 yrs
- —
Air-quality risk 3/10 · Minor
- Unhealthy air days now
- 2 days/yr
- Unhealthy air days in 30 yrs
- 3 days/yr
Risk factors via First Street. Map © Google.
Why this score? — see what drove the A grade
The composite is a weighted blend of 9 inputs, each scored 0–100. Each bar is that input's sub-score; the figure is the points it added to the 100-point composite (weight × sub-score).
- Cash flow +30.0/30.0
- ARV discount +15.0/15.0
- DSCR +10.0/10.0
- Appreciation +10.0/10.0
- 1% rule +9.4/10.0
- Rent growth +4.7/5.0
- Livability +3.0/5.0
- Schools +2.5/10.0
- Condition / age +2.5/5.0
$169,000
🖨 Deal sheet (PDF) 📄 Offer letter ✓ Due diligence
Multi-family units
County records classify this as Multi-Family (2-4 Unit). Listing-text estimate: 2 units. confirmed
Listing remarks MLS
Well-maintained two-family home in Niagara Falls, conveniently located just off Hyde Park Blvd on a quiet, tree-lined street. The property features a spacious 3-bedroom lower unit and a 2-bedroom upper unit, making it ideal for owner-occupants or investors seeking strong rental income. Major capital updates are already done: a brand-new roof (less than 5 years old), all new furnaces, and new hot water tanks for both units. The lower unit was updated a few years ago with new carpeting, offering a clean and comfortable living space. The stucco exterior provides durability and low maintenance, and the oversized three-car garage is a rare bonus. The dry basement adds real value, featuring a bonus kitchen and flexible space perfect for storage, recreation, or extended living use. Walkable to shopping, schools, parks, and everyday amenities, yet tucked away on a peaceful residential street. Strong income potential or a smart opportunity to live in one unit while renting the other to offset your mortgage. A solid, no-nonsense multi-family with updates where they matter most.
Key facts
- New hot water tanks
- Two-family home
- New furnaces
Tags
Neighborhood map
What this means for you Summary
Snapshot
- This is a 2 × 2-bed/1.0-bath units multifamily listed at $169k.
Deal economics
- At list price, monthly cash flow is $635 ($8k/yr) — positive. Per door: $317/mo.
- The deal already cash-flows at list — no discount required.
- Meets the 1% rule at list price ($2k rent vs $169k).
- Recommended offer: $159k (6.0% below list) — sets the bar for market timing.
- Cap rate 10.8% vs local median 7.7% in Niagara Falls — top-decile yield for the area; either an underpriced asset or a hidden risk that comps aren't pricing in. Stress-test before assuming the spread holds.
Location & tenants
- Location reads 60/100 on livability (#956 in NY) — a middle-class / working-renter tenant base. Strengths: cost of living A+, housing A+; Watch: schools F, crime F, amenities F.
- Niagara Falls City School District (urban): math 26% / reading 34% proficiency, ranked #578 of 590 in NY (top 98%) — families likely to look elsewhere, expect single-tenant / working-renter base with shorter leases; 66% free/reduced lunch — lower-income household profile, screen leases tightly.
- Market conditions: Rents rising fast (+8.8%/yr); 164 active listings in the ZIP; 3 comparable units currently listed for rent nearby; rentals leasing fast (median 2d on market — plan ~1-2 weeks tenant-placement turnaround); lower-income renter base — watch delinquency; 167 units permitted in Niagara County in 2024 (0 in 5+ unit buildings).
- At $2,441/mo this rent would consume 85% of the median local household income ($35k/yr) (locally 954% of renters already pay >50% of income on rent) — very limited rent-growth headroom before tenants either downsize or default.
Forward outlook
- In year one you build about $18k of equity ($1k loan paydown + $17k appreciation (10.0% local appreciation)).
- Niagara County population projected at -19% by 2050 — secular population decline; favor cash flow + early exit over multi-decade hold.
- At projected returns (10.0% appreciation + 8.0% rent growth), your $47k cash investment doubles in ~2 years — after that, you're playing with house money.
- By year 3, paydown + projected appreciation supports a ~$46k cash-out refi (75% LTV) — recoverable capital for the next deal without selling this one.
Negotiation context
- It's been on market 62 days — a 6% lower offer ($159k) is reasonable based on typical stale-listing flexibility.
- 2 sale attempts with the ask held roughly flat each time — persistent listings suggest the price (not the market) is what's stuck; bring a comps-based counter.
- Current owner paid $56k; list at $169k implies a 205% gain — meaningful room to come down on a strong offer.
Risks & watch-outs
- Watch-outs: built in 1932 — expect roof / HVAC / electrical / plumbing capex.
Questions for the listing agent
- It's been on market 62 days. Have you received any prior offers? Is the seller open to a 6% concession, seller financing, or rate buy-down credit?
- Can we see the unit-by-unit rent roll, current vacancy, and any below-market leases? What's the average tenancy length?
- What capital expenditures (roof, boiler, parking lot, exteriors) have been made in the last 5 years, and what's planned in the next 2?
- Built in 1932 — when were the roof, HVAC, electrical panel, plumbing, and water heater last replaced?
- Why hasn't it sold? Are there any deal-killer items the seller is aware of (foundation, flood, title, zoning, code violations)?
- Is there a deadline driving the sale (1031 exchange, divorce, estate, relocation)? That informs how much negotiation room exists.
- Schools are F-rated, which usually means shorter tenancies and higher turnover. Who's the typical renter profile here, and what's been the actual vacancy rate?
- Crime grade is F in this area — have there been break-ins, vandalism, or insurance claims at this property in the last 3 years? What carrier currently insures it and at what premium?
- What's the average days-on-market for RENTAL listings here right now (not sales)? A rising rental-DOM trend means longer vacancies and softer asking-rent achievability than the comps imply.
- What's the recent tenant-quality profile in this submarket — average credit score on applications, eviction rate, late-payment / NSF rate, and stable-employment percentage? A property-management company in the area should have these aggregated.
- How much new apartment / multifamily construction is in the pipeline within 1–3 miles? Heavy new supply (>2% of stock underway) typically softens rents 12–24 months out; light construction supports rent growth.
Investment metrics
- 1% rule
- 1.44% ✓
- Cap rate
- 10.80%
- Cash-on-cash
- 16.10%
- DSCR
- 1.72
- GRM
- 5.8
CMA / ARV
- ARV (median comp)
- $243,013
- List price
- $169,000
- Delta
- -30.46%
- Verdict
- UNDERPRICED
- Comps
- 20 within 1.0 mi
Show comp detail 12 sales within ~0.75 mi
| Address | Dist | Beds/Ba | Sqft | Sold | Price | $/sf | Match |
|---|---|---|---|---|---|---|---|
| 2449 Grand Ave | 0.13mi | 5/2.0 | 1,918 (+3%) | 4mo | $135,000 | $70 | 85 |
| 541 20th St | 0.27mi | 5/2.0 | 1,917 (+3%) | 1mo | $112,000 | $58 | 82 |
| 2459 La Salle Ave | 0.31mi | 4/2.0 (-1) | 1,920 (+3%) | 2mo | $160,000 | $83 | 74 |
| 609 24th St | 0.15mi | 4/2.0 (-1) | 2,000 (+8%) | 4mo | $140,000 | $70 | 71 |
| 2219 Walnut Ave | 0.18mi | 6/3.0 (+1) | 2,023 (+9%) | 4mo | $62,500 | $31 | 64 |
| 1535 Pierce Ave | 0.58mi | 4/2.0 (-1) | 1,724 (-7%) | 2mo | $35,000 | $20 | 54 |
| 1623 Linwood Ave | 0.64mi | 4/2.0 (-1) | 1,994 (+7%) | 3mo | $100,000 | $50 | 51 |
| 2443 Pierce Ave | 0.41mi | 4/2.0 (-1) | 2,112 (+14%) | 4mo | $120,000 | $57 | 50 |
| 2208 Weston Ave | 0.67mi | 4/2.0 (-1) | 2,016 (+8%) | 1mo | $55,000 | $27 | 49 |
| 420 18th St | 0.55mi | 4/2.5 (-1) | 1,632 (-12%) | 3mo | $115,000 | $70 | 45 |
| 2463 South Ave | 0.71mi | 4/2.0 (-1) | 2,016 (+8%) | 3mo | $137,500 | $68 | 45 |
| 1867 Michigan Ave | 0.59mi | 4/2.0 (-1) | 2,100 (+13%) | 2mo | $87,000 | $41 | 44 |
Match score weights: distance 35% · size 25% · config 20% · recency 20%. Top-matched comps best support the ARV.
Projected returns pro-forma
10.0% appreciation · 8.0% rent growth · sell at horizon
- IRR
- 38.9%
- Equity multiple
- 4.07×
- Total profit
- $145,486
- Equity at exit
- $152,249
- IRR
- 35.6%
- Equity multiple
- 10.06×
- Total profit
- $428,824
- Equity at exit
- $328,330
Cash invested: $47,320 (down + closing). Projections, not guarantees.
Landlord ↔ Tenant lean methodology
- Overall (STATE)
- 15 Strongly Tenant-Friendly
- State New York
- 15 Strongly Tenant-Friendly · D+10
- County
- — inherits STATE
- City
- — inherits STATE
ZIP-level market 14301
- Home prices YoY
- 6.2%
- Rents YoY
- 8.8%
- Active inventory
- 164
- Price-to-rent
- 11.5×
Monthly cashflow live
- Estimated rent
- $2,441 high interval (Pro) →
- Mortgage (P&I)
- −$886
- Tax from tax record
- −$337 /mo · $4,043/yr
- Insurance
- −$70
- HOA
- −$0
- Vacancy / Maint / Mgmt
- −$513
- Net cashflow
- $635
Break-even live
Sensitivity live
| Price | -10% $730 | -5% $683 | +0% $635 | +5% $587 | +10% $539 |
|---|---|---|---|---|---|
| Rent | -10% $442 | -5% $538 | +0% $635 | +5% $731 | +10% $828 |
| Rate | -1.0pp $720 | -0.5pp $678 | base $635 | +0.5pp $591 | +1.0pp $546 |
2-unit breakdown (identical units grouped — click to expand)
| Units | Beds | Baths | Est. rent |
|---|---|---|---|
| 2× units | 2 | 1 | $2,442 |
| #1 | 2 | 1 | $1,221 |
| #2 | 2 | 1 | $1,221 |
| Total (2 units) | $2,441 | ||
UW: 25.0% down · 7.5% · 30yr · 1.5% tax · 5.0% vac · 8.0% maint · 8.0% mgmt
Financing live
Cash to close
- Down payment
- $42,250
- Closing costs
- $5,070
- Reserves months
- —
- Total cash needed
- —
Loan-product check · same deal, 3 products live
Conventional
25% down · 7.5% · 30yr
- Down + closing
- —
- Monthly P&I
- —
- Monthly cashflow
- —
- DSCR
- —
- Eligible?
- —
Personal DTI + credit; lowest rate.
DSCR
20% down · 8.5% · 30yr
- Down + closing
- —
- Monthly P&I
- —
- Monthly cashflow
- —
- DSCR
- —
- Eligible?
- —
No personal income docs; deal must DSCR.
Hard money
10% down · 12.0% · 12mo
- Down + closing
- —
- Monthly P&I
- —
- Monthly cashflow
- —
- DSCR
- —
- Eligible?
- —
Short-term bridge; refi at stabilization.
Rent comps 3 comps
| Address | Beds | Baths | Sqft | Rent | $/sqft | DOM | Units | Dist |
|---|---|---|---|---|---|---|---|---|
| 2020 Forest Ave Niagara Falls, NY | 4.0 | 2.0 | 1600 | $1,500 | $0.94 | 17d | 1 | 0.21mi |
| 2420 Mackenna Ave Unit 1 Niagara Falls, NY | 4.0 | 1.0 | 1300 | $1,390 | $1.07 | 2d | 1 | 0.75mi |
| 3225 Belden Pl Niagara Falls, NY | 5.0 | 1.5 | 1344 | $1,750 | $1.30 | 2d | 1 | 0.82mi |
Listing history 10 events
-
2026-06-08statusdays on market $169,000 Pending 62 DOM
-
2026-06-07days on market $169,000 Active 61 DOM
-
2026-06-03days on market $169,000 Active 57 DOM
-
2026-06-02days on market $169,000 Active 56 DOM
-
2026-06-01days on market $169,000 Active 55 DOM
-
2026-05-31days on market $169,000 Active 54 DOM
-
2026-04-07historical
Show marketing remark (1084 chars)
Well-maintained two-family home in Niagara Falls, conveniently located just off Hyde Park Blvd on a quiet, tree-lined street. The property features a spacious 3-bedroom lower unit and a 2-bedroom upper unit, making it ideal for owner-occupants or investors seeking strong rental income. Major capital updates are already done: a brand-new roof (less than 5 years old), all new furnaces, and new hot water tanks for both units. The lower unit was updated a few years ago with new carpeting, offering a clean and comfortable living space. The stucco exterior provides durability and low maintenance, and the oversized three-car garage is a rare bonus. The dry basement adds real value, featuring a bonus kitchen and flexible space perfect for storage, recreation, or extended living use. Walkable to shopping, schools, parks, and everyday amenities, yet tucked away on a peaceful residential street. Strong income potential or a smart opportunity to live in one unit while renting the other to offset your mortgage. A solid, no-nonsense multi-family with updates where they matter most.
-
2026-04-07$169,000 Active 1084-char remark
Show marketing remark (1084 chars)
Well-maintained two-family home in Niagara Falls, conveniently located just off Hyde Park Blvd on a quiet, tree-lined street. The property features a spacious 3-bedroom lower unit and a 2-bedroom upper unit, making it ideal for owner-occupants or investors seeking strong rental income. Major capital updates are already done: a brand-new roof (less than 5 years old), all new furnaces, and new hot water tanks for both units. The lower unit was updated a few years ago with new carpeting, offering a clean and comfortable living space. The stucco exterior provides durability and low maintenance, and the oversized three-car garage is a rare bonus. The dry basement adds real value, featuring a bonus kitchen and flexible space perfect for storage, recreation, or extended living use. Walkable to shopping, schools, parks, and everyday amenities, yet tucked away on a peaceful residential street. Strong income potential or a smart opportunity to live in one unit while renting the other to offset your mortgage. A solid, no-nonsense multi-family with updates where they matter most.
-
2026-01-21$169,000 Active
-
2004-10-27soldstatus $55,500
ⓘ Source: listings_history table (triggers on properties + properties_extension) + one-shot
backfill from property_details.listing_events for pre-trigger history.
Tax reassessment forecast NY · Partial reset (capped growth)
- Current annual tax
- $4,043 · $337/mo
- Projected year-2 tax
- $4,043 · $337/mo
- Expected delta
- $0/yr ($0/mo · 0.0%)
ⓘ Screening estimate from a state-policy table — verify with the county assessor before closing.
Climate risk First Street
- Flood 1/10 Low FEMA zone X (unshaded) · 0% chance over 30 yrs
- Wildfire 1/10 Low
- Heat 3/10 Moderate 7 d/yr ≥94°F today · 15 d/yr by 30 yrs out
- Wind 1/10 Low
- Air quality 3/10 Moderate 2 unhealthy d/yr today · 3 by 30 yrs out
Nearby sold comps map
Loading sold comps map…
Walkable amenities ~0.75 mi
Loading nearby amenities…
Taxation est. · year 1
- Rental income
- $29,292
- − Mortgage interest
- −$9,467
- − Property taxes
- −$4,043
- − Insurance
- −$845
- − Repairs & maintenance
- −$2,343
- − Management
- −$2,343
- − Depreciation
- −$4,916
- Taxable income
- $5,334
- Est. tax owed @ 24.0%
- −$1,280
- After-tax cash flow
- $6,337/yr
For passive investors: Depreciation is non-cash, so a rental often shows a tax loss while cash-flowing — sheltering income. Rental losses are passive: they offset passive income freely, and up to $25,000/yr can offset ordinary (W-2) income if you actively participate and your MAGI is under $100k (phasing out to $0 by $150k); unused losses carry forward. On sale, claimed depreciation is recaptured at up to 25%, and gains may owe capital-gains tax (a 1031 exchange can defer both). Figures are a year-1 estimate at your 24.0% rate — not tax advice; consult a CPA.
Schools (NCES district)
- District
- Niagara Falls City School District
- NCES district ID
- 3620820
- Math proficiency
- 26% ▼ -10.00%
- Reading proficiency
- 34% ▲ 3.00%
- Median HH income
- $32,488
- Composite
- 24.5/100
- National rank
- #7655
- State rank
- #578 of 590 in NY
Livability — Niagara Falls
- Score
- 60/100
- State rank
- #956
- US rank
- #18749
Category grades
Schools grade is shown separately in the Schools card above.
Census & demographics
- Census place
- Niagara Falls, NY
- County
- Niagara County · 157,377 people
- City population
- 62,983
- Metro
- Buffalo-Cheektowaga, NY
- Population (ZIP)
- 10,923
- Household income
- $34,549
- Rent vs Own
- Severe rent burden
- 954.0
Population outlook (Niagara County) Hauer SSP2
- Today (2025)
- 204,149 people
- By 2030
- 197,900 · -3.1%
- By 2040
- 182,239 · -10.7%
- By 2050
- 165,198 · -19.1%
- By 2075
- 129,416 · -36.6%
- By 2100
- 96,222 · -52.9%
Race, ethnicity, and origin ACS 2023
- Neighborhood character
- Diverse neighborhood (Simpson 0.58)
- Race & ethnicity
- White 59% Black 25% Two or more races 8% Hispanic / Latino 8% Asian 2%
- Hispanic origin (detail)
- Puerto Rican 3% Cuban 2%
- Common ancestry
- Romanian 6% Slovak 2% Lithuanian 1%
- Foreign-born
- 5% · Canada, China, Dominican Republic
- Languages at home
- 90% English-only · Spanish 6% Other Indo-European 3% Chinese 1%
Political lean MEDSL · Niagara
- 2024 margin
- R (+14.9) · D 42.5% · R 57.5%
- 2008→2024 swing
- -15.9pp toward R · 2008: 1.0pp · 2024: -14.9pp
- All cycles
- 2024: R+14.9 2020: R+9.7 2016: R+19.0 2012: D+0.6 2008: D+1.0
Not yet ingested
- Civics
- —
Market trends
- HPI YoY
- ▲ 15.41%
- Current HPI
- 266.1457
- Rent YoY
- ▲ 8.79%
- Metro
- Buffalo-Cheektowaga, NY
- State GDP YoY
- ▲ 2.60%
- F500 in state
- 92
Industry mix (Fortune 500 HQ in NY)
| Industry | F500 HQs | Revenue |
|---|---|---|
| Financial Services | 10 | $950B |
|
||
| Consumer Goods | 9 | $162B |
|
||
| Insurance | 4 | $225B |
|
||
| Telecommunications | 2 | $144B |
|
||
| Pharmaceuticals | 2 | $112B |
|
||
| Media / Entertainment | 2 | $69B |
|
||
Price history
+204.5% since first listed4 events — show timeline
- 2026-04-07 Listed $169,000 WNYREIS
- 2026-04-07 Listing Removed — WNYREIS
- 2026-01-21 Listed $169,000 WNYREIS
- 2004-10-27 Sold (Public Records) $55,500 Public Records
Property tax history
+6.3%/yrLatest (2025): $4,043 · -22.3% YoY. Source: county tax records.
Cash-flow waterfall
monthlySold comps — $/sqft
last 12 mo · ≤1 miLoading sold comps…