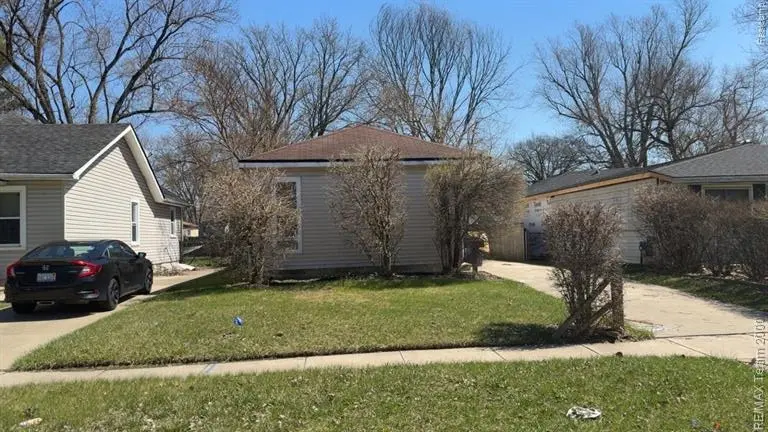
18820 Norborne · Redford, MI
Flood risk 1/10 · Minimal
- FEMA flood zone
- X (unshaded)
- Chance of flooding over 30 yrs
- 0.0%
- Est. flood insurance / yr
- $507 – $1,088
Fire risk 1/10 · Minimal
- Est. fire insurance / yr
- $784 – $1,456
Heat risk 3/10 · Minor
- Hot days now (above 98°F)
- 7 days/yr
- Hot days in 30 yrs
- 15 days/yr
Wind risk 2/10 · Minimal
- Chance of severe wind over 30 yrs
- —
Air-quality risk 3/10 · Minor
- Unhealthy air days now
- 2 days/yr
- Unhealthy air days in 30 yrs
- 3 days/yr
Risk factors via First Street. Map © Google.
Why this score? — see what drove the B grade
The composite is a weighted blend of 9 inputs, each scored 0–100. Each bar is that input's sub-score; the figure is the points it added to the 100-point composite (weight × sub-score).
- Cash flow +30.0/30.0
- ARV discount +15.0/15.0
- DSCR +10.0/10.0
- 1% rule +8.2/10.0
- Rent growth +2.5/5.0
- Livability +2.5/5.0
- Condition / age +2.5/5.0
- Schools +1.4/10.0
- Appreciation +0.0/10.0
$89,900
🖨 Deal sheet 📄 Offer letter ✓ Due diligence
Listing remarks MLS
CLEAN 2 BEDROOM RANCH! MOVE IN READY! 2 CAR DETACHED GARAGE! CLOSE TO SHOPPING AND SCHOOLS! AS IS SALE! LAND CONTRACT TERMS AVAILABLE! ALL DATA IS APPROXIMATE. BUYERS AGENT TO VERIFY ALL INFORMATION.
Key facts
- 5,227 sq ft lot
- 2 garage spots
- Built 1924
Property features AI
Finance
- Other: Located south of 7 Mile and west of Beech Daly (cross street/directions provided)
- Financial info: Annual tax amount reported
- HOA & community: Subdivision: HITCHMAN WALDAMERE PARK SUB
Exterior
- Parking: Detached 2-car garage
- Security: Not specified
- Utilities: Public water; Public sewer
- Home design: Single-family residence; Vinyl siding exterior; One story; Ground-level entry with steps
- Construction: Vinyl siding construction
- Exterior features: Paved road access; Lot dimensions approximately 40 x 134 (0.12 acre); No pool
Interior
- Kitchen: Not specified
- Bedrooms: Not specified
- Flooring: Not specified
- Bathrooms: 1 full bathroom
- Heating & cooling: Forced air heating; Natural gas heating; No central cooling
- Interior features: Crawl space basement; Ground-level entry with steps; One-level layout; Total of 3 rooms
- Laundry & utility: Not specified
Neighborhood map
What this means for you Summary
Snapshot
- This is a 2-bed/1.0-bath single-family listed at $90k.
Deal economics
- At list price, monthly cash flow is $349 ($4k/yr) — positive.
- The deal already cash-flows at list — no discount required.
- Meets the 1% rule at list price ($1k rent vs $90k).
- Recommended offer: $87k (3.0% below list) — sets the bar for market timing.
Location & tenants
- Location reads: area grade B — affects rentability + tenant quality, not the cash-flow math above.
- Redford Union Schools District No. 1 (suburban): math 8% / reading 23% proficiency, ranked #489 of 540 in MI (top 91%) — low school quality limits family demand, transient renter base, plan for 1-2y turnover; 66% free/reduced lunch — lower-income household profile, screen leases tightly.
- Market conditions: 86 active listings in the ZIP; 33 comparable units currently listed for rent nearby; rentals at typical pace (median 24d on market — plan ~3-4 weeks tenant-placement turnaround); 42% of comp listings sitting > 30 days — soft ceiling on asking rent; 2,639 units permitted in Wayne County in 2024 (1,216 in 5+ unit buildings).
Forward outlook
- Local home prices are declining (-3.0%/yr); year-one equity from $622 of loan paydown is wiped out by about $3k of value loss. Plan a longer hold.
- Wayne County population projected at -17% by 2050 — secular population decline; favor cash flow + early exit over multi-decade hold.
- At projected returns (-3.0% appreciation + 3.0% rent growth), your $25k cash investment doubles in ~8 years — after that, you're playing with house money.
Negotiation context
- It's been on market 34 days — a 3% lower offer ($87k) is reasonable based on typical stale-listing flexibility.
- 7 sale attempts since 19y ago with the ask held roughly flat each time — persistent listings suggest the price (not the market) is what's stuck; bring a comps-based counter.
- Current owner paid $6k; list at $90k implies a 1424% gain — meaningful room to come down on a strong offer.
Risks & watch-outs
- Watch-outs: built in 1924 — expect roof / HVAC / electrical / plumbing capex.
Questions for the listing agent
- It's been on market 34 days. Have you received any prior offers? Is the seller open to a 3% concession, seller financing, or rate buy-down credit?
- Built in 1924 — when were the roof, HVAC, electrical panel, plumbing, and water heater last replaced?
- Is there a deadline driving the sale (1031 exchange, divorce, estate, relocation)? That informs how much negotiation room exists.
- What's the average days-on-market for RENTAL listings here right now (not sales)? A rising rental-DOM trend means longer vacancies and softer asking-rent achievability than the comps imply.
- What's the recent tenant-quality profile in this submarket — average credit score on applications, eviction rate, late-payment / NSF rate, and stable-employment percentage? A property-management company in the area should have these aggregated.
- How much new for-sale + rental construction is in the pipeline within 1–3 miles? Heavy new supply typically softens prices + rents 12–24 months out; constrained supply supports both.
Investment metrics
- 1% rule
- 1.32% ✓
- Cap rate
- 10.95%
- Cash-on-cash
- 16.64%
- DSCR
- 1.74
- GRM
- 6.3
CMA / ARV
- ARV (on-the-fly)
- $138,284
- Comps found
- 12
Show comp detail 12 sales within ~0.75 mi
| Address | Dist | Beds/Ba | Sqft | Sold | Price | $/sf | Match |
|---|---|---|---|---|---|---|---|
| 18705 Delaware Ave | 0.40mi | 2/1.0 | 773 (+1%) | 0mo | $140,000 | $181 | 79 |
| 19357 Centralia | 0.29mi | 3/1.0 (+1) | 788 (+3%) | 2mo | $70,000 | $89 | 74 |
| 19363 Centralia | 0.30mi | 2/1.0 | 737 (-4%) | 9mo | $143,000 | $194 | 73 |
| 18404 Dalby St | 0.51mi | 2/1.0 | 719 (-6%) | 2mo | $162,500 | $226 | 65 |
| 18714 Gaylord | 0.44mi | 2/1.0 | 693 (-9%) | 1mo | $165,000 | $238 | 63 |
| 17730 Kinloch | 0.45mi | 2/1.0 | 730 (-4%) | 12mo | $150,000 | $205 | 62 |
| 18515 Sumner | 0.33mi | 2/1.0 | 860 (+13%) | 5mo | $87,000 | $101 | 60 |
| 17606 Norborne | 0.55mi | 3/2.0 (+1) | 818 (+7%) | 0mo | $157,500 | $193 | 53 |
| 18680 Five Points St | 0.62mi | 2/1.5 | 837 (+10%) | 1mo | $95,000 | $114 | 52 |
| 18646 Gaylord | 0.45mi | 3/1.0 (+1) | 840 (+10%) | 10mo | $150,000 | $179 | 49 |
| 18671 Five Points St | 0.60mi | 2/1.0 | 876 (+15%) | 2mo | $72,000 | $82 | 46 |
| 19349 Negaunee | 0.75mi | 2/1.0 | 872 (+14%) | 10mo | $127,000 | $146 | 34 |
Match score weights: distance 35% · size 25% · config 20% · recency 20%. Top-matched comps best support the ARV.
Projected returns pro-forma
-3.0% appreciation · 3.0% rent growth · sell at horizon
- IRR
- 7.8%
- Equity multiple
- 1.30×
- Total profit
- $7,656
- Equity at exit
- $13,404
- IRR
- 17.0%
- Equity multiple
- 2.40×
- Total profit
- $35,275
- Equity at exit
- $7,773
Cash invested: $25,172 (down + closing). Projections, not guarantees.
Landlord ↔ Tenant lean methodology
- Overall (STATE)
- 62 Landlord-Friendly
- State Michigan
- 62 Landlord-Friendly · EVEN
- County
- — inherits STATE
- City
- — inherits STATE
ZIP-level market 48240
- Active inventory
- 86
- Price-to-rent
- 6.3×
Monthly cashflow live
- Estimated rent
- $1,186 high interval (Pro) →
- Mortgage (P&I)
- −$471
- Tax from tax record
- −$79 /mo · $947/yr
- Insurance
- −$37
- HOA
- −$0
- Vacancy / Maint / Mgmt
- −$249
- Net cashflow
- $349
Break-even live
UW: 25.0% down · 7.5% · 30yr · 1.5% tax · 5.0% vac · 8.0% maint · 8.0% mgmt
Financing live
Cash to close
- Down payment
- $22,475
- Closing costs
- $2,697
- Reserves months
- —
- Total cash needed
- —
Loan-product check · same deal, 3 products live
Conventional
25% down · 7.5% · 30yr
- Down + closing
- —
- Monthly P&I
- —
- Monthly cashflow
- —
- DSCR
- —
- Eligible?
- —
Personal DTI + credit; lowest rate.
DSCR
20% down · 8.5% · 30yr
- Down + closing
- —
- Monthly P&I
- —
- Monthly cashflow
- —
- DSCR
- —
- Eligible?
- —
No personal income docs; deal must DSCR.
Hard money
10% down · 12.0% · 12mo
- Down + closing
- —
- Monthly P&I
- —
- Monthly cashflow
- —
- DSCR
- —
- Eligible?
- —
Short-term bridge; refi at stabilization.
Rent comps 33 comps
| Address | Beds | Baths | Sqft | Rent | $/sqft | DOM | Units | Dist |
|---|---|---|---|---|---|---|---|---|
| 26539 Clarita Redford, MI | 3.0 | 1.5 | 931 | $1,875 | $2.01 | 24d | 1 | 0.38mi |
| 18732 Salem Unit 2 Detroit, MI | 2.0 | 1.0 | 925 | $1,050 | $1.14 | 12d | 1 | 0.70mi |
| 19354 Seminole Redford, MI | 3.0 | 1.0 | 1050 | $1,450 | $1.38 | 24d | 1 | 0.85mi |
| 25822 W 6 Mile Rd Redford Township, MI | 2.0 | 2.0 | 1100 | $1,100 | $1.00 | 24d | 1 | 0.88mi |
| 17324 Salem St Detroit, MI | 2.0 | 1.0 | 989 | $1,200 | $1.21 | 24d | 1 | 0.99mi |
| 24224 W 7 Mile Rd Detroit, MI | 1.0–2.0 | 1.0 | 600 | $875 | $1.46 | 43d | 3 | 1.02mi |
| 18302 Wormer St Detroit, MI | 3.0 | 1.0 | 1046 | $1,475 | $1.41 | 43d | 1 | 1.02mi |
| 20083 Salem St Detroit, MI | 3.0 | 1.0 | 969 | $1,050 | $1.08 | 10d | 1 | 1.04mi |
| 20083 Salem St Detroit, MI | 3.0 | 1.0 | 969 | $1,050 | $1.08 | 4d | 1 | 1.04mi |
| 20410 Five Points St Redford, MI | 3.0 | 1.0 | 950 | $1,600 | $1.68 | 4d | 1 | 1.06mi |
| 19250 Telegraph Rd Unit O7 Detroit, MI | 2.0 | 1.0 | 820 | $975 | $1.19 | 24d | 1 | 1.15mi |
| 19264 Telegraph Rd Unit G7 Detroit, MI | 2.0 | 1.0 | 820 | $975 | $1.19 | 43d | 1 | 1.15mi |
| 19264 Telegraph Rd Unit G2 Detroit, MI | 1.0 | 1.0 | 700 | $820 | $1.17 | 43d | 1 | 1.15mi |
| 19254 Telegraph Rd Unit M5 Detroit, MI | 1.0 | 1.0 | 700 | $820 | $1.17 | 14d | 1 | 1.15mi |
| 19276 Telegraph Rd Detroit, MI | 2.0 | 1.0 | 820 | $975 | $1.19 | 43d | 1 | 1.15mi |
| 19248 Telegraph Rd Unit P7 Detroit, MI | 2.0 | 1.0 | 820 | $975 | $1.19 | 24d | 1 | 1.16mi |
| 20524 Indian Redford, MI | 3.0 | 1.0 | 988 | $1,600 | $1.62 | 24d | 1 | 1.16mi |
| 24651 W McNichols Rd Detroit, MI | 1.0 | 1.0 | 700 | $800 | $1.14 | 43d | 4 | 1.16mi |
| 19260 Telegraph Rd Unit J2 Detroit, MI | 1.0 | 1.0 | 700 | $820 | $1.17 | 43d | 1 | 1.19mi |
| 20091 Inkster Rd Livonia, MI | 2.0 | 1.0 | 756 | $1,400 | $1.85 | 4d | 1 | 1.20mi |
| 25304 Shiawassee Cir #105 Southfield, MI | 1.0 | 1.0 | 700 | $1,050 | $1.50 | 43d | 1 | 1.22mi |
| 25740 Shiawassee St Southfield, MI | 1.0–2.0 | 1.0 | 850 | $1,253 | $1.47 | 43d | 10 | 1.27mi |
| 25340 Shiawassee Cir Unit 208 Southfield, MI | 1.0 | 1.0 | 575 | $1,050 | $1.83 | 17d | 1 | 1.28mi |
| 18405 Gillman St Livonia, MI | 3.0 | 2.0 | 1014 | $1,950 | $1.92 | 4d | 1 | 1.30mi |
| 25010 W 8 Mile Rd Southfield, MI | 1.0 | 1.0 | 820 | $1,110 | $1.35 | 1d | 2 | 1.31mi |
| 25400 Basin St Bldg 9 Southfield, MI | 1.0 | 1.0 | 750 | $1,175 | $1.57 | 43d | 1 | 1.32mi |
| 25400 Basin St Southfield, MI | 1.0–2.0 | 1.0 | 825 | $1,400 | $1.70 | 4d | 11 | 1.32mi |
| 19800 Telegraph Rd Detroit, MI | 2.0 | 1.0 | 855 | $1,020 | $1.19 | 43d | 1 | 1.32mi |
| 19255 Shiawassee Dr Apt 105 Detroit, MI | 1.0 | 1.0 | 680 | $950 | $1.40 | 4d | 1 | 1.34mi |
| 24235 W McNichols Rd Detroit, MI | 1.0 | 1.0 | 700 | $800 | $1.14 | 43d | 4 | 1.35mi |
| 19301 Shiawassee Dr Detroit, MI | 1.0–2.0 | 1.0 | 740 | $1,150 | $1.55 | 43d | 2 | 1.36mi |
| 16800 Wormer St Detroit, MI | 3.0 | 1.0 | 912 | $1,250 | $1.37 | 17d | 1 | 1.44mi |
| 16581 Wormer St Detroit, MI | 2.0 | 1.0 | 720 | $1,100 | $1.53 | 43d | 1 | 1.49mi |
Listing history 31 events
-
2026-06-18days on market $89,900 Active 34 DOM
-
2026-06-17days on market $89,900 Active 33 DOM
-
2026-06-16days on market $89,900 Active 32 DOM
-
2026-06-15days on market $89,900 Active 31 DOM
-
2026-06-13days on market $89,900 Active 29 DOM
-
2026-06-13days on market $89,900 Active 28 DOM
-
2026-06-09days on market $89,900 Active 25 DOM
-
2026-06-08days on market $89,900 Active 24 DOM
-
2026-06-07days on market $89,900 Active 23 DOM
-
2026-06-04days on market $89,900 Active 20 DOM
-
2026-06-03days on market $89,900 Active 19 DOM
-
2026-06-02days on market $89,900 Active 18 DOM
-
2026-06-01days on market $89,900 Active 17 DOM
-
2026-05-31days on market $89,900 Active 16 DOM
-
2026-05-15$89,900 Active 199-char remark
Show marketing remark (199 chars)
CLEAN 2 BEDROOM RANCH! MOVE IN READY! 2 CAR DETACHED GARAGE! CLOSE TO SHOPPING AND SCHOOLS! AS IS SALE! LAND CONTRACT TERMS AVAILABLE! ALL DATA IS APPROXIMATE. BUYERS AGENT TO VERIFY ALL INFORMATION.
-
2026-05-15$89,900 Active
Show marketing remark (199 chars)
CLEAN 2 BEDROOM RANCH! MOVE IN READY! 2 CAR DETACHED GARAGE! CLOSE TO SHOPPING AND SCHOOLS! AS IS SALE! LAND CONTRACT TERMS AVAILABLE! ALL DATA IS APPROXIMATE. BUYERS AGENT TO VERIFY ALL INFORMATION.
-
2026-05-01historical Accepting Backup Offers
-
2026-05-01historical Active Under Contract
-
2026-05-01historical
-
2026-05-01historical
-
2026-04-16$89,900 Active
-
2026-04-16$89,900 Active
-
2008-12-05soldstatus $5,900
-
2008-10-22$5,900
-
2008-09-29historical
-
2008-09-21historical
-
2007-09-17$49,900
-
2007-09-17$49,900
-
1997-08-05soldstatus $37,000
-
1993-08-27soldstatus $23,000
-
1991-09-13soldstatus $21,349
ⓘ Source: listings_history table (triggers on properties + properties_extension) + one-shot
backfill from property_details.listing_events for pre-trigger history.
Tax reassessment forecast MI · Partial reset (capped growth)
- Current annual tax
- $947 · $79/mo
- Projected year-2 tax
- $1,166 · $97/mo
- Expected delta
- +$219/yr (+$18/mo · 23.1%)
ⓘ Screening estimate from a state-policy table — verify with the county assessor before closing.
Climate risk First Street
- Flood 1/10 Low FEMA zone X (unshaded) · 0% chance over 30 yrs
- Wildfire 1/10 Low
- Heat 3/10 Moderate 7 d/yr ≥98°F today · 15 d/yr by 30 yrs out
- Wind 2/10 Low
- Air quality 3/10 Moderate 2 unhealthy d/yr today · 3 by 30 yrs out
Nearby sold comps map
Loading sold comps map…
Walkable amenities ~0.75 mi
Loading nearby amenities…
Taxation est. · year 1
- Rental income
- $14,230
- − Mortgage interest
- −$5,036
- − Property taxes
- −$947
- − Insurance
- −$450
- − Repairs & maintenance
- −$1,138
- − Management
- −$1,138
- − Depreciation
- −$2,615
- Taxable income
- $2,905
- Est. tax owed @ 24.0%
- −$697
- After-tax cash flow
- $3,490/yr
For passive investors: Depreciation is non-cash, so a rental often shows a tax loss while cash-flowing — sheltering income. Rental losses are passive: they offset passive income freely, and up to $25,000/yr can offset ordinary (W-2) income if you actively participate and your MAGI is under $100k (phasing out to $0 by $150k); unused losses carry forward. On sale, claimed depreciation is recaptured at up to 25%, and gains may owe capital-gains tax (a 1031 exchange can defer both). Figures are a year-1 estimate at your 24.0% rate — not tax advice; consult a CPA.
Schools (NCES district)
- District
- Redford Union Schools District No. 1
- NCES district ID
- 2629460
- Math proficiency
- 8% ▼ -6.00%
- Reading proficiency
- 23% ▬ 0.00%
- Median HH income
- $49,778
- Composite
- 14.1/100
- National rank
- #9460
- State rank
- #489 of 540 in MI
Livability — Redford
No livability data for this city. (Only ~50 U.S. cities are tracked.)
Census & demographics
- City population
- 36,976
- Population (ZIP)
- 17,097
Population outlook (Wayne County) Hauer SSP2
- Today (2025)
- 1,675,273 people
- By 2030
- 1,620,300 · -3.3%
- By 2040
- 1,502,341 · -10.3%
- By 2050
- 1,384,039 · -17.4%
- By 2075
- 1,124,592 · -32.9%
- By 2100
- 881,193 · -47.4%
Race, ethnicity, and origin ACS 2023
- Neighborhood character
- Diverse neighborhood (Simpson 0.64)
- Race & ethnicity
- White 45% Black 40% Two or more races 10% Hispanic / Latino 6%
- Hispanic origin (detail)
- Mexican 6%
- Common ancestry
- Romanian 5% Lithuanian 3% Slovak 2%
- Foreign-born
- 4% · Canada
- Languages at home
- 93% English-only · Spanish 5% Chinese 1%
Political lean MEDSL · Wayne
- 2024 margin
- Strong D (+29.0) · D 62.7% · R 33.7% · Other 3.6%
- 2008→2024 swing
- -20.5pp toward R · 2008: 49.5pp · 2024: 29.0pp
- All cycles
- 2024: D+29.0 2020: D+38.1 2016: D+37.3 2012: D+46.9 2008: D+49.5
Not yet ingested
- Civics
- —
Market trends
- HPI YoY
- ▼ -177.98%
- Current HPI
- 236.2958
- Rent YoY
- —
- Metro
- —
- State GDP YoY
- ▲ 1.37%
- F500 in state
- 28
Industry mix (Fortune 500 HQ in MI)
| Industry | F500 HQs | Revenue |
|---|---|---|
| Automotive Parts | 3 | $48B |
|
||
| Automotive | 2 | $372B |
|
||
| Chemicals | 1 | $45B |
|
||
| Automotive Retail | 1 | $29B |
|
||
| Healthcare / Medical Devices | 1 | $23B |
|
||
| Automotive Technology | 1 | $20B |
|
||
Price history
+321.1% since first listed17 events — show timeline
- 2026-05-15 Listed $89,900 REALCOMP
- 2026-05-15 Listed $89,900 MiRealSource-MiMLS
- 2026-05-01 Contingent — MiRealSource-MiMLS
- 2026-05-01 Contingent — REALCOMP
- 2026-05-01 Listing Removed — REALCOMP
- 2026-05-01 Listing Removed — MiRealSource-MiMLS
- 2026-04-16 Listed $89,900 REALCOMP
- 2026-04-16 Listed $89,900 MiRealSource-MiMLS
- 2008-12-05 Sold (MLS) $5,900 REALCOMP
- 2008-10-22 Listed $5,900 REALCOMP
- 2008-09-29 Listing Removed — MiRealSource-MiMLS
- 2008-09-21 Listing Removed — REALCOMP
- 2007-09-17 Listed $49,900 REALCOMP
- 2007-09-17 Listed $49,900 MiRealSource-MiMLS
- 1997-08-05 Sold (Public Records) $37,000 Public Records
- 1993-08-27 Sold (Public Records) $23,000 Public Records
- 1991-09-13 Sold (Public Records) $21,349 Public Records
Property tax history
-4.5%/yrLatest (2025): $947 · -48.9% YoY. Source: county tax records.
Cash-flow waterfall
monthlySold comps — $/sqft
last 12 mo · ≤1 miLoading sold comps…