10323 E Compadre Pl · Fortuna Foothills, AZ
Flood risk 1/10 · Minimal
- FEMA flood zone
- X (shaded)
- Chance of flooding over 30 yrs
- 0.0%
- Est. flood insurance / yr
- $507 – $1,088
Fire risk 4/10 · Minor
- Est. fire insurance / yr
- $610 – $1,132
Heat risk 9/10 · Severe
- Hot days now (above 114°F)
- 5 days/yr
- Hot days in 30 yrs
- 14 days/yr
Wind risk 1/10 · Minimal
- Chance of severe wind over 30 yrs
- —
Air-quality risk 2/10 · Minimal
- Unhealthy air days now
- 1 days/yr
- Unhealthy air days in 30 yrs
- 1 days/yr
Risk factors via First Street. Map © Google.
Why this score? — see what drove the B- grade
The composite is a weighted blend of 9 inputs, each scored 0–100. Each bar is that input's sub-score; the figure is the points it added to the 100-point composite (weight × sub-score).
- Cash flow +30.0/30.0
- 1% rule +10.0/10.0
- DSCR +10.0/10.0
- ARV discount +8.1/15.0
- Livability +3.0/5.0
- Condition / age +2.5/5.0
- Rent growth +2.4/5.0
- Schools +1.3/10.0
- Appreciation +0.0/10.0
$71,000
🖨 Deal sheet (PDF) 📄 Offer letter ✓ Due diligence
Listing remarks
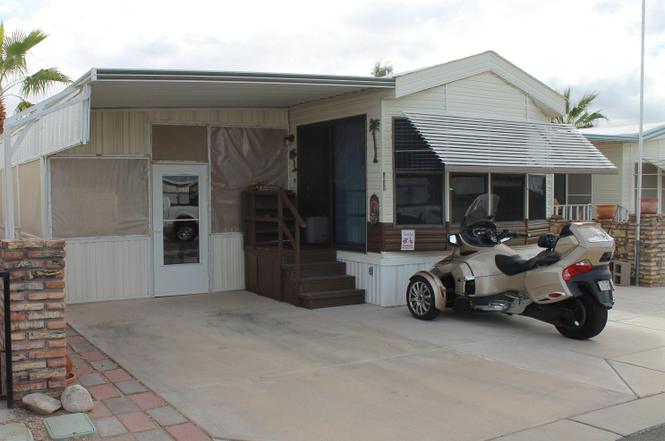
Beautifully maintained park model in Los Amigos 55+ neighborhood is waiting for a new owner. This beauty can be your new home or winter spot --- you can enjoy the Yuma winters inside the screened Arizona room or in the back next to the BBQ grill. All the furnishings are included so you just need to bring your favorite pictures to hang on the wall!
Key facts
- Bbq grill
- Furnishings included
- 1,980 sq ft lot
Tags
Property features AI
Finance
- Other: Paved road access; Lot approximately 1,980 square feet
- HOA & community: Homeowners association with a monthly fee of $54; Senior community
Exterior
- Parking: Attached carport; One covered parking space; One total parking space; Open parking available
- Security: Smoke detector(s)
- Utilities: Public water; Shared septic
- Home design: Manufactured home; Residential property
- Construction: Mobile home / manufactured construction
- Exterior features: Covered patio; Patio; Sliding doors; Workshop
Interior
- Kitchen: Refrigerator; Microwave; Electric range; Water purifier
- Flooring: Other
- Bathrooms: One three-quarter bathroom
- Heating & cooling: Heating; Cooling
- Interior features: Double-pane windows; Bay window; Blinds; Smoke detector(s); TV antenna
- Laundry & utility: Washer; Dryer
Neighborhood map
What this means for you Summary
Snapshot
- This is a 1-bed/1.0-bath manufactured listed at $71k.
Deal economics
- At list price, monthly cash flow is $665 ($8k/yr) — positive.
- The deal already cash-flows at list — no discount required.
- Meets the 1% rule at list price ($1k rent vs $71k).
- Recommended offer: $62k (12.0% below list) — sets the bar for market timing.
- Cap rate 17.5% vs local median 4.2% in Fortuna Foothills — top-decile yield for the area; either an underpriced asset or a hidden risk that comps aren't pricing in. Stress-test before assuming the spread holds.
Location & tenants
- Location reads 60/100 on livability (#174 in AZ) — a middle-class / working-renter tenant base. Strengths: cost of living A+, housing A+; Watch: employment C-, schools F, crime F.
- Yuma Union High School District (4507) (urban): math 14% / reading 16% proficiency, ranked #212 of 249 in AZ (top 85%) — low school quality limits family demand, transient renter base, plan for 1-2y turnover.
- Market conditions: Rents soft (-0.4%/yr); 468 active listings in the ZIP; 2 comparable units currently listed for rent nearby; 1,399 units permitted in Yuma County in 2024 (180 in 5+ unit buildings).
Forward outlook
- Local home prices are declining (-3.0%/yr); year-one equity from $491 of loan paydown is wiped out by about $2k of value loss. Plan a longer hold.
- Yuma County population projected at +4% by 2050 — modest demand growth; plan on rents tracking national, not racing it.
- At projected returns (-3.0% appreciation + 0.0% rent growth), your $20k cash investment doubles in ~4 years — after that, you're playing with house money.
Negotiation context
- It's been on market 222 days — a 12% lower offer ($62k) is reasonable based on typical stale-listing flexibility.
- 2 sale attempts with the ask held roughly flat each time — persistent listings suggest the price (not the market) is what's stuck; bring a comps-based counter.
- Current owner paid $31k; list at $71k implies a 129% gain — meaningful room to come down on a strong offer.
Risks & watch-outs
- Climate carrying-cost: extreme-heat days projected 5→14/yr by 2055 (HVAC capex compounding) — expect insurance premiums to compound above CPI over the hold.
Questions for the listing agent
- It's been on market 222 days. Have you received any prior offers? Is the seller open to a 12% concession, seller financing, or rate buy-down credit?
- What does the HOA fee cover, when was the last increase, and are there any pending special assessments or reserve-fund shortfalls?
- Why hasn't it sold? Are there any deal-killer items the seller is aware of (foundation, flood, title, zoning, code violations)?
- Is there a deadline driving the sale (1031 exchange, divorce, estate, relocation)? That informs how much negotiation room exists.
- Schools are F-rated, which usually means shorter tenancies and higher turnover. Who's the typical renter profile here, and what's been the actual vacancy rate?
- Crime grade is F in this area — have there been break-ins, vandalism, or insurance claims at this property in the last 3 years? What carrier currently insures it and at what premium?
- What's the average days-on-market for RENTAL listings here right now (not sales)? A rising rental-DOM trend means longer vacancies and softer asking-rent achievability than the comps imply.
- What's the recent tenant-quality profile in this submarket — average credit score on applications, eviction rate, late-payment / NSF rate, and stable-employment percentage? A property-management company in the area should have these aggregated.
- How much new for-sale + rental construction is in the pipeline within 1–3 miles? Heavy new supply typically softens prices + rents 12–24 months out; constrained supply supports both.
Investment metrics
- 1% rule
- 2.05% ✓
- Cap rate
- 17.53%
- Cash-on-cash
- 40.12%
- DSCR
- 2.79
- GRM
- 4.1
CMA / ARV
- ARV (on-the-fly)
- $71,958
- Comps found
- 12
Show comp detail 12 sales within ~0.75 mi
| Address | Dist | Beds/Ba | Sqft | Sold | Price | $/sf | Match |
|---|---|---|---|---|---|---|---|
| 10322 E 29 Pl | 0.04mi | 1/1.0 | 400 (-0%) | 0mo | $79,900 | $200 | 97 |
| 10331 E Compadre Ln | 0.12mi | 1/1.0 | 398 (-1%) | 1mo | $52,000 | $131 | 92 |
| 10328 E 29 Ln | 0.07mi | 1/1.0 | 402 (0%) | 10mo | $44,200 | $110 | 88 |
| 10313 E Compadre Pl | 0.01mi | 1/1.0 | 420 (+4%) | 9mo | $75,000 | $179 | 85 |
| 10309 E 30 St | 0.15mi | 1/1.0 | 396 (-2%) | 7mo | $55,000 | $139 | 84 |
| 10349 E 28 Ln | 0.04mi | 1/1.0 | 430 (+7%) | 3mo | $75,000 | $174 | 84 |
| 10337 E 29 Ln | 0.09mi | 1/1.0 | 419 (+4%) | 9mo | $65,000 | $155 | 81 |
| 10343 E 30 St | 0.15mi | 1/1.0 | 393 (-2%) | 10mo | $85,000 | $216 | 81 |
| 10209 S Spring Ave | 0.50mi | 1/1.0 | 401 (-0%) | 7mo | $158,000 | $394 | 70 |
| 10335 E 29 Pl | 0.06mi | 1/1.0 | 456 (+13%) | 7mo | $65,000 | $143 | 69 |
| 10207 S Avenida Compadres | 0.47mi | 2/1.0 (+1) | 404 (+0%) | 6mo | $115,000 | $285 | 67 |
| 10392 S Avenida Compadres | 0.26mi | 2/2.0 (+1) | 385 (-4%) | 10mo | $142,000 | $369 | 64 |
Match score weights: distance 35% · size 25% · config 20% · recency 20%. Top-matched comps best support the ARV.
Projected returns pro-forma
-3.0% appreciation · 0.0% rent growth · sell at horizon
- IRR
- 33.1%
- Equity multiple
- 2.34×
- Total profit
- $26,584
- Equity at exit
- $10,586
- IRR
- 38.4%
- Equity multiple
- 4.08×
- Total profit
- $61,261
- Equity at exit
- $6,139
Cash invested: $19,880 (down + closing). Projections, not guarantees.
Landlord ↔ Tenant lean methodology
- Overall (STATE)
- 87 Strongly Landlord-Friendly
- State Arizona
- 87 Strongly Landlord-Friendly · R+3
- County
- — inherits STATE
- City
- — inherits STATE
ZIP-level market 85365
- Home prices YoY
- -23.6%
- Rents YoY
- -0.4%
- Active inventory
- 468
- Price-to-rent
- 4.1×
Monthly cashflow live
- Estimated rent
- $1,454 medium interval (Pro) →
- Mortgage (P&I)
- −$372
- Tax from tax record
- −$28 /mo · $340/yr
- Insurance
- −$30
- HOA
- −$54
- Vacancy / Maint / Mgmt
- −$305
- Net cashflow
- $665
Break-even live
Sensitivity live
| Price | -10% $705 | -5% $685 | +0% $665 | +5% $645 | +10% $624 |
|---|---|---|---|---|---|
| Rent | -10% $550 | -5% $607 | +0% $665 | +5% $722 | +10% $780 |
| Rate | -1.0pp $700 | -0.5pp $683 | base $665 | +0.5pp $646 | +1.0pp $628 |
UW: 25.0% down · 7.5% · 30yr · 1.5% tax · 5.0% vac · 8.0% maint · 8.0% mgmt
Financing live
Cash to close
- Down payment
- $17,750
- Closing costs
- $2,130
- Reserves months
- —
- Total cash needed
- —
Loan-product check · same deal, 3 products live
Conventional
25% down · 7.5% · 30yr
- Down + closing
- —
- Monthly P&I
- —
- Monthly cashflow
- —
- DSCR
- —
- Eligible?
- —
Personal DTI + credit; lowest rate.
DSCR
20% down · 8.5% · 30yr
- Down + closing
- —
- Monthly P&I
- —
- Monthly cashflow
- —
- DSCR
- —
- Eligible?
- —
No personal income docs; deal must DSCR.
Hard money
10% down · 12.0% · 12mo
- Down + closing
- —
- Monthly P&I
- —
- Monthly cashflow
- —
- DSCR
- —
- Eligible?
- —
Short-term bridge; refi at stabilization.
Rent comps 2 comps
| Address | Beds | Baths | Sqft | Rent | $/sqft | DOM | Units | Dist |
|---|---|---|---|---|---|---|---|---|
| 10237 S Avenida Compadres Yuma, AZ | 1.0 | 1.0 | 200 | $1,600 | $8.00 | 22d | 1 | 0.45mi |
| 10237 S Avenida Compadres Unit 1/2 Yuma, AZ | 1.0 | 1.0 | 200 | $1,400 | $7.00 | 22d | 1 | 0.45mi |
HOA detail
- Monthly dues
- $54 · $648/yr
Listing history 23 events
-
2026-06-21days on market $71,000 Active 222 DOM
-
2026-06-19days on market $71,000 Active 220 DOM
-
2026-06-18days on market $71,000 Active 219 DOM
-
2026-06-17days on market $71,000 Active 218 DOM
-
2026-06-16days on market $71,000 Active 217 DOM
-
2026-06-15days on market $71,000 Active 216 DOM
-
2026-06-14days on market $71,000 Active 214 DOM
-
2026-06-13days on market $71,000 Active 213 DOM
-
2026-06-10days on market $71,000 Active 211 DOM
-
2026-06-09days on market $71,000 Active 210 DOM
-
2026-06-08days on market $71,000 Active 209 DOM
-
2026-06-07days on market $71,000 Active 208 DOM
-
2026-06-05days on market $71,000 Active 205 DOM
-
2026-06-02days on market $71,000 Active 203 DOM
-
2026-06-01days on market $71,000 Active 202 DOM
-
2026-05-31days on market $71,000 Active 201 DOM
-
2026-05-30days on market $71,000 Active 200 DOM
-
2026-05-18status Active
-
2026-05-14historical Active Under Contract
-
2026-01-23price $71,000
-
2025-11-11$73,000 Active
-
1997-02-14soldstatus $31,000
-
1994-11-28soldstatus $28,000
ⓘ Source: listings_history table (triggers on properties + properties_extension) + one-shot
backfill from property_details.listing_events for pre-trigger history.
Tax reassessment forecast AZ · Resets to sale price
- Current annual tax
- $340 · $28/mo
- Projected year-2 tax
- $469 · $39/mo
- Expected delta
- +$128/yr (+$11/mo · 37.7%)
ⓘ Screening estimate from a state-policy table — verify with the county assessor before closing.
Climate risk First Street
- Flood 1/10 Low FEMA zone X (shaded) · 0% chance over 30 yrs
- Wildfire 4/10 Moderate
- Heat 9/10 Extreme 5 d/yr ≥114°F today · 14 d/yr by 30 yrs out
- Wind 1/10 Low
- Air quality 2/10 Low 1 unhealthy d/yr today · 1 by 30 yrs out
Nearby sold comps map
Loading sold comps map…
Walkable amenities ~0.75 mi
Loading nearby amenities…
Taxation est. · year 1
- Rental income
- $17,452
- − Mortgage interest
- −$3,977
- − Property taxes
- −$340
- − Insurance
- −$355
- − Repairs & maintenance
- −$1,396
- − Management
- −$1,396
- − HOA
- −$648
- − Depreciation
- −$2,065
- Taxable income
- $7,274
- Est. tax owed @ 24.0%
- −$1,746
- After-tax cash flow
- $6,230/yr
For passive investors: Depreciation is non-cash, so a rental often shows a tax loss while cash-flowing — sheltering income. Rental losses are passive: they offset passive income freely, and up to $25,000/yr can offset ordinary (W-2) income if you actively participate and your MAGI is under $100k (phasing out to $0 by $150k); unused losses carry forward. On sale, claimed depreciation is recaptured at up to 25%, and gains may owe capital-gains tax (a 1031 exchange can defer both). Figures are a year-1 estimate at your 24.0% rate — not tax advice; consult a CPA.
Schools (NCES district)
- District
- Yuma Union High School District (4507)
- NCES district ID
- 0409630
- Math proficiency
- 14% ▼ -12.00%
- Reading proficiency
- 16% ▼ -10.00%
- Median HH income
- $40,512
- Composite
- 12.86/100
- National rank
- #9592
- State rank
- #212 of 249 in AZ
Livability — Fortuna Foothills
- Score
- 60/100
- State rank
- #174
- US rank
- #18663
Category grades
Schools grade is shown separately in the Schools card above.
Census & demographics
- Census place
- Fortuna Foothills, AZ
- County
- Yuma County · 149,809 people
- City population
- 21,356
- Metro
- Yuma, AZ
- Population (ZIP)
- 54,775
- Household income
- $70,331
- Rent vs Own
- Severe rent burden
- 766.0
Population outlook (Yuma County) Hauer SSP2
- Today (2025)
- 211,633 people
- By 2030
- 214,114 · +1.2%
- By 2040
- 217,856 · +2.9%
- By 2050
- 220,276 · +4.1%
- By 2075
- 222,359 · +5.1%
- By 2100
- 198,880 · -6.0%
Race, ethnicity, and origin ACS 2023
- Neighborhood character
- Diverse neighborhood (Simpson 0.58)
- Race & ethnicity
- Hispanic / Latino 47% White 44% Two or more races 23% Black 2% Asian 1% Native American 1%
- Hispanic origin (detail)
- Mexican 43%
- Common ancestry
- Lithuanian 2% Italian 1% Romanian 1%
- Foreign-born
- 17% · Canada
- Languages at home
- 62% English-only · Spanish 36% Tagalog/Filipino 1% Other Asian/Pacific 1%
Political lean MEDSL · Yuma
- 2024 margin
- Strong R (+20.4) · D 39.3% · R 59.8%
- 2008→2024 swing
- -6.6pp toward R · 2008: -13.8pp · 2024: -20.4pp
- All cycles
- 2024: R+20.4 2020: R+6.2 2016: R+5.5 2012: R+16.1 2008: R+13.8
Not yet ingested
- Civics
- —
Market trends
- HPI YoY
- ▼ -75.03%
- Current HPI
- 242.8651
- Rent YoY
- ▼ -0.38%
- Metro
- Yuma, AZ
- State GDP YoY
- ▲ 4.54%
- F500 in state
- 20
Industry mix (Fortune 500 HQ in AZ)
| Industry | F500 HQs | Revenue |
|---|---|---|
| Technology | 2 | $13B |
|
||
| Mining / Metals | 1 | $23B |
|
||
| Environmental Services | 1 | $16B |
|
||
| Metals / Steel | 1 | $14B |
|
||
| Technology Distribution | 1 | $9B |
|
||
| Homebuilding | 1 | $8B |
|
||
Price history
+153.6% since first listed6 events — show timeline
- 2026-05-18 Relisted — YAR
- 2026-05-14 Contingent — YAR
- 2026-01-23 Price Changed $71,000 YAR
- 2025-11-11 Listed $73,000 YAR
- 1997-02-14 Sold (Public Records) $31,000 Public Records
- 1994-11-28 Sold (Public Records) $28,000 Public Records
Property tax history
-2.6%/yrLatest (2025): $340 · +2.7% YoY. Source: county tax records.
Cash-flow waterfall
monthlySold comps — $/sqft
last 12 mo · ≤1 miLoading sold comps…