25 Opal Dr · Warwick, PA
Flood risk 1/10 · Minimal
- FEMA flood zone
- X (unshaded)
- Chance of flooding over 30 yrs
- 0.0%
- Est. flood insurance / yr
- $507 – $1,088
Fire risk 1/10 · Minimal
- Est. fire insurance / yr
- $511 – $949
Heat risk 5/10 · Moderate
- Hot days now (above 102°F)
- 7 days/yr
- Hot days in 30 yrs
- 15 days/yr
Wind risk 4/10 · Minor
- Chance of severe wind over 30 yrs
- 16.0%
Air-quality risk 4/10 · Minor
- Unhealthy air days now
- 5 days/yr
- Unhealthy air days in 30 yrs
- 7 days/yr
Risk factors via First Street. Map © Google.
Why this score? — see what drove the D grade
The composite is a weighted blend of 9 inputs, each scored 0–100. Each bar is that input's sub-score; the figure is the points it added to the 100-point composite (weight × sub-score).
- Cash flow +15.0/30.0
- ARV discount +7.5/15.0
- 1% rule +5.0/10.0
- DSCR +5.0/10.0
- Schools +4.4/10.0
- Rent growth +2.5/5.0
- Livability +2.5/5.0
- Condition / age +2.5/5.0
- Appreciation +0.0/10.0
$45,000
🖨 Deal sheet (PDF) 📄 Offer letter ✓ Due diligence
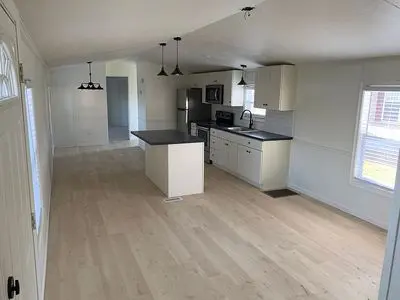
Listing remarks
Move-in ready 3-bedroom, 2 full bathroom mobile home for sale by owner in a clean, quiet community in Lititz, PA. This well-maintained home features new central air/AC, all appliances included, and an 8x10 shed for extra storage. Comfortable layout with spacious living areas and affordable lot rent at just $515/month. Conveniently located close to shopping, restaurants, and local amenities. Asking $45,000. Serious inquiries only.
Key facts
- 8x10 shed
- Conveniently located
- New central air
Tags
Neighborhood map
What this means for you Summary
Snapshot
- This is a 3-bed/1.0-bath manufactured listed at $45k.
Deal economics
- At list price, monthly cash flow is $1k ($17k/yr) — positive.
- The deal already cash-flows at list — no discount required.
- Meets the 1% rule at list price ($2k rent vs $45k).
- Recommended offer: $44k (1.5% below list) — sets the bar for market timing.
Location & tenants
- Location reads: area grade D — affects rentability + tenant quality, not the cash-flow math above.
- Warwick SD (suburban): math 42% / reading 58% proficiency, ranked #158 of 539 in PA (top 29%) — acceptable for families but not a draw, mixed tenant base, ~2y average lease; only 20% free/reduced lunch — higher-income household profile.
- Market conditions: 214 active listings in the ZIP; solid renter incomes; 1,093 units permitted in Lancaster County in 2024 (201 in 5+ unit buildings).
Forward outlook
- Local home prices are declining (-3.0%/yr); year-one equity from $311 of loan paydown is wiped out by about $1k of value loss. Plan a longer hold.
- Lancaster County population projected at +5% by 2050 — modest demand growth; plan on rents tracking national, not racing it.
- At projected returns (-3.0% appreciation + 3.0% rent growth), your $13k cash investment doubles in ~1 year — after that, you're playing with house money.
Negotiation context
- It's been on market 23 days — a 2% lower offer ($44k) is reasonable based on typical stale-listing flexibility.
Risks & watch-outs
- Climate carrying-cost: extreme-heat days projected 7→15/yr by 2055 (HVAC capex compounding) — expect insurance premiums to compound above CPI over the hold.
Questions for the listing agent
- Is there a deadline driving the sale (1031 exchange, divorce, estate, relocation)? That informs how much negotiation room exists.
- The area grade is low — what's the realistic commute time and amenity access for the typical tenant pool here? Any planned neighborhood developments (good or bad) we should know about?
- What's the average days-on-market for RENTAL listings here right now (not sales)? A rising rental-DOM trend means longer vacancies and softer asking-rent achievability than the comps imply.
- What's the recent tenant-quality profile in this submarket — average credit score on applications, eviction rate, late-payment / NSF rate, and stable-employment percentage? A property-management company in the area should have these aggregated.
- How much new for-sale + rental construction is in the pipeline within 1–3 miles? Heavy new supply typically softens prices + rents 12–24 months out; constrained supply supports both.
Investment metrics
- 1% rule
- 4.69% ✓
- Cap rate
- 43.52%
- Cash-on-cash
- 132.95%
- DSCR
- 6.92
- GRM
- 1.8
CMA / ARV
No comps found within radius.
Projected returns pro-forma
-3.0% appreciation · 3.0% rent growth · sell at horizon
- IRR
- —
- Equity multiple
- 7.48×
- Total profit
- $81,626
- Equity at exit
- $6,710
- IRR
- —
- Equity multiple
- 15.73×
- Total profit
- $185,596
- Equity at exit
- $3,891
Cash invested: $12,600 (down + closing). Projections, not guarantees.
Landlord ↔ Tenant lean methodology
- Overall (STATE)
- 62 Landlord-Friendly
- State Pennsylvania
- 62 Landlord-Friendly · EVEN
- County
- — inherits STATE
- City
- — inherits STATE
ZIP-level market 17543
- Active inventory
- 214
- Price-to-rent
- 1.8×
Monthly cashflow live
- Estimated rent
- $2,111 medium interval (Pro) →
- Mortgage (P&I)
- −$236
- Tax from tax record
- −$17 /mo · $201/yr
- Insurance
- −$19
- HOA
- −$0
- Vacancy / Maint / Mgmt
- −$443
- Net cashflow
- $1,396
Break-even live
Sensitivity live
| Price | -10% $1,421 | -5% $1,409 | +0% $1,396 | +5% $1,383 | +10% $1,371 |
|---|---|---|---|---|---|
| Rent | -10% $1,229 | -5% $1,313 | +0% $1,396 | +5% $1,479 | +10% $1,563 |
| Rate | -1.0pp $1,419 | -0.5pp $1,407 | base $1,396 | +0.5pp $1,384 | +1.0pp $1,372 |
UW: 25.0% down · 7.5% · 30yr · 1.5% tax · 5.0% vac · 8.0% maint · 8.0% mgmt
Financing live
Cash to close
- Down payment
- $11,250
- Closing costs
- $1,350
- Reserves months
- —
- Total cash needed
- —
Loan-product check · same deal, 3 products live
Conventional
25% down · 7.5% · 30yr
- Down + closing
- —
- Monthly P&I
- —
- Monthly cashflow
- —
- DSCR
- —
- Eligible?
- —
Personal DTI + credit; lowest rate.
DSCR
20% down · 8.5% · 30yr
- Down + closing
- —
- Monthly P&I
- —
- Monthly cashflow
- —
- DSCR
- —
- Eligible?
- —
No personal income docs; deal must DSCR.
Hard money
10% down · 12.0% · 12mo
- Down + closing
- —
- Monthly P&I
- —
- Monthly cashflow
- —
- DSCR
- —
- Eligible?
- —
Short-term bridge; refi at stabilization.
Listing history 16 events
-
2026-06-18days on market $45,000 Active 23 DOM
-
2026-06-17days on market $45,000 Active 22 DOM
-
2026-06-16days on market $45,000 Active 21 DOM
-
2026-06-15days on market $45,000 Active 20 DOM
-
2026-06-14days on market $45,000 Active 18 DOM
-
2026-06-10days on market $45,000 Active 15 DOM
-
2026-06-09days on market $45,000 Active 14 DOM
-
2026-06-08days on market $45,000 Active 13 DOM
-
2026-06-07days on market $45,000 Active 12 DOM
-
2026-06-05days on market $45,000 Active 9 DOM
-
2026-06-03days on market $45,000 Active 8 DOM
-
2026-06-02days on market $45,000 Active 7 DOM
-
2026-06-01days on market $45,000 Active 6 DOM
-
2026-05-31days on market $45,000 Active 5 DOM
-
2026-05-30days on market $45,000 Active 4 DOM
-
2026-05-27$45,000 Active
ⓘ Source: listings_history table (triggers on properties + properties_extension) + one-shot
backfill from property_details.listing_events for pre-trigger history.
Tax reassessment forecast PA · Partial reset (capped growth)
- Current annual tax
- $201 · $17/mo
- Projected year-2 tax
- $456 · $38/mo
- Expected delta
- +$255/yr (+$21/mo · 126.5%)
ⓘ Screening estimate from a state-policy table — verify with the county assessor before closing.
Climate risk First Street
- Flood 1/10 Low FEMA zone X (unshaded) · 0% chance over 30 yrs
- Wildfire 1/10 Low
- Heat 5/10 Major 7 d/yr ≥102°F today · 15 d/yr by 30 yrs out
- Wind 4/10 Moderate 16% chance of damaging wind over 30 yrs
- Air quality 4/10 Moderate 5 unhealthy d/yr today · 7 by 30 yrs out
Nearby sold comps map
Loading sold comps map…
Walkable amenities ~0.75 mi
Loading nearby amenities…
Taxation est. · year 1
- Rental income
- $25,329
- − Mortgage interest
- −$2,521
- − Property taxes
- −$201
- − Insurance
- −$225
- − Repairs & maintenance
- −$2,026
- − Management
- −$2,026
- − Depreciation
- −$1,309
- Taxable income
- $17,020
- Est. tax owed @ 24.0%
- −$4,085
- After-tax cash flow
- $12,667/yr
For passive investors: Depreciation is non-cash, so a rental often shows a tax loss while cash-flowing — sheltering income. Rental losses are passive: they offset passive income freely, and up to $25,000/yr can offset ordinary (W-2) income if you actively participate and your MAGI is under $100k (phasing out to $0 by $150k); unused losses carry forward. On sale, claimed depreciation is recaptured at up to 25%, and gains may owe capital-gains tax (a 1031 exchange can defer both). Figures are a year-1 estimate at your 24.0% rate — not tax advice; consult a CPA.
Schools (NCES district)
- District
- Warwick SD
- NCES district ID
- 4224960
- Math proficiency
- 42% ▼ -6.00%
- Reading proficiency
- 58% ▼ -11.00%
- Median HH income
- $63,696
- Composite
- 44.03/100
- National rank
- #2884
- State rank
- #158 of 539 in PA
Livability — Warwick
No livability data for this city. (Only ~50 U.S. cities are tracked.)
Census & demographics
- County
- Lancaster County · 390,309 people
- Metro
- Lancaster, PA
- Population (ZIP)
- 45,912
- Household income
- $97,435
- Rent vs Own
- Severe rent burden
- 1164.0
Population outlook (Lancaster County) Hauer SSP2
- Today (2025)
- 561,011 people
- By 2030
- 570,969 · +1.8%
- By 2040
- 585,929 · +4.4%
- By 2050
- 591,056 · +5.4%
- By 2075
- 594,747 · +6.0%
- By 2100
- 558,850 · -0.4%
Race, ethnicity, and origin ACS 2023
- Neighborhood character
- Predominantly White (86%)
- Race & ethnicity
- White 86% Hispanic / Latino 6% Two or more races 5% Asian 3% Black 2%
- Hispanic origin (detail)
- Mexican 1% Puerto Rican 3%
- Common ancestry
- Romanian 3% Lithuanian 2% Italian 2%
- Foreign-born
- 4% · Canada, India, Vietnam
- Languages at home
- 92% English-only · Spanish 3% German/W. Germanic 2% Other Indo-European 1%
Political lean MEDSL · Lancaster
- 2024 margin
- R (+15.9) · D 41.5% · R 57.5%
- 2008→2024 swing
- -4.1pp toward R · 2008: -11.8pp · 2024: -15.9pp
- All cycles
- 2024: R+15.9 2020: R+15.8 2016: R+19.7 2012: R+19.2 2008: R+11.8
Not yet ingested
- Civics
- —
Market trends
- HPI YoY
- ▼ -283.22%
- Current HPI
- 265.3653
- Rent YoY
- —
- Metro
- Lancaster, PA
- State GDP YoY
- ▲ 1.68%
- F500 in state
- 34
Industry mix (Fortune 500 HQ in PA)
| Industry | F500 HQs | Revenue |
|---|---|---|
| Healthcare | 2 | $309B |
|
||
| Insurance | 2 | $27B |
|
||
| Telecommunications / Media | 1 | $124B |
|
||
| Industrial Distribution | 1 | $22B |
|
||
| Financial Services | 1 | $20B |
|
||
| Chemicals / Materials | 1 | $18B |
|
||
Price history
1 event — show timeline
- 2026-05-27 Listed $45,000 FSBO.com
Property tax history
-6.0%/yrLatest (2026): $201 · +2.1% YoY. Source: county tax records.
Cash-flow waterfall
monthlySold comps — $/sqft
last 12 mo · ≤1 miLoading sold comps…