928 Kirkwood St · Wilmington, DE
Flood risk 1/10 · Minimal
- FEMA flood zone
- X (unshaded)
- Chance of flooding over 30 yrs
- 0.0%
- Est. flood insurance / yr
- $473 – $860
Fire risk 1/10 · Minimal
- Est. fire insurance / yr
- $476 – $884
Heat risk 8/10 · Major
- Hot days now (above 103°F)
- 7 days/yr
- Hot days in 30 yrs
- 16 days/yr
Wind risk 6/10 · Moderate
- Chance of severe wind over 30 yrs
- 27.0%
Air-quality risk 3/10 · Minor
- Unhealthy air days now
- 3 days/yr
- Unhealthy air days in 30 yrs
- 5 days/yr
Risk factors via First Street. Map © Google.
Why this score? — see what drove the C- grade
The composite is a weighted blend of 9 inputs, each scored 0–100. Each bar is that input's sub-score; the figure is the points it added to the 100-point composite (weight × sub-score).
- Cash flow +25.3/30.0
- DSCR +8.4/10.0
- 1% rule +5.5/10.0
- Livability +3.2/5.0
- Rent growth +2.9/5.0
- Schools +2.5/10.0
- Condition / age +2.5/5.0
- ARV discount +0.3/15.0
- Appreciation +0.0/10.0
$180,000
🖨 Deal sheet 📄 Offer letter ✓ Due diligence
Listing remarks
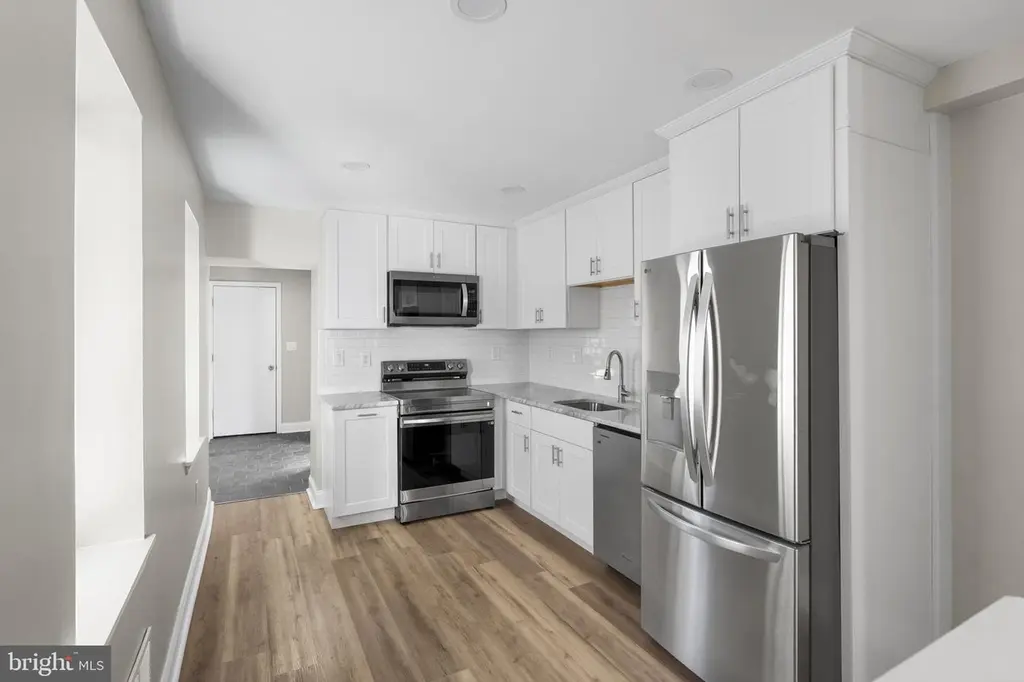
Beautiful, completely renovated 3BR/1.5BA Brick Rowhome featuring modern bathrooms, updated flooring on the main level, recessed lighting, and ceiling fans. First floor laundry room with brand new washer and dryer. Kitchen includes stainless steel appliances, granite countertops, French door refrigerator, dishwasher, and ample cabinet space. Central air. Concrete fenced in backyard. Ideally located close to major highways and downtown Wilmington, this home is a must see. May qualify for an additional grant from The City of Wilmington to be used toward closing costs; please verify with your local lender. WELCOME HOME!!!
Key facts
- Ceiling fans
- Updated flooring
- Recessed lighting
Tags
Property features AI
Exterior
- Parking: On-street parking
- Utilities: Public water; Public sewer; Electric service
- Home design: Interior townhouse/rowhouse; Estimated year built with major remodel in 2024
- Construction: Brick construction; Concrete perimeter foundation; Unfinished basement
- Exterior features: Not in a federal flood zone; Ground rent paid annually
Interior
- Bedrooms: 3 bedrooms on the first upper level
- Flooring: Carpet; Luxury vinyl plank; Tile/brick
- Bathrooms: 1 full bathroom (all upper levels); 1 half bathroom on main level
- Heating & cooling: 90% efficiency forced air heating (natural gas); Central air conditioning (electric); Electric hot water
- Interior features: Open floor plan; Upgraded countertops; Ceiling fans
- Laundry & utility: Washer and dryer in unit (main floor)
Neighborhood map
What this means for you Summary
Snapshot
- This is a 3-bed/1.0-bath townhouse listed at $180k.
Deal economics
- At list price, monthly cash flow is $411 ($5k/yr) — positive.
- The deal already cash-flows at list — no discount required.
- Meets the 1% rule at list price ($2k rent vs $180k).
- Recommended offer: $177k (1.5% below list) — sets the bar for market timing.
- Cap rate 9.0% vs local median 5.6% in Wilmington — top-decile yield for the area; either an underpriced asset or a hidden risk that comps aren't pricing in. Stress-test before assuming the spread holds.
Location & tenants
- Location reads 64/100 on livability (#52 in DE) — a middle-class / working-renter tenant base. Strengths: cost of living A+, housing A; Watch: employment D+, schools D, commute D.
- Christina School District (suburban): math 22% / reading 33% proficiency, ranked #18 of 26 in DE (top 69%) — low school quality limits family demand, transient renter base, plan for 1-2y turnover.
- Market conditions: Rents rising (+1.6%/yr); 75 active listings in the ZIP; 40 comparable units currently listed for rent nearby; rentals at typical pace (median 19d on market — plan ~3-4 weeks tenant-placement turnaround); 1,367 units permitted in New Castle County in 2024 (201 in 5+ unit buildings).
- This rent runs 43% of the median local income ($53k/yr) — at the standard rent-burdened threshold; future hikes will face affordability resistance.
Forward outlook
- Local home prices are declining (-3.0%/yr); year-one equity from $1k of loan paydown is wiped out by about $5k of value loss. Plan a longer hold.
- New Castle County population projected at +9% by 2050 — modest demand growth; plan on rents tracking national, not racing it.
Negotiation context
- It's been on market 15 days — a 2% lower offer ($177k) is reasonable based on typical stale-listing flexibility.
- 6 sale attempts since 33y ago with the ask held roughly flat each time — persistent listings suggest the price (not the market) is what's stuck; bring a comps-based counter.
- Current owner paid $10k; list at $180k implies a 1795% gain — meaningful room to come down on a strong offer.
Risks & watch-outs
- Watch-outs: built in 1890 — expect roof / HVAC / electrical / plumbing capex.
- Climate carrying-cost: major wind risk, 27% chance of damaging wind over 30y; extreme-heat days projected 7→16/yr by 2055 (HVAC capex compounding) — expect insurance premiums to compound above CPI over the hold.
Questions for the listing agent
- Built in 1890 — when were the roof, HVAC, electrical panel, plumbing, and water heater last replaced?
- Is there a deadline driving the sale (1031 exchange, divorce, estate, relocation)? That informs how much negotiation room exists.
- Schools are D-rated, which usually means shorter tenancies and higher turnover. Who's the typical renter profile here, and what's been the actual vacancy rate?
- Crime grade is F in this area — have there been break-ins, vandalism, or insurance claims at this property in the last 3 years? What carrier currently insures it and at what premium?
- What's the average days-on-market for RENTAL listings here right now (not sales)? A rising rental-DOM trend means longer vacancies and softer asking-rent achievability than the comps imply.
- What's the recent tenant-quality profile in this submarket — average credit score on applications, eviction rate, late-payment / NSF rate, and stable-employment percentage? A property-management company in the area should have these aggregated.
- How much new for-sale + rental construction is in the pipeline within 1–3 miles? Heavy new supply typically softens prices + rents 12–24 months out; constrained supply supports both.
Investment metrics
- 1% rule
- 1.05% ✓
- Cap rate
- 9.03%
- Cash-on-cash
- 9.78%
- DSCR
- 1.44
- GRM
- 7.9
CMA / ARV
- ARV (on-the-fly)
- $155,250
- Comps found
- 12
Show comp detail 12 sales within ~0.75 mi
| Address | Dist | Beds/Ba | Sqft | Sold | Price | $/sf | Match |
|---|---|---|---|---|---|---|---|
| 834 N Pine St | 0.08mi | 3/1.5 | 1,150 (0%) | 0mo | $150,000 | $130 | 94 |
| 524 Taylor St | 0.12mi | 2/1.0 (-1) | 1,125 (-2%) | 1mo | $110,000 | $98 | 85 |
| 1004 N Pine | 0.06mi | 3/1.5 | 1,100 (-4%) | 4mo | $170,000 | $155 | 85 |
| 1007 N Spruce St | 0.06mi | 3/1.5 | 1,075 (-6%) | 3mo | $145,000 | $135 | 82 |
| 1029 Clifford Brown Walk | 0.20mi | 4/1.5 (+1) | 1,175 (+2%) | 2mo | $30,000 | $26 | 79 |
| 932 Clifford Brown Walk | 0.17mi | 3/1.5 | 1,225 (+6%) | 2mo | $175,000 | $143 | 78 |
| 1124 Clifford Brown Walk | 0.22mi | 3/1.0 | 1,236 (+8%) | 4mo | $125,000 | $101 | 74 |
| 2203 N Pine St | 0.61mi | 3/1.5 | 1,200 (+4%) | 3mo | $188,000 | $157 | 60 |
| 2230 Lamotte St | 0.69mi | 3/1.5 | 1,125 (-2%) | 3mo | $135,000 | $120 | 60 |
| 2111 N Locust St | 0.56mi | 3/1.5 | 1,075 (-6%) | 3mo | $175,600 | $163 | 59 |
| 1212 N Tatnall St | 0.57mi | 3/1.0 | 1,275 (+11%) | 0mo | $165,000 | $129 | 55 |
| 1224 Tatnall St | 0.58mi | 2/1.0 (-1) | 1,275 (+11%) | 3mo | $252,500 | $198 | 47 |
Match score weights: distance 35% · size 25% · config 20% · recency 20%. Top-matched comps best support the ARV.
Projected returns pro-forma
-3.0% appreciation · 1.59% rent growth · sell at horizon
- IRR
- -3.1%
- Equity multiple
- 0.89×
- Total profit
- $-5,708
- Equity at exit
- $26,839
- IRR
- 5.1%
- Equity multiple
- 1.36×
- Total profit
- $17,901
- Equity at exit
- $15,563
Cash invested: $50,400 (down + closing). Projections, not guarantees.
Landlord ↔ Tenant lean methodology
- Overall (STATE)
- 70 Landlord-Friendly
- State Delaware
- 70 Landlord-Friendly · D+7
- County
- — inherits STATE
- City
- — inherits STATE
ZIP-level market 19801
- Rents YoY
- 1.6%
- Active inventory
- 75
- Price-to-rent
- 7.9×
Monthly cashflow live
- Estimated rent
- $1,889 high interval (Pro) →
- Mortgage (P&I)
- −$944
- Tax from tax record
- −$62 /mo · $748/yr
- Insurance
- −$75
- HOA
- −$0
- Vacancy / Maint / Mgmt
- −$397
- Net cashflow
- $411
Break-even live
Sensitivity live
| Price | -10% $513 | -5% $462 | +0% $411 | +5% $360 | +10% $309 |
|---|---|---|---|---|---|
| Rent | -10% $262 | -5% $336 | +0% $411 | +5% $486 | +10% $560 |
| Rate | -1.0pp $502 | -0.5pp $457 | base $411 | +0.5pp $364 | +1.0pp $317 |
UW: 25.0% down · 7.5% · 30yr · 1.5% tax · 5.0% vac · 8.0% maint · 8.0% mgmt
Financing live
Cash to close
- Down payment
- $45,000
- Closing costs
- $5,400
- Reserves months
- —
- Total cash needed
- —
Loan-product check · same deal, 3 products live
Conventional
25% down · 7.5% · 30yr
- Down + closing
- —
- Monthly P&I
- —
- Monthly cashflow
- —
- DSCR
- —
- Eligible?
- —
Personal DTI + credit; lowest rate.
DSCR
20% down · 8.5% · 30yr
- Down + closing
- —
- Monthly P&I
- —
- Monthly cashflow
- —
- DSCR
- —
- Eligible?
- —
No personal income docs; deal must DSCR.
Hard money
10% down · 12.0% · 12mo
- Down + closing
- —
- Monthly P&I
- —
- Monthly cashflow
- —
- DSCR
- —
- Eligible?
- —
Short-term bridge; refi at stabilization.
Rent comps 40 comps
| Address | Beds | Baths | Sqft | Rent | $/sqft | DOM | Units | Dist |
|---|---|---|---|---|---|---|---|---|
| 928 Kirkwood St Wilmington, DE | 3.0 | 1.5 | 1150 | $1,700 | $1.48 | 18d | 1 | 0.03mi |
| 835 N Spruce St Wilmington, DE | 3.0 | 1.0 | 775 | $1,700 | $2.19 | 1d | 1 | 0.06mi |
| 1004 N Spruce St Wilmington, DE | 3.0 | 1.5 | 1075 | $1,800 | $1.67 | 19d | 1 | 0.07mi |
| 605 E 10th St Wilmington, DE | 3.0 | 1.0 | 1200 | $1,850 | $1.54 | 24d | 1 | 0.08mi |
| 1026 Bennett St Wilmington, DE | 3.0 | 1.0 | 1125 | $1,685 | $1.50 | 1d | 1 | 0.10mi |
| 518 E 12th St Wilmington, DE | 2.0 | 1.0 | 875 | $1,425 | $1.63 | 21d | 1 | 0.20mi |
| 1124 Clifford Brown Walk Wilmington, DE | 2.0 | 1.0 | 1240 | $1,625 | $1.31 | 44d | 1 | 0.24mi |
| 913 N Market St Wilmington, DE | 1.0–2.0 | 1.0–2.0 | 974 | $1,985 | $2.04 | 44d | 5 | 0.45mi |
| 1217 N King St Wilmington, DE | 3.0 | 1.5 | 1300 | $2,145 | $1.65 | 19d | 1 | 0.46mi |
| 801 N Market St Unit 207 Wilmington, DE | 2.0 | 2.0 | 1239 | $1,895 | $1.53 | 5d | 1 | 0.47mi |
| 918 E 17th St Unit 1 Wilmington, DE | 3.0 | 1.0 | 1100 | $1,795 | $1.63 | 1d | 1 | 0.48mi |
| 116 W 9th St Wilmington, DE | 1.0–2.0 | 1.0–2.0 | 813 | $2,250 | $2.77 | 2d | 16 | 0.50mi |
| 1001 N Orange St Wilmington, DE | 1.0–2.0 | 1.0–2.0 | 833 | $2,135 | $2.56 | 1d | 62 | 0.52mi |
| 801 N Orange St Wilmington, DE | 3.0 | 1.0–3.0 | 1118 | $3,991 | $3.57 | 3d | 117 | 0.54mi |
| 703 Orange St Wilmington, DE | 1.0–2.0 | 1.0 | 800 | $1,475 | $1.84 | 44d | 1 | 0.54mi |
| 228 W 9th St Unit 201 Wilmington, DE | 2.0 | 2.0 | 1031 | $1,695 | $1.64 | 44d | 1 | 0.56mi |
| 15 W Girard St Unit 105 Wilmington, DE | 2.0 | 1.0 | 740 | $1,645 | $2.22 | 5d | 1 | 0.56mi |
| 839 N Tatnall St Unit 101 Wilmington, DE | 2.0 | 2.0 | 1211 | $1,750 | $1.45 | 5d | 1 | 0.58mi |
| 839 N Tatnall St Unit 303 Wilmington, DE | 2.0 | 2.0 | 876 | $1,475 | $1.68 | 5d | 1 | 0.58mi |
| 107 W 13th St Wilmington, DE | 3.0 | 1.5 | 1325 | $1,895 | $1.43 | 44d | 1 | 0.59mi |
| 225 W 4th St Unit 2 Wilmington, DE | 2.0 | 1.0 | 1000 | $1,599 | $1.60 | 44d | 1 | 0.65mi |
| 401 A St Wilmington, DE | 2.0 | 1.0–2.0 | 716 | $2,605 | $3.64 | 1d | 13 | 0.76mi |
| 103 E 24th St Unit 1 Wilmington, DE | 3.0 | 1.0 | 1025 | $1,795 | $1.75 | 44d | 1 | 0.79mi |
| 711 Windsor St Wilmington, DE | 2.0 | 1.0 | 980 | $1,460 | $1.49 | 44d | 1 | 0.79mi |
| 507 W 4th St Wilmington, DE | 3.0 | 1.5 | 1075 | $1,800 | $1.67 | 13d | 1 | 0.79mi |
| 709 Windsor St Unit 3 Wilmington, DE | 2.0 | 1.0 | 980 | $1,500 | $1.53 | 44d | 1 | 0.79mi |
| 613 W 10th St Wilmington, DE | 2.0 | 1.0 | 1100 | $1,745 | $1.59 | 44d | 1 | 0.80mi |
| 115 Christina Landing Dr Wilmington, DE | 1.0–2.0 | 1.0–2.0 | 1195 | $2,796 | $2.34 | 1d | 13 | 0.81mi |
| 617 W 6th St Unit 617 B Wilmington, DE | 3.0 | 1.0 | 1000 | $1,600 | $1.60 | 5d | 1 | 0.81mi |
| 5 E 24th St Unit 1 Wilmington, DE | 3.0 | 1.0 | 1150 | $1,795 | $1.56 | 44d | 1 | 0.82mi |
| 105 Christina Landing Dr Wilmington, DE | 2.0 | 2.0 | 1025 | $2,400 | $2.34 | 10d | 1 | 0.85mi |
| 105 Christina Landing Dr #1503 Wilmington, DE | 2.0 | 2.0 | 1025 | $2,500 | $2.44 | 17d | 1 | 0.85mi |
| 2601 N Heald St Wilmington, DE | 3.0 | 1.0 | 1025 | $1,795 | $1.75 | 1d | 1 | 0.86mi |
| 105 Christina Landing Dr #1105 Wilmington, DE | 2.0 | 2.0 | 1150 | $2,500 | $2.17 | 44d | 1 | 0.86mi |
| 1010 Trenton Pl Wilmington, DE | 3.0 | 1.5 | 1475 | $2,350 | $1.59 | 17d | 1 | 0.90mi |
| 2705 Speakman Pl Wilmington, DE | 3.0 | 1.5 | 1100 | $1,975 | $1.80 | 13d | 1 | 0.91mi |
| 820 W 7th St Wilmington, DE | 3.0 | 1.0 | 1000 | $1,650 | $1.65 | 44d | 1 | 0.93mi |
| 306 Concord Ave Unit 2 Wilmington, DE | 3.0 | 1.0 | 1100 | $1,350 | $1.23 | 44d | 1 | 0.98mi |
| 302 W 23rd St Unit 1 Wilmington, DE | 2.0 | 1.0 | 1450 | $1,295 | $0.89 | 24d | 1 | 0.99mi |
| 306 W 23rd St Unit 1 Wilmington, DE | 2.0 | 1.0 | 1475 | $1,295 | $0.88 | 24d | 1 | 1.00mi |
Listing history 11 events
-
2026-06-18days on market $180,000 Active 15 DOM
-
2026-06-17days on market $180,000 Active 14 DOM
-
2026-06-16days on market $180,000 Active 13 DOM
-
2026-06-15days on market $180,000 Active 12 DOM
-
2026-06-13days on market $180,000 Active 10 DOM
-
2026-06-13days on market $180,000 Active 9 DOM
-
2026-06-09days on market $180,000 Active 6 DOM
-
2026-06-08days on market $180,000 Active 5 DOM
-
2026-06-07days on market $180,000 Active 4 DOM
-
2026-06-04remarks 626-char remark
-
2026-06-04$180,000 Active 1 DOM
ⓘ Source: listings_history table (triggers on properties + properties_extension) + one-shot
backfill from property_details.listing_events for pre-trigger history.
Tax reassessment forecast DE · Partial reset (capped growth)
- Current annual tax
- $748 · $62/mo
- Projected year-2 tax
- $896 · $75/mo
- Expected delta
- +$148/yr (+$12/mo · 19.8%)
ⓘ Screening estimate from a state-policy table — verify with the county assessor before closing.
Climate risk First Street
- Flood 1/10 Low FEMA zone X (unshaded) · 0% chance over 30 yrs
- Wildfire 1/10 Low
- Heat 8/10 Severe 7 d/yr ≥103°F today · 16 d/yr by 30 yrs out
- Wind 6/10 Major 27% chance of damaging wind over 30 yrs
- Air quality 3/10 Moderate 3 unhealthy d/yr today · 5 by 30 yrs out
Nearby sold comps map
Loading sold comps map…
Walkable amenities ~0.75 mi
Loading nearby amenities…
Taxation est. · year 1
- Rental income
- $22,667
- − Mortgage interest
- −$10,083
- − Property taxes
- −$748
- − Insurance
- −$900
- − Repairs & maintenance
- −$1,813
- − Management
- −$1,813
- − Depreciation
- −$5,236
- Taxable income
- $2,073
- Est. tax owed @ 24.0%
- −$498
- After-tax cash flow
- $4,434/yr
For passive investors: Depreciation is non-cash, so a rental often shows a tax loss while cash-flowing — sheltering income. Rental losses are passive: they offset passive income freely, and up to $25,000/yr can offset ordinary (W-2) income if you actively participate and your MAGI is under $100k (phasing out to $0 by $150k); unused losses carry forward. On sale, claimed depreciation is recaptured at up to 25%, and gains may owe capital-gains tax (a 1031 exchange can defer both). Figures are a year-1 estimate at your 24.0% rate — not tax advice; consult a CPA.
Schools (NCES district)
- District
- Christina School District
- NCES district ID
- 1000200
- Math proficiency
- 22% ▼ -12.00%
- Reading proficiency
- 33% ▼ -5.00%
- Median HH income
- $58,838
- Composite
- 24.93/100
- National rank
- #7567
- State rank
- #18 of 26 in DE
Livability — Wilmington
- Score
- 64/100
- State rank
- #52
- US rank
- #14251
Category grades
Schools grade is shown separately in the Schools card above.
Census & demographics
- Census place
- Wilmington, DE
- County
- New Castle County · 483,412 people
- City population
- 173,480
- Metro
- Philadelphia-Camden-Wilmington, PA-NJ-DE-MD
- Population (ZIP)
- 16,327
- Household income
- $52,810
- Rent vs Own
- Severe rent burden
- 919.0
Population outlook (New Castle County) Hauer SSP2
- Today (2025)
- 594,686 people
- By 2030
- 609,164 · +2.4%
- By 2040
- 632,154 · +6.3%
- By 2050
- 649,068 · +9.1%
- By 2075
- 687,771 · +15.7%
- By 2100
- 694,961 · +16.9%
Race, ethnicity, and origin ACS 2023
- Neighborhood character
- Predominantly Black (67%)
- Race & ethnicity
- Black 67% White 15% Hispanic / Latino 9% Two or more races 7% Asian 4%
- Hispanic origin (detail)
- Mexican 3% Puerto Rican 4%
- Common ancestry
- Romanian 1% Slovak 1% Italian 1%
- Foreign-born
- 9% · Canada, China, Vietnam
- Languages at home
- 87% English-only · Spanish 7% Other Indo-European 2% Chinese 1%
Political lean MEDSL · New Castle
- 2024 margin
- Solid D (+32.6) · D 65.5% · R 32.9% · Other 1.6%
- 2008→2024 swing
- -8.1pp toward R · 2008: 40.6pp · 2024: 32.6pp
- All cycles
- 2024: D+32.6 2020: D+37.1 2016: D+29.6 2012: D+34.1 2008: D+40.6
Not yet ingested
- Civics
- —
Market trends
- HPI YoY
- ▼ -112.65%
- Current HPI
- 151.1288
- Rent YoY
- ▲ 1.59%
- Metro
- Philadelphia-Camden-Wilmington, PA-NJ-DE-MD
- State GDP YoY
- —
- F500 in state
- 0
Price history
+1794.7% since first listed13 events — show timeline
- 2026-06-03 Listed $180,000 BRIGHT MLS
- 2026-04-09 Listed for Rent $1,700 BRIGHTMLS
- 2026-01-17 Listing Removed — BRIGHT MLS
- 2026-01-14 Price Changed $185,000 BRIGHT MLS
- 2025-11-04 Listed $199,999 BRIGHT MLS
- 2025-09-30 Listing Removed — BRIGHT MLS
- 2025-08-02 Listed $210,000 BRIGHT MLS
- 2025-07-31 Listing Removed — BRIGHT MLS
- 2025-04-30 Listed $210,000 BRIGHT MLS
- 2025-03-28 Coming Soon — BRIGHT MLS
- 1995-09-30 Listing Removed — BRIGHT MLS
- 1993-07-21 Listed $29,900 BRIGHT MLS
- 1984-12-01 Sold (Public Records) $9,500 Public Records
Property tax history
+3.9%/yrLatest (2024): $748 · +2.6% YoY. Source: county tax records.
Cash-flow waterfall
monthlySold comps — $/sqft
last 12 mo · ≤1 miLoading sold comps…