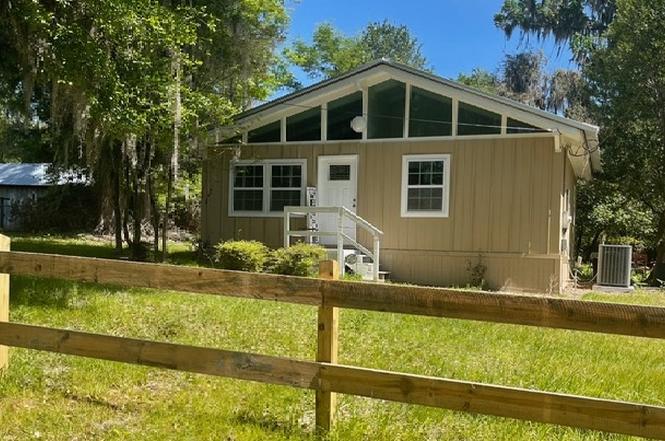
741 SE Eloise Ave · Watertown, FL
Flood risk 1/10 · Minimal
- FEMA flood zone
- X (unshaded)
- Chance of flooding over 30 yrs
- 0.0%
- Est. flood insurance / yr
- $507 – $1,088
Fire risk 7/10 · Major
- Est. fire insurance / yr
- $947 – $1,759
Heat risk 8/10 · Major
- Hot days now (above 107°F)
- 7 days/yr
- Hot days in 30 yrs
- 20 days/yr
Wind risk 9/10 · Severe
- Chance of severe wind over 30 yrs
- 99.0%
Air-quality risk 5/10 · Moderate
- Unhealthy air days now
- 9 days/yr
- Unhealthy air days in 30 yrs
- 10 days/yr
Risk factors via First Street. Map © Google.
Why this score? — see what drove the C- grade
The composite is a weighted blend of 9 inputs, each scored 0–100. Each bar is that input's sub-score; the figure is the points it added to the 100-point composite (weight × sub-score).
- Cash flow +13.6/30.0
- ARV discount +10.7/15.0
- Appreciation +10.0/10.0
- Schools +4.5/10.0
- DSCR +4.1/10.0
- 1% rule +3.4/10.0
- Livability +3.0/5.0
- Rent growth +2.5/5.0
- Condition / age +2.5/5.0
$189,000
🖨 Deal sheet 📄 Offer letter ✓ Due diligence
Listing remarks MLS
Completely remodeled with all new appliances, flooring, roof and AC. Cozy 2/1 in quiet neighborhood
Key facts
- Newer ac
- Newer flooring
- Completely remodeled
Tags
Property features AI
Finance
- Other: Zoning: RSF-2; Lot approximately 0.464 acre (dimensions: 152 x 136 x 150 x 163)
Exterior
- Parking: Attached or detached 2-car garage
- Utilities: Cable available
- Home design: Single-story residential property
- Construction: Metal roof
- Exterior features: Wood fencing; Irregular lot shape
Interior
- Kitchen: Dishwasher; Electric cooktop; Refrigerator; Microwave
- Bathrooms: 1 full bathroom
- Interior features: Ceiling fans; Central air conditioning; Central electric heating
Neighborhood map
What this means for you Summary
Snapshot
- This is a 2-bed/1.0-bath single-family listed at $189k.
Deal economics
- At list price, monthly cash flow is $9 ($110/yr) — positive.
- The deal already cash-flows at list — no discount required.
- To meet the 1% rule (rent ≥ 1% of price), the offer needs to be $158k (16.3% below list).
- Recommended offer: $158k (16.3% below list) — sets the bar for 1% rule.
Location & tenants
- Location reads 60/100 on livability (#798 in FL) — a middle-class / working-renter tenant base. Strengths: crime A+, cost of living A+, housing A-; Watch: schools F, amenities F, commute F.
- Columbia (town): math 53% / reading 54% proficiency, ranked #25 of 73 in FL (top 34%) — acceptable for families but not a draw, mixed tenant base, ~2y average lease.
- Market conditions: 143 active listings in the ZIP; 178 units permitted in Columbia County in 2024 (0 in 5+ unit buildings).
- This rent runs 35% of the median local income ($55k/yr) — at the standard rent-burdened threshold; future hikes will face affordability resistance.
Forward outlook
- In year one you build about $20k of equity ($1k loan paydown + $19k appreciation (10.0% local appreciation)).
- Columbia County population projected to shrink 7% by 2050 — rents likely to lag national; underwrite the cash flow, not the appreciation.
- At projected returns (10.0% appreciation + 3.0% rent growth), your $53k cash investment doubles in ~3 years — after that, you're playing with house money.
- By year 2, paydown + projected appreciation supports a ~$32k cash-out refi (75% LTV) — recoverable capital for the next deal without selling this one.
Negotiation context
- It's been on market 323 days — a 12% lower offer ($166k) is reasonable based on typical stale-listing flexibility.
- 6 sale attempts since 10y ago; this cycle's ask has dropped $11k (5%) from the opening price — seller is motivated, your offer sets the floor, not the list.
Risks & watch-outs
- Climate carrying-cost: severe wind risk, 99% chance of damaging wind over 30y; major wildfire risk; extreme-heat days projected 7→20/yr by 2055 (HVAC capex compounding) — expect insurance premiums to compound above CPI over the hold.
Questions for the listing agent
- It's been on market 323 days. Have you received any prior offers? Is the seller open to a 16% concession, seller financing, or rate buy-down credit?
- Built in 1968 — when were the roof, HVAC, electrical panel, plumbing, and water heater last replaced?
- Why hasn't it sold? Are there any deal-killer items the seller is aware of (foundation, flood, title, zoning, code violations)?
- Is there a deadline driving the sale (1031 exchange, divorce, estate, relocation)? That informs how much negotiation room exists.
- Schools are F-rated, which usually means shorter tenancies and higher turnover. Who's the typical renter profile here, and what's been the actual vacancy rate?
- What's the average days-on-market for RENTAL listings here right now (not sales)? A rising rental-DOM trend means longer vacancies and softer asking-rent achievability than the comps imply.
- What's the recent tenant-quality profile in this submarket — average credit score on applications, eviction rate, late-payment / NSF rate, and stable-employment percentage? A property-management company in the area should have these aggregated.
- How much new for-sale + rental construction is in the pipeline within 1–3 miles? Heavy new supply typically softens prices + rents 12–24 months out; constrained supply supports both.
Investment metrics
- 1% rule
- 0.84% ✗
- Cap rate
- 6.35%
- Cash-on-cash
- 0.21%
- DSCR
- 1.01
- GRM
- 10.0
CMA / ARV
- ARV (on-the-fly)
- $203,616
- Comps found
- 12
Show comp detail 12 sales within ~0.75 mi
| Address | Dist | Beds/Ba | Sqft | Sold | Price | $/sf | Match |
|---|---|---|---|---|---|---|---|
| 492 SE Lomond Ave | 0.29mi | 3/1.0 (+1) | 1,390 (-2%) | 6mo | $112,500 | $81 | 74 |
| 246 SE Lochlynn Ter | 0.31mi | 3/2.0 (+1) | 1,340 (-5%) | 6mo | $259,000 | $193 | 63 |
| 570 SE Sunflower Pl | 0.68mi | 3/2.0 (+1) | 1,400 (-1%) | 8mo | $264,500 | $189 | 51 |
| 240 SE Cameron Ter | 0.32mi | 3/2.0 (+1) | 1,225 (-13%) | 5mo | $235,000 | $192 | 49 |
| 465 SE Rosewood Cir | 0.73mi | 2/2.0 | 1,488 (+5%) | 6mo | $255,000 | $171 | 48 |
| 1047 SE Putnam St | 0.49mi | 3/2.5 (+1) | 1,256 (-11%) | 3mo | $76,500 | $61 | 45 |
| 319 SE Avalon Ave | 0.68mi | 3/3.0 (+1) | 1,344 (-5%) | 8mo | $174,400 | $130 | 40 |
| 465 SE Golf Club Ave | 0.60mi | 3/2.0 (+1) | 1,215 (-14%) | 0mo | $175,000 | $144 | 39 |
| 434 SE Rosewood Cir | 0.75mi | 3/2.0 (+1) | 1,511 (+7%) | 11mo | $265,000 | $175 | 36 |
| 1871 SE Baya Dr | 0.64mi | 3/2.0 (+1) | 1,575 (+11%) | 10mo | $175,000 | $111 | 34 |
| 654 SE Brown St | 0.67mi | 3/2.0 (+1) | 1,554 (+10%) | 12mo | $174,000 | $112 | 33 |
| 300 SE Defender Dr | 0.68mi | 3/1.5 (+1) | 1,247 (-12%) | 11mo | $116,000 | $93 | 33 |
Match score weights: distance 35% · size 25% · config 20% · recency 20%. Top-matched comps best support the ARV.
Projected returns pro-forma
10.0% appreciation · 3.0% rent growth · sell at horizon
- IRR
- 24.4%
- Equity multiple
- 2.96×
- Total profit
- $103,502
- Equity at exit
- $170,266
- IRR
- 21.6%
- Equity multiple
- 6.75×
- Total profit
- $304,304
- Equity at exit
- $367,185
Cash invested: $52,920 (down + closing). Projections, not guarantees.
Landlord ↔ Tenant lean methodology
- Overall (STATE)
- 87 Strongly Landlord-Friendly
- State Florida
- 87 Strongly Landlord-Friendly · R+3
- County
- — inherits STATE
- City
- — inherits STATE
ZIP-level market 32025
- Home prices YoY
- 6.8%
- Active inventory
- 143
- Price-to-rent
- 10.0×
Monthly cashflow live
- Estimated rent
- $1,582 medium interval (Pro) →
- Mortgage (P&I)
- −$991
- Tax from tax record
- −$171 /mo · $2,049/yr
- Insurance
- −$79
- HOA
- −$0
- Vacancy / Maint / Mgmt
- −$332
- Net cashflow
- $9
Break-even live
UW: 25.0% down · 7.5% · 30yr · 1.5% tax · 5.0% vac · 8.0% maint · 8.0% mgmt
Financing live
Cash to close
- Down payment
- $47,250
- Closing costs
- $5,670
- Reserves months
- —
- Total cash needed
- —
Loan-product check · same deal, 3 products live
Conventional
25% down · 7.5% · 30yr
- Down + closing
- —
- Monthly P&I
- —
- Monthly cashflow
- —
- DSCR
- —
- Eligible?
- —
Personal DTI + credit; lowest rate.
DSCR
20% down · 8.5% · 30yr
- Down + closing
- —
- Monthly P&I
- —
- Monthly cashflow
- —
- DSCR
- —
- Eligible?
- —
No personal income docs; deal must DSCR.
Hard money
10% down · 12.0% · 12mo
- Down + closing
- —
- Monthly P&I
- —
- Monthly cashflow
- —
- DSCR
- —
- Eligible?
- —
Short-term bridge; refi at stabilization.
Listing history 32 events
-
2026-06-19days on market $189,000 Active 323 DOM
-
2026-06-18days on market $189,000 Active 322 DOM
-
2026-06-17days on market $189,000 Active 321 DOM
-
2026-06-16days on market $189,000 Active 320 DOM
-
2026-06-15days on market $189,000 Active 319 DOM
-
2026-06-14days on market $189,000 Active 317 DOM
-
2026-06-12days on market $189,000 Active 316 DOM
-
2026-06-09days on market $189,000 Active 313 DOM
-
2026-06-08days on market $189,000 Active 312 DOM
-
2026-06-07days on market $189,000 Active 311 DOM
-
2026-06-05days on market $189,000 Active 308 DOM
-
2026-06-03days on market $189,000 Active 307 DOM
-
2026-06-02days on market $189,000 Active 306 DOM
-
2026-06-01days on market $189,000 Active 305 DOM
-
2026-05-31days on market $189,000 Active 304 DOM
-
2026-05-30days on market $189,000 Active 303 DOM
-
2026-05-06status Active
-
2026-04-28historical Active Under Contract
-
2026-04-14status Active
-
2026-03-02historical Active Under Contract
-
2025-11-07price $189,000
-
2025-09-08price $194,900
-
2025-07-31$199,900 Active
-
2025-01-03price $199,900
-
2024-10-23$219,900 Active
-
2023-01-17soldstatus $179,000 Closed 99-char remark
Show marketing remark (99 chars)
Completely remodeled with all new appliances, flooring, roof and AC. Cozy 2/1 in quiet neighborhood
-
2023-01-13$169,000 Active 99-char remark
Show marketing remark (99 chars)
Completely remodeled with all new appliances, flooring, roof and AC. Cozy 2/1 in quiet neighborhood
-
2022-08-09soldstatus $51,000
-
2020-08-23soldstatus $25,000
-
2016-09-07soldstatus $25,000
-
2016-08-23soldstatus $25,000
-
2016-08-09$20,800
ⓘ Source: listings_history table (triggers on properties + properties_extension) + one-shot
backfill from property_details.listing_events for pre-trigger history.
Tax reassessment forecast FL · Resets to sale price
- Current annual tax
- $2,049 · $171/mo
- Projected year-2 tax
- $2,049 · $171/mo
- Expected delta
- $0/yr ($0/mo · 0.0%)
ⓘ Screening estimate from a state-policy table — verify with the county assessor before closing.
Climate risk First Street
- Flood 1/10 Low FEMA zone X (unshaded) · 0% chance over 30 yrs
- Wildfire 7/10 Severe
- Heat 8/10 Severe 7 d/yr ≥107°F today · 20 d/yr by 30 yrs out
- Wind 9/10 Extreme 99% chance of damaging wind over 30 yrs
- Air quality 5/10 Major 9 unhealthy d/yr today · 10 by 30 yrs out
Nearby sold comps map
Loading sold comps map…
Walkable amenities ~0.75 mi
Loading nearby amenities…
Taxation est. · year 1
- Rental income
- $18,984
- − Mortgage interest
- −$10,587
- − Property taxes
- −$2,049
- − Insurance
- −$945
- − Repairs & maintenance
- −$1,519
- − Management
- −$1,519
- − Depreciation
- −$5,498
- Taxable loss
- −$3,132
- Est. tax savings @ 24.0%
- +$752
- After-tax cash flow
- $862/yr
For passive investors: Depreciation is non-cash, so a rental often shows a tax loss while cash-flowing — sheltering income. Rental losses are passive: they offset passive income freely, and up to $25,000/yr can offset ordinary (W-2) income if you actively participate and your MAGI is under $100k (phasing out to $0 by $150k); unused losses carry forward. On sale, claimed depreciation is recaptured at up to 25%, and gains may owe capital-gains tax (a 1031 exchange can defer both). Figures are a year-1 estimate at your 24.0% rate — not tax advice; consult a CPA.
Schools (NCES district)
- District
- Columbia
- NCES district ID
- 1200360
- Math proficiency
- 53% ▼ -10.00%
- Reading proficiency
- 54% ▼ -3.00%
- Median HH income
- $40,053
- Composite
- 44.74/100
- National rank
- #2750
- State rank
- #25 of 73 in FL
Livability — Watertown
- Score
- 60/100
- State rank
- #798
- US rank
- #18481
Category grades
Schools grade is shown separately in the Schools card above.
Census & demographics
- Census place
- Watertown, FL
- County
- Columbia County · 40,507 people
- Metro
- Lake City, FL
- Population (ZIP)
- 22,948
- Household income
- $55,004
- Rent vs Own
- Severe rent burden
- 754.0
Population outlook (Columbia County) Hauer SSP2
- Today (2025)
- 68,129 people
- By 2030
- 67,501 · -0.9%
- By 2040
- 65,465 · -3.9%
- By 2050
- 63,058 · -7.4%
- By 2075
- 56,291 · -17.4%
- By 2100
- 45,243 · -33.6%
Race, ethnicity, and origin ACS 2023
- Neighborhood character
- Predominantly White (67%)
- Race & ethnicity
- White 67% Black 20% Hispanic / Latino 8% Two or more races 7%
- Hispanic origin (detail)
- Mexican 1% Puerto Rican 3% Cuban 1%
- Common ancestry
- Serbian 2% Lithuanian 2% Romanian 2%
- Foreign-born
- 3% · Canada
- Languages at home
- 91% English-only · Spanish 6% French/Haitian/Cajun 2%
Political lean MEDSL · Columbia
- 2024 margin
- Solid R (+50.2) · D 24.6% · R 74.7%
- 2008→2024 swing
- -16.4pp toward R · 2008: -33.8pp · 2024: -50.2pp
- All cycles
- 2024: R+50.2 2020: R+45.2 2016: R+44.5 2012: R+36.7 2008: R+33.8
Not yet ingested
- Civics
- —
Market trends
- HPI YoY
- ▲ 17.57%
- Current HPI
- 276.7253
- Rent YoY
- —
- Metro
- Lake City, FL
- State GDP YoY
- ▲ 3.28%
- F500 in state
- 36
Industry mix (Fortune 500 HQ in FL)
| Industry | F500 HQs | Revenue |
|---|---|---|
| Industrial Technology | 2 | $29B |
|
||
| Insurance | 2 | $17B |
|
||
| Retail | 1 | $60B |
|
||
| Technology Distribution | 1 | $58B |
|
||
| Homebuilding | 1 | $35B |
|
||
| Technology Manufacturing | 1 | $35B |
|
||
Price history
+808.7% since first listed16 events — show timeline
- 2026-05-06 Relisted — NFMLS
- 2026-04-28 Contingent — NFMLS
- 2026-04-14 Relisted — NFMLS
- 2026-03-02 Contingent — NFMLS
- 2025-11-07 Price Changed $189,000 NFMLS
- 2025-09-08 Price Changed $194,900 NFMLS
- 2025-07-31 Listed $199,900 NFMLS
- 2025-01-03 Price Changed $199,900 NFMLS
- 2024-10-23 Listed $219,900 NFMLS
- 2023-01-17 Sold (MLS) $179,000 NFMLS
- 2023-01-13 Listed $169,000 NFMLS
- 2022-08-09 Sold (Public Records) $51,000 Public Records
- 2020-08-23 Sold (MLS) $25,000 NFMLS
- 2016-09-07 Sold (MLS) $25,000 Stellar MLS as Distributed by MLS Grid
- 2016-08-23 Sold (MLS) $25,000 NFMLS
- 2016-08-09 Listed $20,800 Stellar MLS as Distributed by MLS Grid
Property tax history
+10.2%/yrLatest (2025): $2,049 · -0.7% YoY. Source: county tax records.
Cash-flow waterfall
monthlySold comps — $/sqft
last 12 mo · ≤1 miLoading sold comps…