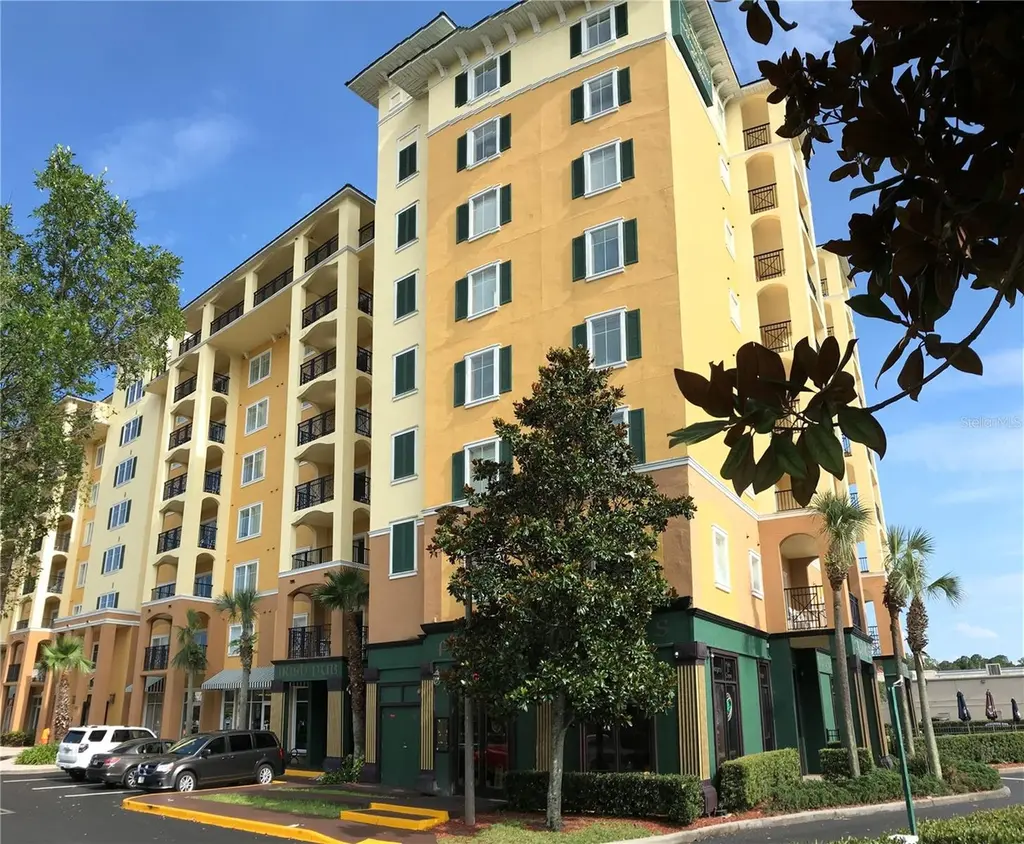
8112 Poinciana Blvd #1302 · Hunters Creek, FL
Flood risk No data
- FEMA flood zone
- —
- Chance of flooding over 30 yrs
- —
- Est. flood insurance / yr
- —
Fire risk No data
- Est. fire insurance / yr
- —
Heat risk No data
- Hot days now (above threshold)
- —
- Hot days in 30 yrs
- —
Wind risk No data
- Chance of severe wind over 30 yrs
- —
Air-quality risk No data
- Unhealthy air days now
- —
- Unhealthy air days in 30 yrs
- —
Risk factors via First Street. Map © Google.
Why this score? — see what drove the C- grade
The composite is a weighted blend of 9 inputs, each scored 0–100. Each bar is that input's sub-score; the figure is the points it added to the 100-point composite (weight × sub-score).
- Cash flow +15.1/30.0
- 1% rule +10.0/10.0
- ARV discount +7.5/15.0
- Appreciation +5.1/10.0
- DSCR +4.6/10.0
- Schools +4.1/10.0
- Livability +3.8/5.0
- Condition / age +2.5/5.0
- Rent growth +1.7/5.0
$149,000
🖨 Deal sheet 📄 Offer letter ✓ Due diligence
Listing remarks
Welcome to resort-style living in the heart of Lake Buena Vista! This beautifully maintained 3-bedroom, 2-bath condo is located in the highly desirable Lake Buena Vista Resort Village & Spa, just minutes from Disney, Universal, shopping, restaurants, and Orlando’s top attractions. This spacious unit features an open floor plan with ceramic tile in the main living areas, a fully equipped kitchen with granite countertops and breakfast bar, and a private balcony perfect for relaxing after a day in the parks. The primary suite offers a spa-like bathroom with a garden tub and separate shower. Enjoy incredible community amenities including a resort-style pool, pirate ship water featur
Key facts
- Fitness center
- Private balcony
- Community amenities
Tags
Property features AI
Finance
- Other: Furnished; Association contact listed; Deed restrictions apply; Association recreation owned
- Financial info: Total annual association fees approximately $9,843.36; Lease restrictions apply
- HOA & community: Monthly HOA fee of $820.28; Association amenities include clubhouse, fitness center, pool, playground, recreational facilities, maintenance (structure and grounds), pest control, security, trash, internet and cable; Association fee is required; Pets allowed; Handicap modified / wheelchair access in community
Exterior
- Parking: Open parking
- Security: Fire sprinkler system; Key card entry; Smoke detectors
- Utilities: Public sewer; BB/HS internet available; Cable connected; Electricity connected; Phone available; No water source listed
- Home design: Condo - Hotel; Residential property; Completed condition; Faces northeast; One level; Located on 2nd floor
- Construction: Concrete construction; Membrane roof; Slab foundation; Building with elevator; Built as part of an 8-story building
- Exterior features: Balcony; In-ground pool and spa with gunite construction; Fiber optic pool lighting; Mature landscaping; Asphalt road access
Interior
- Kitchen: Dishwasher; Disposal; Microwave; Range; Range hood; Refrigerator; Stone counters
- Bedrooms: 3 bedrooms
- Flooring: Carpet; Ceramic tile
- Bathrooms: 2 full bathrooms
- Heating & cooling: Central heating (electric); Central air
- Interior features: Ceiling fans; Elevator in building; Living room/dining room combo; Open floor plan; Stone counters; Window treatments (blinds)
- Laundry & utility: Washer and dryer included; Laundry closet; Electric water heater
Neighborhood map
What this means for you Summary
Snapshot
- This is a 3-bed/2.0-bath condo listed at $149k.
Deal economics
- At list price, monthly cash flow is $50 ($605/yr) — positive.
- The deal already cash-flows at list — no discount required.
- Meets the 1% rule at list price ($2k rent vs $149k).
- Recommended offer: $145k (3.0% below list) — sets the bar for market timing.
- Cap rate 6.7% vs local median 3.3% in Hunters Creek — top-decile yield for the area; either an underpriced asset or a hidden risk that comps aren't pricing in. Stress-test before assuming the spread holds.
Location & tenants
- Location reads 76/100 on livability (#222 in FL, #3,277 nationally) — a middle-class / working-renter tenant base. Strengths: crime A+, housing A+, employment A; Watch: commute D, amenities F.
- Orange (suburban): math 46% / reading 51% proficiency, ranked #43 of 73 in FL (top 59%) — families likely to look elsewhere, expect single-tenant / working-renter base with shorter leases.
- Zoned schools: Sunshine Elementary (math 41% / reading 43%, grade F, #1,403 of 2,144 statewide, top 67%, 949 students, 41% FRL); Freedom High (math 28% / reading 43%, grade F, #367 of 667 statewide, top 57%, 2,623 students, 53% FRL).
- Market conditions: Rents falling (-3.2%/yr); 275 active listings in the ZIP; 39 comparable units currently listed for rent nearby; rentals at typical pace (median 15d on market — plan ~3-4 weeks tenant-placement turnaround); 8,053 units permitted in Orange County in 2024 (3,133 in 5+ unit buildings).
- This rent runs 43% of the median local income ($69k/yr) — at the standard rent-burdened threshold; future hikes will face affordability resistance.
Forward outlook
- In year one you build about $1k of equity ($1k loan paydown + $442 appreciation (0.3% local appreciation)).
- Orange County population projected at +52% by 2050 — long-run rental-demand tailwind backs the buy-and-hold thesis.
Negotiation context
- It's been on market 31 days — a 3% lower offer ($145k) is reasonable based on typical stale-listing flexibility.
Risks & watch-outs
- Watch-outs: HOA is 33% of rent.
Questions for the listing agent
- It's been on market 31 days. Have you received any prior offers? Is the seller open to a 3% concession, seller financing, or rate buy-down credit?
- What does the HOA fee cover, when was the last increase, and are there any pending special assessments or reserve-fund shortfalls?
- Any open or pending special assessments — roof, HVAC, plumbing, elevator, façade? What's the per-unit balance and payoff schedule, and is the seller paying it off at close or rolling it to the buyer?
- Is there a deadline driving the sale (1031 exchange, divorce, estate, relocation)? That informs how much negotiation room exists.
- Schools are B-rated — typically a magnet for longer-tenancy family renters. What's the average tenant stay here, and is there a school-zone premium baked into asking?
- What's the average days-on-market for RENTAL listings here right now (not sales)? A rising rental-DOM trend means longer vacancies and softer asking-rent achievability than the comps imply.
- What's the recent tenant-quality profile in this submarket — average credit score on applications, eviction rate, late-payment / NSF rate, and stable-employment percentage? A property-management company in the area should have these aggregated.
- How much new apartment / multifamily construction is in the pipeline within 1–3 miles? Heavy new supply (>2% of stock underway) typically softens rents 12–24 months out; light construction supports rent growth.
Investment metrics
- 1% rule
- 1.65% ✓
- Cap rate
- 6.70%
- Cash-on-cash
- 1.45%
- DSCR
- 1.06
- GRM
- 5.0
CMA / ARV
No comps found within radius.
Projected returns pro-forma
0.3% appreciation · 0.0% rent growth · sell at horizon
- IRR
- -2.9%
- Equity multiple
- 0.86×
- Total profit
- $-5,701
- Equity at exit
- $45,489
- IRR
- -1.1%
- Equity multiple
- 0.89×
- Total profit
- $-4,452
- Equity at exit
- $56,488
Cash invested: $41,720 (down + closing). Projections, not guarantees.
Landlord ↔ Tenant lean methodology
- Overall (STATE)
- 87 Strongly Landlord-Friendly
- State Florida
- 87 Strongly Landlord-Friendly · R+3
- County
- — inherits STATE
- City
- — inherits STATE
ZIP-level market 32821
- Home prices YoY
- 0.1%
- Rents YoY
- -3.2%
- Active inventory
- 275
- Price-to-rent
- 5.0×
Monthly cashflow live
- Estimated rent
- $2,461 high interval (Pro) →
- Mortgage (P&I)
- −$781
- Tax from tax record
- −$230 /mo · $2,761/yr
- Insurance
- −$62
- HOA
- −$820
- Vacancy / Maint / Mgmt
- −$517
- Net cashflow
- $50
Break-even live
UW: 25.0% down · 7.5% · 30yr · 1.5% tax · 5.0% vac · 8.0% maint · 8.0% mgmt
Financing live
Cash to close
- Down payment
- $37,250
- Closing costs
- $4,470
- Reserves months
- —
- Total cash needed
- —
Loan-product check · same deal, 3 products live
Conventional
25% down · 7.5% · 30yr
- Down + closing
- —
- Monthly P&I
- —
- Monthly cashflow
- —
- DSCR
- —
- Eligible?
- —
Personal DTI + credit; lowest rate.
DSCR
20% down · 8.5% · 30yr
- Down + closing
- —
- Monthly P&I
- —
- Monthly cashflow
- —
- DSCR
- —
- Eligible?
- —
No personal income docs; deal must DSCR.
Hard money
10% down · 12.0% · 12mo
- Down + closing
- —
- Monthly P&I
- —
- Monthly cashflow
- —
- DSCR
- —
- Eligible?
- —
Short-term bridge; refi at stabilization.
Rent comps 39 comps
| Address | Beds | Baths | Sqft | Rent | $/sqft | DOM | Units | Dist |
|---|---|---|---|---|---|---|---|---|
| 8097 Poinciana Blvd Orlando, FL | 1.0–3.0 | 1.0–2.0 | 1075 | $2,869 | $2.67 | 1d | 31 | 0.11mi |
| 6011 Vineland Resort Way Orlando, FL | 1.0–3.0 | 1.0–2.0 | 1082 | $2,530 | $2.34 | 7d | 14 | 0.20mi |
| 7261 Crossroads Garden Dr Orlando, FL | 3.0 | 1.0–2.0 | 981 | $2,673 | $2.72 | 1d | 19 | 0.46mi |
| 3285 Peace Pipe Dr Kissimmee, FL | 3.0 | 2.0 | 1377 | $1,900 | $1.38 | 23d | 1 | 0.48mi |
| 4950 Lunar Ln Kissimmee, FL | 3.0 | 1.0–3.0 | 981 | $3,756 | $3.83 | 1d | 41 | 0.55mi |
| 5270 Warrior Ln Kissimmee, FL | 3.0 | 2.0 | 1123 | $1,995 | $1.78 | 23d | 1 | 0.59mi |
| 5212 Broken Arrow Dr Kissimmee, FL | 3.0 | 2.0 | 1377 | $2,250 | $1.63 | 23d | 1 | 0.63mi |
| 14051 International Dr Orlando, FL | 1.0–3.0 | 1.0–2.0 | 1115 | $2,998 | $2.69 | 2d | 53 | 0.64mi |
| 14501 Gateway Point Cir Orlando, FL | 1.0–4.0 | 1.0–2.0 | 1023 | $2,199 | $2.15 | 7d | 18 | 0.79mi |
| 5316 Barefoot Path Kissimmee, FL | 3.0 | 2.0 | 1410 | $2,100 | $1.49 | 23d | 1 | 0.82mi |
| 3251 Prime Park Cir Kissimmee, FL | 1.0–3.0 | 1.0–2.0 | 1020 | $2,492 | $2.44 | 2d | 21 | 0.83mi |
| 4865 Big Pine Loop Kissimmee, FL | 3.0 | 1.0–2.0 | 1023 | $3,382 | $3.31 | 14d | 127 | 0.86mi |
| 4865 Big Pine Loop Kissimmee, FL | 3.0 | 1.0–2.0 | 1023 | $3,254 | $3.18 | 2d | 320 | 0.86mi |
| 5279 Images Cir #207 Kissimmee, FL | 2.0 | 1.0 | 774 | $979 | $1.26 | 23d | 1 | 0.93mi |
| 5087 Dominica Dr Kissimmee, FL | 2.0 | 2.5 | 1304 | $1,650 | $1.27 | 23d | 1 | 0.93mi |
| 5095 Dominica Dr Kissimmee, FL | 2.0 | 3.0 | 1304 | $2,400 | $1.84 | 10d | 1 | 0.94mi |
| 3087 Seaview Castle Dr Unit 1549038P Kissimmee, FL | 3.0 | 3.0 | 1463 | $3,742 | $2.56 | 3d | 1 | 0.95mi |
| 5283 Images Cir #304 Kissimmee, FL | 2.0 | 2.0 | 969 | $1,600 | $1.65 | 10d | 1 | 0.96mi |
| 5283 Images Cir #304 Kissimmee, FL | 2.0 | 2.0 | 969 | $1,600 | $1.65 | 23d | 1 | 0.96mi |
| 4741 Clock Tower Dr #107 Kissimmee, FL | 2.0 | 2.0 | 1186 | $2,800 | $2.36 | 23d | 1 | 0.98mi |
| 5002 Mangrove Aly #104 Kissimmee, FL | 2.0 | 2.0 | 1066 | $1,749 | $1.64 | 10d | 1 | 0.99mi |
| 5299 Images Cir Kissimmee, FL | 1.0–3.0 | 1.0–3.0 | 1027 | $1,899 | $1.85 | 2d | 13 | 1.01mi |
| 3111 Paradox Cir Unit 1018148P Kissimmee, FL | 3.0 | 2.0 | 1184 | $2,593 | $2.19 | 7d | 1 | 1.03mi |
| 4701 Luminous Loop Kissimmee, FL | 1.0–3.0 | 1.0–2.0 | 973 | $2,345 | $2.41 | 2d | 36 | 1.04mi |
| 5404 Paradise Cay Cir Kissimmee, FL | 3.0 | 2.5 | 1364 | $2,000 | $1.47 | 23d | 1 | 1.05mi |
| 4721 Clock Tower Dr Unit 1359866P Kissimmee, FL | 2.0 | 2.0 | 1184 | $3,280 | $2.77 | 2d | 1 | 1.05mi |
| 2954 Sadina St Kissimmee, FL | 2.0 | 2.5 | 885 | $1,500 | $1.69 | 3d | 2 | 1.06mi |
| 3120 Paradox Cir #108 Kissimmee, FL | 3.0 | 2.0 | 1329 | $2,600 | $1.96 | 23d | 1 | 1.08mi |
| 3191 Paradox Cir Unit 205 Kissimmee, FL | 2.0 | 2.5 | 1126 | $2,500 | $2.22 | 23d | 1 | 1.11mi |
| 5492 Paradise Cay Cir Kissimmee, FL | 3.0 | 3.0 | 1337 | $2,200 | $1.65 | 23d | 1 | 1.12mi |
| 5311 Paradise Cay Cir Kissimmee, FL | 3.0 | 3.0 | 1187 | $1,700 | $1.43 | 7d | 1 | 1.13mi |
| 3171 Paradox Cir Unit 1UNIT 103 Kissimmee, FL | 2.0 | 2.0 | 1181 | $2,250 | $1.91 | 23d | 1 | 1.15mi |
| 1110 Spaceport Ct Kissimmee, FL | 2.0 | 2.0 | 1052 | $2,000 | $1.90 | 23d | 1 | 1.15mi |
| 3151 Paradox Cir Unit 1UNIT 202 Kissimmee, FL | 2.0 | 2.0 | 1181 | $2,700 | $2.29 | 23d | 1 | 1.16mi |
| 1024 Baseball and Boardwalk Ct Kissimmee, FL | 2.0 | 2.0 | 1052 | $2,000 | $1.90 | 23d | 1 | 1.17mi |
| 8815 Worldquest Blvd #2403 Orlando, FL | 2.0 | 2.0 | 1178 | $2,100 | $1.78 | 17d | 1 | 1.18mi |
| 2904 Edenshire Way #106 Kissimmee, FL | 3.0 | 2.0 | 1300 | $2,650 | $2.04 | 23d | 1 | 1.26mi |
| 15050 Ember Springs Cir Orlando, FL | 1.0–3.0 | 1.0–3.0 | 1066 | $2,412 | $2.26 | 1d | 34 | 1.27mi |
| 13427 Blue Heron Beach Dr Orlando, FL | 3.0 | 2.0 | 1165 | $2,950 | $2.53 | 23d | 1 | 1.50mi |
HOA detail condo
- Monthly dues
- $820 · $9,840/yr
- Likely covers
- waterpool
- Assessments
- None detected in remarks — confirm with the listing agent.
Listing history 16 events
-
2026-06-18days on market $149,000 Active 31 DOM
-
2026-06-17days on market $149,000 Active 30 DOM
-
2026-06-16days on market $149,000 Active 29 DOM
-
2026-06-15days on market $149,000 Active 28 DOM
-
2026-06-13days on market $149,000 Active 26 DOM
-
2026-06-13days on market $149,000 Active 25 DOM
-
2026-06-09days on market $149,000 Active 22 DOM
-
2026-06-08days on market $149,000 Active 21 DOM
-
2026-06-07pricedays on market $149,000 Active 20 DOM
-
2026-06-04days on market $169,000 Active 17 DOM
-
2026-06-03days on market $169,000 Active 16 DOM
-
2026-06-02days on market $169,000 Active 15 DOM
-
2026-06-01days on market $169,000 Active 14 DOM
-
2026-05-31days on market $169,000 Active 13 DOM
-
2026-05-18$169,000 Active
-
2009-11-09soldstatus $140,000
ⓘ Source: listings_history table (triggers on properties + properties_extension) + one-shot
backfill from property_details.listing_events for pre-trigger history.
Tax reassessment forecast FL · Resets to sale price
- Current annual tax
- $2,761 · $230/mo
- Projected year-2 tax
- $2,761 · $230/mo
- Expected delta
- $0/yr ($0/mo · 0.0%)
ⓘ Screening estimate from a state-policy table — verify with the county assessor before closing.
Nearby sold comps map
Loading sold comps map…
Walkable amenities ~0.75 mi
Loading nearby amenities…
Taxation est. · year 1
- Rental income
- $29,528
- − Mortgage interest
- −$8,346
- − Property taxes
- −$2,761
- − Insurance
- −$745
- − Repairs & maintenance
- −$2,362
- − Management
- −$2,362
- − HOA
- −$9,840
- − Depreciation
- −$4,335
- Taxable loss
- −$1,223
- Est. tax savings @ 24.0%
- +$294
- After-tax cash flow
- $898/yr
For passive investors: Depreciation is non-cash, so a rental often shows a tax loss while cash-flowing — sheltering income. Rental losses are passive: they offset passive income freely, and up to $25,000/yr can offset ordinary (W-2) income if you actively participate and your MAGI is under $100k (phasing out to $0 by $150k); unused losses carry forward. On sale, claimed depreciation is recaptured at up to 25%, and gains may owe capital-gains tax (a 1031 exchange can defer both). Figures are a year-1 estimate at your 24.0% rate — not tax advice; consult a CPA.
Schools (NCES district)
- District
- Orange
- NCES district ID
- 1201440
- Math proficiency
- 46% ▼ -9.00%
- Reading proficiency
- 51% ▼ -2.00%
- Median HH income
- $49,350
- Composite
- 41.47/100
- National rank
- #3461
- State rank
- #43 of 73 in FL
Livability — Hunters Creek
- Score
- 76/100
- State rank
- #222
- US rank
- #3277
Category grades
Schools grade is shown separately in the Schools card above.
Census & demographics
- County
- Orange County · 1,471,359 people
- Metro
- Orlando-Kissimmee-Sanford, FL
- Population (ZIP)
- 26,161
- Household income
- $69,348
- Rent vs Own
- Severe rent burden
- 1840.0
Population outlook (Orange County) Hauer SSP2
- Today (2025)
- 1,618,226 people
- By 2030
- 1,787,404 · +10.5%
- By 2040
- 2,125,621 · +31.4%
- By 2050
- 2,454,016 · +51.6%
- By 2075
- 3,173,711 · +96.1%
- By 2100
- 3,607,781 · +122.9%
Race, ethnicity, and origin ACS 2023
- Neighborhood character
- Diverse neighborhood (Simpson 0.65)
- Race & ethnicity
- White 43% Hispanic / Latino 41% Two or more races 19% Black 6% Asian 3% Pacific Islander 1% Native American 1%
- Hispanic origin (detail)
- Mexican 3% Puerto Rican 11% Cuban 1% Dominican 4%
- Common ancestry
- Romanian 3% Lithuanian 2% Estonian 2%
- Foreign-born
- 29% · Canada, Jamaica, China
- Languages at home
- 58% English-only · Spanish 32% Other Indo-European 4% Other Asian/Pacific 2%
Political lean MEDSL · Orange
- 2024 margin
- D (+13.6) · D 56.1% · R 42.5% · Other 1.3%
- 2008→2024 swing
- -5.0pp toward R · 2008: 18.6pp · 2024: 13.6pp
- All cycles
- 2024: D+13.6 2020: D+23.1 2016: D+24.6 2012: D+18.2 2008: D+18.6
Not yet ingested
- Civics
- —
Market trends
- HPI YoY
- ▲ 0.30%
- Current HPI
- 300.2268
- Rent YoY
- ▼ -3.20%
- Metro
- Orlando-Kissimmee-Sanford, FL
- State GDP YoY
- ▲ 3.28%
- F500 in state
- 36
Industry mix (Fortune 500 HQ in FL)
| Industry | F500 HQs | Revenue |
|---|---|---|
| Industrial Technology | 2 | $29B |
|
||
| Insurance | 2 | $17B |
|
||
| Retail | 1 | $60B |
|
||
| Technology Distribution | 1 | $58B |
|
||
| Homebuilding | 1 | $35B |
|
||
| Technology Manufacturing | 1 | $35B |
|
||
Price history
+20.7% since first listed2 events — show timeline
- 2026-05-18 Listed $169,000 Stellar MLS as Distributed by MLS Grid
- 2009-11-09 Sold (Public Records) $140,000 Public Records
Property tax history
+2.3%/yrLatest (2025): $2,761 · -2.9% YoY. Source: county tax records.
Cash-flow waterfall
monthlySold comps — $/sqft
last 12 mo · ≤1 miLoading sold comps…