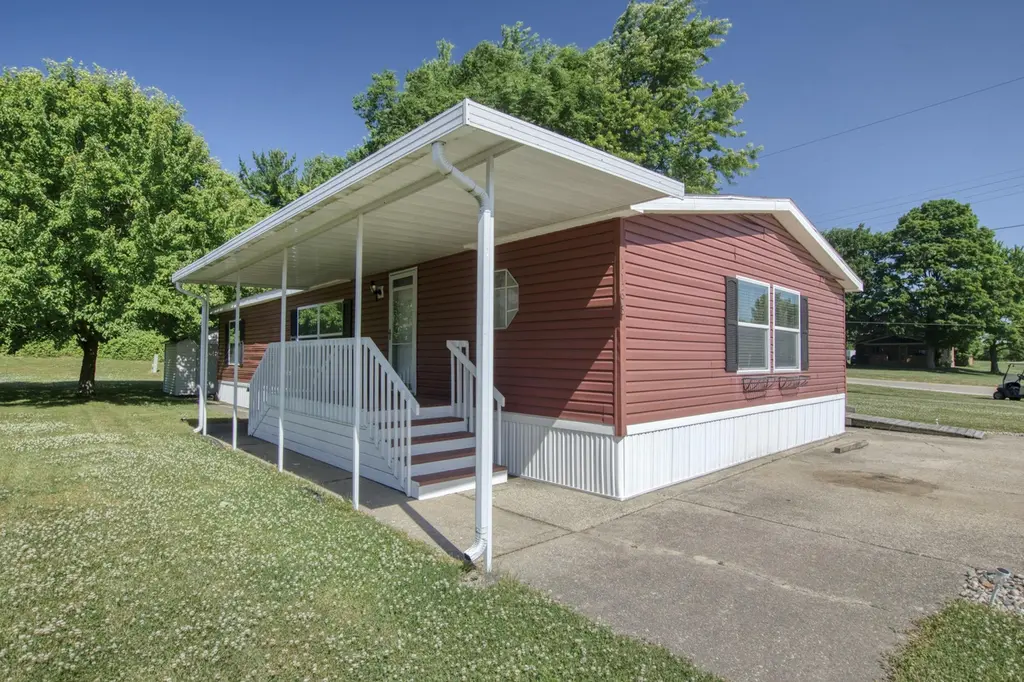
1163 Maple Leaf Ln NW · Walker, MI
Flood risk No data
- FEMA flood zone
- —
- Chance of flooding over 30 yrs
- —
- Est. flood insurance / yr
- —
Fire risk No data
- Est. fire insurance / yr
- —
Heat risk No data
- Hot days now (above threshold)
- —
- Hot days in 30 yrs
- —
Wind risk No data
- Chance of severe wind over 30 yrs
- —
Air-quality risk No data
- Unhealthy air days now
- —
- Unhealthy air days in 30 yrs
- —
Risk factors via First Street. Map © Google.
Why this score? — see what drove the C+ grade
The composite is a weighted blend of 9 inputs, each scored 0–100. Each bar is that input's sub-score; the figure is the points it added to the 100-point composite (weight × sub-score).
- Cash flow +30.0/30.0
- 1% rule +10.0/10.0
- DSCR +10.0/10.0
- Rent growth +4.5/5.0
- Livability +3.7/5.0
- Schools +3.4/10.0
- Condition / age +2.8/5.0
- ARV discount +0.0/15.0
- Appreciation +0.0/10.0
$108,000
🖨 Deal sheet 📄 Offer letter ✓ Due diligence
Listing remarks MLS
If you're looking for a little extra room to breathe, this is the one. This charming 1,300+ sq. ft. home perfectly balances cozy indoor living with exceptional outdoor spaces. Imagine relaxing in your primary suite, gathering around the fireplace, or enjoying a meal in the bright eat-in kitchen. The highlights continue outdoors with a private three-season porch and hot tub, plus a spacious deck perfect for weekend BBQs. Located just minutes from the best local amenities, this home is ready for its next chapter.
Key facts
- Hot tub
- Spacious deck
- Built 1990
Tags
Neighborhood map
What this means for you Summary
Snapshot
- This is a 3-bed/2.0-bath manufactured listed at $108k. Condition is rated average.
Deal economics
- At list price, monthly cash flow is $813 ($10k/yr) — positive.
- The deal already cash-flows at list — no discount required.
- Meets the 1% rule at list price ($2k rent vs $108k).
- Recommended offer: $102k (6.0% below list) — sets the bar for market timing.
- Cap rate 15.3% vs local median 4.1% in Walker — top-decile yield for the area; either an underpriced asset or a hidden risk that comps aren't pricing in. Stress-test before assuming the spread holds.
Location & tenants
- Location reads 74/100 on livability (#188 in MI, #4,765 nationally) — a middle-class / working-renter tenant base. Strengths: cost of living A+, housing A+, employment B+; Watch: amenities F, health & safety F.
- Kenowa Hills Public Schools (suburban): math 33% / reading 46% proficiency, ranked #205 of 540 in MI (top 38%) — families likely to look elsewhere, expect single-tenant / working-renter base with shorter leases.
- Market conditions: Rents rising fast (+7.9%/yr); 111 active listings in the ZIP; 4 comparable units currently listed for rent nearby; rentals leasing fast (median 11d on market — plan ~1-2 weeks tenant-placement turnaround); solid renter incomes; 2,253 units permitted in Kent County in 2024 (969 in 5+ unit buildings).
Forward outlook
- Local home prices are declining (-3.0%/yr); year-one equity from $747 of loan paydown is wiped out by about $3k of value loss. Plan a longer hold.
- Kent County population projected at +22% by 2050 — long-run rental-demand tailwind backs the buy-and-hold thesis.
- At projected returns (-3.0% appreciation + 7.9% rent growth), your $30k cash investment doubles in ~4 years — after that, you're playing with house money.
Negotiation context
- It's been on market 62 days — a 6% lower offer ($102k) is reasonable based on typical stale-listing flexibility.
- 7 sale attempts with the ask held roughly flat each time — persistent listings suggest the price (not the market) is what's stuck; bring a comps-based counter.
Questions for the listing agent
- It's been on market 62 days. Have you received any prior offers? Is the seller open to a 6% concession, seller financing, or rate buy-down credit?
- Why hasn't it sold? Are there any deal-killer items the seller is aware of (foundation, flood, title, zoning, code violations)?
- Is there a deadline driving the sale (1031 exchange, divorce, estate, relocation)? That informs how much negotiation room exists.
- What's the average days-on-market for RENTAL listings here right now (not sales)? A rising rental-DOM trend means longer vacancies and softer asking-rent achievability than the comps imply.
- What's the recent tenant-quality profile in this submarket — average credit score on applications, eviction rate, late-payment / NSF rate, and stable-employment percentage? A property-management company in the area should have these aggregated.
- How much new for-sale + rental construction is in the pipeline within 1–3 miles? Heavy new supply typically softens prices + rents 12–24 months out; constrained supply supports both.
Investment metrics
- 1% rule
- 1.83% ✓
- Cap rate
- 15.33%
- Cash-on-cash
- 32.28%
- DSCR
- 2.44
- GRM
- 4.6
CMA / ARV
- ARV (median comp)
- $77,884
- List price
- $108,000
- Delta
- 38.67%
- Verdict
- OVERPRICED
- Comps
- 8 within 1.0 mi
Show comp detail 5 sales within ~0.75 mi
| Address | Dist | Beds/Ba | Sqft | Sold | Price | $/sf | Match |
|---|---|---|---|---|---|---|---|
| 4598 Gardens Blvd NW | 0.20mi | 3/2.0 | 1,293 (-4%) | 6mo | $94,900 | $73 | 78 |
| 1123 Marvin Ct NW Lot 46 | 0.10mi | 3/2.0 | 1,216 (-10%) | 2mo | $75,000 | $62 | 77 |
| 135 Shapell Ln NW | 0.32mi | 3/2.0 | 1,371 (+2%) | 9mo | $90,000 | $66 | 75 |
| 79 Shapell Ln NW | 0.24mi | 3/2.0 | 1,456 (+8%) | 9mo | $115,000 | $79 | 68 |
| 4676 Gardens Blvd NW | 0.26mi | 3/2.0 | 1,210 (-10%) | 8mo | $58,000 | $48 | 64 |
Match score weights: distance 35% · size 25% · config 20% · recency 20%. Top-matched comps best support the ARV.
Projected returns pro-forma
-3.0% appreciation · 7.87% rent growth · sell at horizon
- IRR
- 32.7%
- Equity multiple
- 2.47×
- Total profit
- $44,487
- Equity at exit
- $16,103
- IRR
- 42.3%
- Equity multiple
- 6.01×
- Total profit
- $151,640
- Equity at exit
- $9,338
Cash invested: $30,240 (down + closing). Projections, not guarantees.
Landlord ↔ Tenant lean methodology
- Overall (STATE)
- 62 Landlord-Friendly
- State Michigan
- 62 Landlord-Friendly · EVEN
- County
- — inherits STATE
- City
- — inherits STATE
ZIP-level market 49534
- Home prices YoY
- -28.4%
- Rents YoY
- 7.9%
- Active inventory
- 111
- Price-to-rent
- 4.6×
Monthly cashflow live
- Estimated rent
- $1,974 medium interval (Pro) →
- Mortgage (P&I)
- −$566
- Tax est. 1.5%
- −$135 /mo · $1,620/yr
- Insurance
- −$45
- HOA
- −$0
- Vacancy / Maint / Mgmt
- −$415
- Net cashflow
- $813
Break-even live
UW: 25.0% down · 7.5% · 30yr · 1.5% tax · 5.0% vac · 8.0% maint · 8.0% mgmt
Financing live
Cash to close
- Down payment
- $27,000
- Closing costs
- $3,240
- Reserves months
- —
- Total cash needed
- —
Loan-product check · same deal, 3 products live
Conventional
25% down · 7.5% · 30yr
- Down + closing
- —
- Monthly P&I
- —
- Monthly cashflow
- —
- DSCR
- —
- Eligible?
- —
Personal DTI + credit; lowest rate.
DSCR
20% down · 8.5% · 30yr
- Down + closing
- —
- Monthly P&I
- —
- Monthly cashflow
- —
- DSCR
- —
- Eligible?
- —
No personal income docs; deal must DSCR.
Hard money
10% down · 12.0% · 12mo
- Down + closing
- —
- Monthly P&I
- —
- Monthly cashflow
- —
- DSCR
- —
- Eligible?
- —
Short-term bridge; refi at stabilization.
Rent comps 4 comps
| Address | Beds | Baths | Sqft | Rent | $/sqft | DOM | Units | Dist |
|---|---|---|---|---|---|---|---|---|
| 680 Lake Michigan Dr NW Unit O-686 Grand Rapids, MI | 2.0 | 1.0 | 900 | $1,375 | $1.53 | 2d | 1 | 1.37mi |
| 680 Lake Michigan Dr NW Unit O-682 Grand Rapids, MI | 2.0 | 1.0 | 900 | $1,275 | $1.42 | 43d | 1 | 1.37mi |
| 680 Lake Michigan Dr NW Unit O-680 Grand Rapids, MI | 2.0 | 1.0 | 900 | $1,399 | $1.55 | 11d | 1 | 1.37mi |
| 3822 Richmond St NW Walker, MI | 3.0 | 2.0 | 1450 | $2,645 | $1.82 | 2d | 1 | 1.43mi |
Listing history 32 events
-
2026-06-18days on market $108,000 Active 62 DOM
-
2026-06-17days on market $108,000 Active 61 DOM
-
2026-06-16days on market $108,000 Active 60 DOM
-
2026-06-15days on market $108,000 Active 59 DOM
-
2026-06-14days on market $108,000 Active 57 DOM
-
2026-06-10days on market $108,000 Active 54 DOM
-
2026-06-09days on market $108,000 Active 53 DOM
-
2026-06-08days on market $108,000 Active 52 DOM
-
2026-06-07pricedays on market $108,000 Active 51 DOM
-
2026-06-03days on market $113,000 Active 47 DOM
-
2026-06-03days on market $113,000 Active 46 DOM
-
2026-06-01days on market $113,000 Active 45 DOM
-
2026-05-31days on market $113,000 Active 44 DOM
-
2026-04-17$113,000 Active 516-char remark
Show marketing remark (516 chars)
If you're looking for a little extra room to breathe, this is the one. This charming 1,300+ sq. ft. home perfectly balances cozy indoor living with exceptional outdoor spaces. Imagine relaxing in your primary suite, gathering around the fireplace, or enjoying a meal in the bright eat-in kitchen. The highlights continue outdoors with a private three-season porch and hot tub, plus a spacious deck perfect for weekend BBQs. Located just minutes from the best local amenities, this home is ready for its next chapter.
-
2026-04-17$113,000 Active
Show marketing remark (516 chars)
If you're looking for a little extra room to breathe, this is the one. This charming 1,300+ sq. ft. home perfectly balances cozy indoor living with exceptional outdoor spaces. Imagine relaxing in your primary suite, gathering around the fireplace, or enjoying a meal in the bright eat-in kitchen. The highlights continue outdoors with a private three-season porch and hot tub, plus a spacious deck perfect for weekend BBQs. Located just minutes from the best local amenities, this home is ready for its next chapter.
-
2025-11-24historical
-
2025-09-23price $99,000
-
2025-09-23price $99,000
-
2025-09-23price $99,000
-
2025-09-06price $108,000
-
2025-09-05price $108,000
-
2025-09-05price $108,000
-
2025-08-23status Active
-
2025-08-23status Active
-
2025-08-15status Pending
-
2025-08-15status Pending
-
2025-07-18price $113,000
-
2025-07-17price $113,000
-
2025-07-17price $113,000
-
2025-07-03$116,000 Active
-
2025-07-03$116,000 Active
ⓘ Source: listings_history table (triggers on properties + properties_extension) + one-shot
backfill from property_details.listing_events for pre-trigger history.
Nearby sold comps map
Loading sold comps map…
Walkable amenities ~0.75 mi
Loading nearby amenities…
Taxation est. · year 1
- Rental income
- $23,693
- − Mortgage interest
- −$6,050
- − Property taxes
- −$1,620
- − Insurance
- −$540
- − Repairs & maintenance
- −$1,895
- − Management
- −$1,895
- − Depreciation
- −$3,142
- Taxable income
- $8,551
- Est. tax owed @ 24.0%
- −$2,052
- After-tax cash flow
- $7,709/yr
For passive investors: Depreciation is non-cash, so a rental often shows a tax loss while cash-flowing — sheltering income. Rental losses are passive: they offset passive income freely, and up to $25,000/yr can offset ordinary (W-2) income if you actively participate and your MAGI is under $100k (phasing out to $0 by $150k); unused losses carry forward. On sale, claimed depreciation is recaptured at up to 25%, and gains may owe capital-gains tax (a 1031 exchange can defer both). Figures are a year-1 estimate at your 24.0% rate — not tax advice; consult a CPA.
Condition & rehab AI · 12 photos
This 1,350 sq ft manufactured home requires moderate renovations to improve its curb appeal and interior aesthetics, enhancing both resale and rental value.
Repairs flagged
- Minor kitchen cabinets — slight wear
- Minor bathroom fixtures — standard fixtures
- Moderate exterior paint — red siding needs touch-up
Value-add opportunities
- Both paint interior walls — enhances curb appeal and interior aesthetics
- Both replace kitchen cabinets — modernizes the space and increases value
- Both update bathrooms — modernizes the space and increases value
Renovation cost estimate screening
| Repair item | Severity | Est. cost |
|---|---|---|
| kitchen cabinets · slight wear | Minor | $500–3,000 |
| bathroom fixtures · standard fixtures | Minor | $500–3,000 |
| exterior paint · red siding needs touch-up | Moderate | $3,000–15,000 |
| Total estimated repair cost · 3 items | $4,000–21,000 |
Value-add ROI direction
- Both paint interior walls — enhances curb appeal and interior aesthetics ↑
- Both replace kitchen cabinets — modernizes the space and increases value ↑
- Both update bathrooms — modernizes the space and increases value ↑
ⓘ Cost ranges are severity-bucket heuristics (US national rule-of-thumb). Get contractor quotes + a written scope before underwriting a rehab budget.
Schools (NCES district)
- District
- Kenowa Hills Public Schools
- NCES district ID
- 2620280
- Math proficiency
- 33% ▬ 0.00%
- Reading proficiency
- 46% ▼ -6.00%
- Median HH income
- $53,387
- Composite
- 34.36/100
- National rank
- #5221
- State rank
- #205 of 540 in MI
Livability — Walker
- Score
- 74/100
- State rank
- #188
- US rank
- #4765
Category grades
Schools grade is shown separately in the Schools card above.
Census & demographics
- Census place
- Walker, MI
- County
- Kent County · 533,805 people
- City population
- 33,350
- Metro
- Grand Rapids-Kentwood, MI
- Population (ZIP)
- 23,719
- Household income
- $81,657
- Rent vs Own
- Severe rent burden
- 415.0
Population outlook (Kent County) Hauer SSP2
- Today (2025)
- 712,484 people
- By 2030
- 748,618 · +5.1%
- By 2040
- 814,777 · +14.4%
- By 2050
- 868,556 · +21.9%
- By 2075
- 966,487 · +35.7%
- By 2100
- 967,975 · +35.9%
Race, ethnicity, and origin ACS 2023
- Neighborhood character
- Predominantly White (87%)
- Race & ethnicity
- White 87% Two or more races 5% Hispanic / Latino 4% Black 2% Asian 2%
- Common ancestry
- Iranian 20% Romanian 12% Lithuanian 2%
- Foreign-born
- 4% · Canada, China
- Languages at home
- 95% English-only · Spanish 1% Other Indo-European 1% Tagalog/Filipino 1%
Political lean MEDSL · Kent
- 2024 margin
- Lean D (+5.4) · D 51.8% · R 46.5% · Other 1.7%
- 2008→2024 swing
- +4.8pp toward D · 2008: 0.5pp · 2024: 5.4pp
- All cycles
- 2024: D+5.4 2020: D+6.1 2016: R+3.1 2012: R+7.9 2008: D+0.5
Not yet ingested
- Civics
- —
Market trends
- HPI YoY
- ▼ -107.59%
- Current HPI
- 270.866
- Rent YoY
- ▲ 7.87%
- Metro
- Grand Rapids-Kentwood, MI
- State GDP YoY
- ▲ 1.37%
- F500 in state
- 28
Industry mix (Fortune 500 HQ in MI)
| Industry | F500 HQs | Revenue |
|---|---|---|
| Automotive Parts | 3 | $48B |
|
||
| Automotive | 2 | $372B |
|
||
| Chemicals | 1 | $45B |
|
||
| Automotive Retail | 1 | $29B |
|
||
| Healthcare / Medical Devices | 1 | $23B |
|
||
| Automotive Technology | 1 | $20B |
|
||
Price history
-2.6% since first listed19 events — show timeline
- 2026-04-17 Listed $113,000 SW Michigan MLS
- 2026-04-17 Listed $113,000 MiRealSource-MiMLS
- 2026-04-17 Listed $113,000 REALCOMP
- 2025-11-24 Listing Removed — MiRealSource-MiMLS
- 2025-09-23 Price Changed $99,000 MiRealSource-MiMLS
- 2025-09-23 Price Changed $99,000 REALCOMP
- 2025-09-23 Price Changed $99,000 SW Michigan MLS
- 2025-09-06 Price Changed $108,000 MiRealSource-MiMLS
- 2025-09-05 Price Changed $108,000 REALCOMP
- 2025-09-05 Price Changed $108,000 SW Michigan MLS
- 2025-08-23 Relisted — REALCOMP
- 2025-08-23 Relisted — MiRealSource-MiMLS
- 2025-08-15 Pending — MiRealSource-MiMLS
- 2025-08-15 Pending — REALCOMP
- 2025-07-18 Price Changed $113,000 MiRealSource-MiMLS
- 2025-07-17 Price Changed $113,000 REALCOMP
- 2025-07-17 Price Changed $113,000 SW Michigan MLS
- 2025-07-03 Listed $116,000 REALCOMP
- 2025-07-03 Listed $116,000 MiRealSource-MiMLS
Cash-flow waterfall
monthlySold comps — $/sqft
last 12 mo · ≤1 miLoading sold comps…