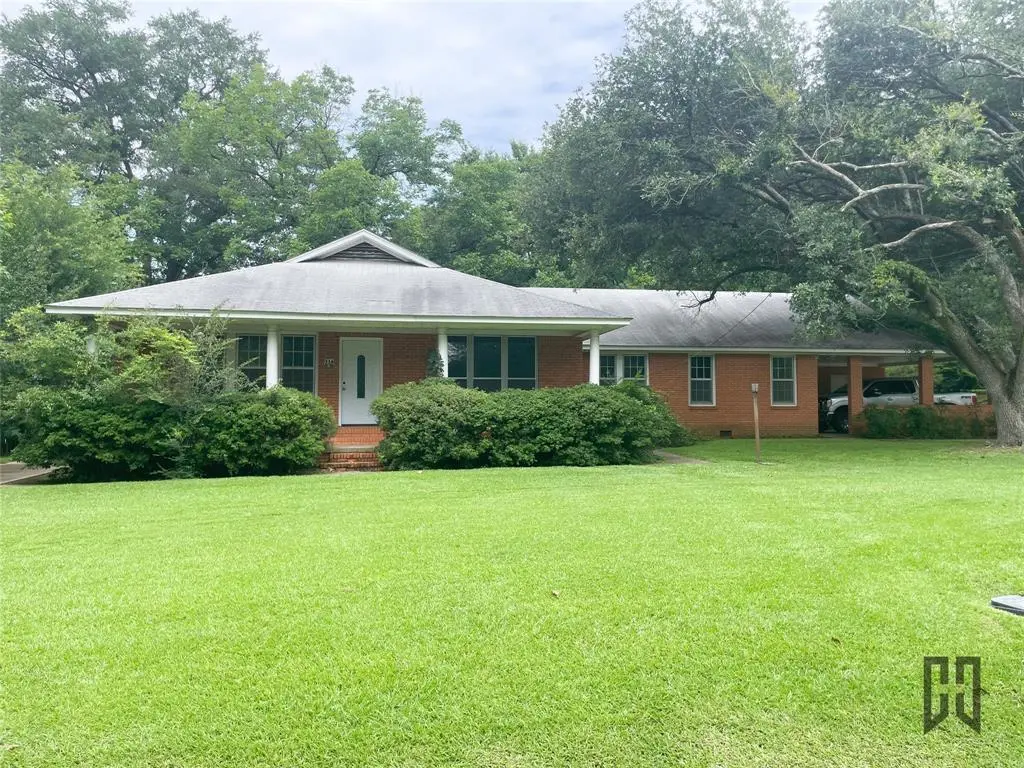
714 Butler St · Springhill, LA
Flood risk 1/10 · Minimal
- FEMA flood zone
- X (unshaded)
- Chance of flooding over 30 yrs
- 0.0%
- Est. flood insurance / yr
- $507 – $1,088
Fire risk 4/10 · Minor
- Est. fire insurance / yr
- $1,269 – $2,357
Heat risk 7/10 · Major
- Hot days now (above 111°F)
- 7 days/yr
- Hot days in 30 yrs
- 22 days/yr
Wind risk 6/10 · Moderate
- Chance of severe wind over 30 yrs
- 51.0%
Air-quality risk 1/10 · Minimal
- Unhealthy air days now
- 0 days/yr
- Unhealthy air days in 30 yrs
- 0 days/yr
Risk factors via First Street. Map © Google.
Why this score? — see what drove the C grade
The composite is a weighted blend of 9 inputs, each scored 0–100. Each bar is that input's sub-score; the figure is the points it added to the 100-point composite (weight × sub-score).
- Cash flow +18.4/30.0
- ARV discount +15.0/15.0
- Appreciation +6.8/10.0
- DSCR +5.8/10.0
- 1% rule +3.8/10.0
- Livability +3.2/5.0
- Rent growth +2.5/5.0
- Condition / age +2.5/5.0
- Schools +1.8/10.0
$150,000
🖨 Deal sheet 📄 Offer letter ✓ Due diligence
Listing remarks
Great opportunity for investors, flippers, or buyers looking to add value! This spacious brick home offers 4 bedrooms, 1 full bathroom, and 2 half bathrooms with excellent potential to create additional living space. One of the half baths could easily be converted into a second full bathroom by adding a shower, increasing both functionality and value. Several major improvements have already been completed, including updated flooring, fresh paint, updated lighting, plumbing improvements, and foundation work, providing a solid starting point for the next owner. The flexible floor plan features oversized rooms, abundant natural light, multiple living spaces, and a large dining or conference-st
Key facts
- Spacious brick home
- Fresh paint
- Foundation work
Tags
Property features AI
Finance
- Other: Property does not lie in a municipal utility district; Community amenities nearby include airport/runway, fishing, fitness center, golf, jogging/bike path, laundry, park and restaurant
- Financial info: Listing accepts Cash and Conventional financing
- HOA & community: No homeowners association
Exterior
- Parking: Attached carport; Covered parking for 2 vehicles; Carport with concrete surface
- Utilities: City water; City sewer; Electricity available; Natural gas available; Individual gas meter; Individual water meter; Cable available
- Home design: Single-family residence; One-story home; Accessible approach with ramp and accessible full bath and entrance; Residential property
- Construction: Brick construction; Asphalt roof; Pillar/post/pier foundation; Built in 1965
- Exterior features: Covered patio/porch; Utilities easement on property; All-weather road access; Concrete surfaces
Interior
- Kitchen: Dishwasher; Electric oven
- Bedrooms: Primary bedroom on the main level; Three additional bedrooms on the main level (four bedrooms total)
- Flooring: Laminate flooring
- Bathrooms: One full bathroom; Two half bathrooms (three total bathrooms)
- Heating & cooling: Central heating; Central air conditioning; Ceiling fans
- Interior features: Cable TV available; Breakfast bar
- Laundry & utility: Laundry area located in hall
Neighborhood map
What this means for you Summary
Snapshot
- This is a 4-bed/2.0-bath single-family listed at $150k.
Deal economics
- At list price, monthly cash flow is $140 ($2k/yr) — positive.
- The deal already cash-flows at list — no discount required.
- To meet the 1% rule (rent ≥ 1% of price), the offer needs to be $131k (12.5% below list).
- Recommended offer: $131k (12.5% below list) — sets the bar for 1% rule.
Location & tenants
- Location reads 65/100 on livability (#139 in LA) — a middle-class / working-renter tenant base. Strengths: cost of living A+, crime A-, health & safety A-; Watch: amenities F, commute F, employment F.
- Webster Parish (town): math 17% / reading 26% proficiency, ranked #67 of 98 in LA (top 68%) — low school quality limits family demand, transient renter base, plan for 1-2y turnover; 61% free/reduced lunch — lower-income household profile, screen leases tightly.
- Market conditions: 44 active listings in the ZIP; 36 units permitted in Webster Parish in 2024 (0 in 5+ unit buildings).
Forward outlook
- In year one you build about $6k of equity ($1k loan paydown + $5k appreciation (3.6% local appreciation)).
- Webster County population projected at -21% by 2050 — secular population decline; favor cash flow + early exit over multi-decade hold.
- At projected returns (3.6% appreciation + 3.0% rent growth), your $42k cash investment doubles in ~5 years — after that, you're playing with house money.
- By year 6, paydown + projected appreciation supports a ~$34k cash-out refi (75% LTV) — recoverable capital for the next deal without selling this one.
Negotiation context
- Only 8 days on market — expect competitive offers; lowballing is unlikely to land.
Risks & watch-outs
- Climate carrying-cost: major wind risk, 51% chance of damaging wind over 30y; extreme-heat days projected 7→22/yr by 2055 (HVAC capex compounding) — expect insurance premiums to compound above CPI over the hold.
Questions for the listing agent
- Built in 1965 — when were the roof, HVAC, electrical panel, plumbing, and water heater last replaced?
- Is there a deadline driving the sale (1031 exchange, divorce, estate, relocation)? That informs how much negotiation room exists.
- What's the average days-on-market for RENTAL listings here right now (not sales)? A rising rental-DOM trend means longer vacancies and softer asking-rent achievability than the comps imply.
- What's the recent tenant-quality profile in this submarket — average credit score on applications, eviction rate, late-payment / NSF rate, and stable-employment percentage? A property-management company in the area should have these aggregated.
- How much new for-sale + rental construction is in the pipeline within 1–3 miles? Heavy new supply typically softens prices + rents 12–24 months out; constrained supply supports both.
Investment metrics
- 1% rule
- 0.88% ✗
- Cap rate
- 7.41%
- Cash-on-cash
- 4.00%
- DSCR
- 1.18
- GRM
- 9.5
CMA / ARV
- ARV (on-the-fly)
- $206,664
- Comps found
- 11
Show comp detail 11 sales within ~0.75 mi
| Address | Dist | Beds/Ba | Sqft | Sold | Price | $/sf | Match |
|---|---|---|---|---|---|---|---|
| 706 NW 6th St NW | 0.39mi | 3/2.0 (-1) | 2,554 (-2%) | 5mo | $137,000 | $54 | 69 |
| 1402 N Acres Cir | 0.66mi | 4/2.0 | 2,733 (+4%) | 6mo | $249,999 | $91 | 56 |
| 810 Hill St | 0.24mi | 3/1.0 (-1) | 2,351 (-10%) | 13mo | $29,000 | $12 | 52 |
| 601 Browning Dr | 0.27mi | 3/2.0 (-1) | 2,225 (-15%) | 10mo | $130,000 | $58 | 49 |
| 104 Janice Dr Ext | 0.70mi | 3/2.5 (-1) | 2,590 (-1%) | 14mo | $299,000 | $115 | 47 |
| 1207 North Acres Cir | 0.72mi | 4/2.5 | 2,518 (-4%) | 15mo | $234,900 | $93 | 46 |
| 1200 North Acres Cir | 0.64mi | 4/2.5 | 2,963 (+13%) | 4mo | $399,900 | $135 | 42 |
| 702 N Acres Ln | 0.72mi | 4/3.0 | 2,454 (-6%) | 12mo | $194,900 | $79 | 42 |
| 704 8th St NW | 0.34mi | 3/2.0 (-1) | 2,286 (-13%) | 23mo | $165,000 | $72 | 39 |
| 1002 N Acres Ln | 0.74mi | 4/3.0 | 2,880 (+10%) | 13mo | $365,000 | $127 | 34 |
| 507 NW 12th St | 0.59mi | 3/2.0 (-1) | 2,249 (-14%) | 15mo | $164,900 | $73 | 32 |
Match score weights: distance 35% · size 25% · config 20% · recency 20%. Top-matched comps best support the ARV.
Projected returns pro-forma
3.57% appreciation · 3.0% rent growth · sell at horizon
- IRR
- 12.7%
- Equity multiple
- 1.75×
- Total profit
- $31,459
- Equity at exit
- $72,284
- IRR
- 14.3%
- Equity multiple
- 3.24×
- Total profit
- $93,941
- Equity at exit
- $115,315
Cash invested: $42,000 (down + closing). Projections, not guarantees.
Landlord ↔ Tenant lean methodology
- Overall (STATE)
- 90 Strongly Landlord-Friendly
- State Louisiana
- 90 Strongly Landlord-Friendly · R+12
- County
- — inherits STATE
- City
- — inherits STATE
ZIP-level market 71075
- Home prices YoY
- 4.1%
- Active inventory
- 44
- Price-to-rent
- 9.5×
Monthly cashflow live
- Estimated rent
- $1,313 medium interval (Pro) →
- Mortgage (P&I)
- −$787
- Tax from tax record
- −$48 /mo · $576/yr
- Insurance
- −$62
- HOA
- −$0
- Vacancy / Maint / Mgmt
- −$276
- Net cashflow
- $140
Break-even live
UW: 25.0% down · 7.5% · 30yr · 1.5% tax · 5.0% vac · 8.0% maint · 8.0% mgmt
Financing live
Cash to close
- Down payment
- $37,500
- Closing costs
- $4,500
- Reserves months
- —
- Total cash needed
- —
Loan-product check · same deal, 3 products live
Conventional
25% down · 7.5% · 30yr
- Down + closing
- —
- Monthly P&I
- —
- Monthly cashflow
- —
- DSCR
- —
- Eligible?
- —
Personal DTI + credit; lowest rate.
DSCR
20% down · 8.5% · 30yr
- Down + closing
- —
- Monthly P&I
- —
- Monthly cashflow
- —
- DSCR
- —
- Eligible?
- —
No personal income docs; deal must DSCR.
Hard money
10% down · 12.0% · 12mo
- Down + closing
- —
- Monthly P&I
- —
- Monthly cashflow
- —
- DSCR
- —
- Eligible?
- —
Short-term bridge; refi at stabilization.
Listing history 7 events
-
2026-06-18days on market $150,000 Active 8 DOM
-
2026-06-17days on market $150,000 Active 7 DOM
-
2026-06-16days on market $150,000 Active 6 DOM
-
2026-06-15days on market $150,000 Active 5 DOM
-
2026-06-14days on market $150,000 Active 3 DOM
-
2026-06-13remarks 699-char remark
-
2026-06-13$150,000 Active 2 DOM
ⓘ Source: listings_history table (triggers on properties + properties_extension) + one-shot
backfill from property_details.listing_events for pre-trigger history.
Tax reassessment forecast LA · Resets to sale price
- Current annual tax
- $576 · $48/mo
- Projected year-2 tax
- $825 · $69/mo
- Expected delta
- +$249/yr (+$21/mo · 43.2%)
ⓘ Screening estimate from a state-policy table — verify with the county assessor before closing.
Climate risk First Street
- Flood 1/10 Low FEMA zone X (unshaded) · 0% chance over 30 yrs
- Wildfire 4/10 Moderate
- Heat 7/10 Severe 7 d/yr ≥111°F today · 22 d/yr by 30 yrs out
- Wind 6/10 Major 51% chance of damaging wind over 30 yrs
- Air quality 1/10 Low 0 unhealthy d/yr today · 0 by 30 yrs out
Nearby sold comps map
Loading sold comps map…
Walkable amenities ~0.75 mi
Loading nearby amenities…
Taxation est. · year 1
- Rental income
- $15,752
- − Mortgage interest
- −$8,402
- − Property taxes
- −$576
- − Insurance
- −$750
- − Repairs & maintenance
- −$1,260
- − Management
- −$1,260
- − Depreciation
- −$4,364
- Taxable loss
- −$861
- Est. tax savings @ 24.0%
- +$207
- After-tax cash flow
- $1,885/yr
For passive investors: Depreciation is non-cash, so a rental often shows a tax loss while cash-flowing — sheltering income. Rental losses are passive: they offset passive income freely, and up to $25,000/yr can offset ordinary (W-2) income if you actively participate and your MAGI is under $100k (phasing out to $0 by $150k); unused losses carry forward. On sale, claimed depreciation is recaptured at up to 25%, and gains may owe capital-gains tax (a 1031 exchange can defer both). Figures are a year-1 estimate at your 24.0% rate — not tax advice; consult a CPA.
Schools (NCES district)
- District
- Webster Parish
- NCES district ID
- 2201890
- Math proficiency
- 17% ▼ -39.00%
- Reading proficiency
- 26% ▼ -38.00%
- Median HH income
- $33,011
- Composite
- 17.5/100
- National rank
- #9055
- State rank
- #67 of 98 in LA
Livability — Springhill
- Score
- 65/100
- State rank
- #139
- US rank
- #12517
Category grades
Schools grade is shown separately in the Schools card above.
Census & demographics
- Census place
- Springhill, LA
- Population (ZIP)
- 5,417
Population outlook (Webster County) Hauer SSP2
- Today (2025)
- 37,736 people
- By 2030
- 36,203 · -4.1%
- By 2040
- 32,988 · -12.6%
- By 2050
- 29,743 · -21.2%
- By 2075
- 22,346 · -40.8%
- By 2100
- 15,045 · -60.1%
Race, ethnicity, and origin ACS 2023
- Neighborhood character
- Diverse neighborhood (Simpson 0.56)
- Race & ethnicity
- White 56% Black 34% Hispanic / Latino 6% Two or more races 2% Native American 2%
- Hispanic origin (detail)
- Mexican 4%
- Common ancestry
- Iranian 4% Slovak 3% Lithuanian 2%
- Foreign-born
- 1% · Canada
- Languages at home
- 99% English-only · French/Haitian/Cajun 1% Spanish 1%
Political lean MEDSL · Webster
- 2024 margin
- Solid R (+36.5) · D 31.2% · R 67.7% · Other 1.1%
- 2008→2024 swing
- -10.2pp toward R · 2008: -26.3pp · 2024: -36.5pp
- All cycles
- 2024: R+36.5 2020: R+31.1 2016: R+29.1 2012: R+25.0 2008: R+26.3
Not yet ingested
- Civics
- —
Market trends
- HPI YoY
- ▲ 3.57%
- Current HPI
- 90.8938
- Rent YoY
- —
- Metro
- —
- State GDP YoY
- ▲ 3.29%
- F500 in state
- 10
Industry mix (Fortune 500 HQ in LA)
| Industry | F500 HQs | Revenue |
|---|---|---|
| Telecommunications | 2 | $23B |
|
||
| Utilities | 1 | $12B |
|
||
| Wholesale / Distribution | 1 | $5B |
|
||
| Advertising | 1 | $2B |
|
||
Price history
2 events — show timeline
- 2026-06-10 Listed $150,000 NTREIS
- 2004-08-20 Sold (Public Records) — Public Records
Property tax history
+2.4%/yrLatest (2024): $576 · +20.5% YoY. Source: county tax records.
Cash-flow waterfall
monthlySold comps — $/sqft
last 12 mo · ≤1 miLoading sold comps…