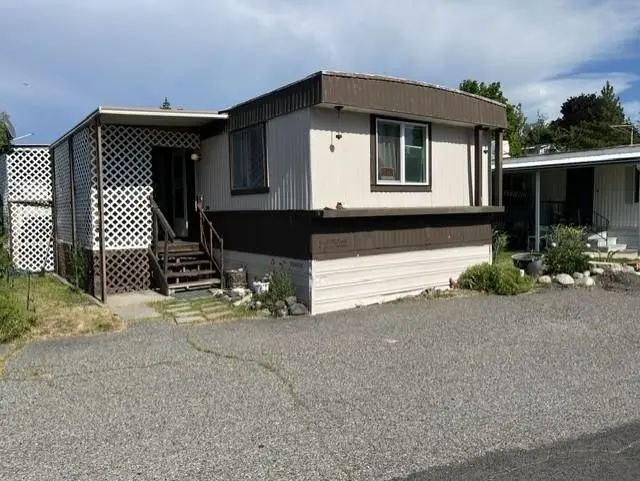
6300 E 2nd Ave #83 · Spokane Valley, WA
Flood risk 1/10 · Minimal
- FEMA flood zone
- X (unshaded)
- Chance of flooding over 30 yrs
- 0.0%
- Est. flood insurance / yr
- $507 – $1,088
Fire risk 6/10 · Moderate
- Est. fire insurance / yr
- $604 – $1,122
Heat risk 3/10 · Minor
- Hot days now (above 93°F)
- 7 days/yr
- Hot days in 30 yrs
- 15 days/yr
Wind risk 1/10 · Minimal
- Chance of severe wind over 30 yrs
- —
Air-quality risk 9/10 · Severe
- Unhealthy air days now
- 17 days/yr
- Unhealthy air days in 30 yrs
- 17 days/yr
Risk factors via First Street. Map © Google.
Why this score? — see what drove the B+ grade
The composite is a weighted blend of 9 inputs, each scored 0–100. Each bar is that input's sub-score; the figure is the points it added to the 100-point composite (weight × sub-score).
- Cash flow +30.0/30.0
- ARV discount +15.0/15.0
- 1% rule +10.0/10.0
- DSCR +10.0/10.0
- Schools +4.6/10.0
- Livability +4.2/5.0
- Rent growth +3.4/5.0
- Condition / age +2.5/5.0
- Appreciation +0.0/10.0
$36,000
🖨 Deal sheet 📄 Offer letter ✓ Due diligence
Listing remarks
This two-bedroom, two-bathroom manufactured home is situated in a peaceful 55+ community, offering easy access to the interstate and essential everyday conveniences. The lot rent is $515, which includes water, sewer, and garbage services. All appliances will remain with the home. Although it could use some tender loving care, this property presents a fantastic opportunity to own a home in a desirable location. With proximity to bus routes, shopping, dining, and outdoor recreational activities, this home truly checks all the boxes! The seller is willing to leave everything behind and is offering the property as-is.
Key facts
- 2 parking spots
- Built 1973
- Listed 15 days
Property features AI
Finance
- Financial info: Land lease: $515/month
- HOA & community: Has HOA; Association transfer fee paid by buyer; Located in a senior community (Valley Breeze)
Exterior
- Parking: 2-space carport; Slab parking
- Utilities: High-speed internet available (variable providers); Water/sewer/power: standard connections
- Home design: Manufactured home (Barrington); Single-story / manufactured house; Entry level: Main
- Construction: Steel frame construction; Flat roof; Block foundation; Skirted; Tie-downs
- Exterior features: Deck; Level lot; Views; Paved road frontage
Interior
- Kitchen: Refrigerator; Microwave
- Bedrooms: 2 bedrooms
- Heating & cooling: Natural gas heating; Electric heating; Window air conditioning units
- Interior features: Utility room; Grab bars throughout
- Laundry & utility: Washer; Dryer; Utility room
Neighborhood map
What this means for you Summary
Snapshot
- This is a 2-bed/2.0-bath manufactured listed at $36k.
Deal economics
- At list price, monthly cash flow is $875 ($11k/yr) — positive.
- The deal already cash-flows at list — no discount required.
- Meets the 1% rule at list price ($1k rent vs $36k).
- Recommended offer: $35k (1.5% below list) — sets the bar for market timing.
- Cap rate 35.5% vs local median 3.0% in Spokane Valley — top-decile yield for the area; either an underpriced asset or a hidden risk that comps aren't pricing in. Stress-test before assuming the spread holds.
Location & tenants
- Location reads 85/100 on livability (#31 in WA, #512 nationally) — a professional / high-income tenant draw. Strengths: amenities A+, commute A+, housing A+; Watch: crime D+.
- Spokane School District (urban): math 47% / reading 58% proficiency, ranked #136 of 291 in WA (top 47%) — acceptable for families but not a draw, mixed tenant base, ~2y average lease.
- Zoned schools: Ferris High School (1,631 students, 48% FRL) — zoned schools at 48% FRL track the district average.
- Market conditions: Rents rising (+3.5%/yr); 187 active listings in the ZIP; 10 comparable units currently listed for rent nearby; rentals at typical pace (median 24d on market — plan ~3-4 weeks tenant-placement turnaround); 3,608 units permitted in Spokane County in 2024 (1,792 in 5+ unit buildings).
Forward outlook
- Local home prices are declining (-3.0%/yr); year-one equity from $249 of loan paydown is wiped out by about $1k of value loss. Plan a longer hold.
- Spokane County population projected at +13% by 2050 — modest demand growth; plan on rents tracking national, not racing it.
- At projected returns (-3.0% appreciation + 3.5% rent growth), your $10k cash investment doubles in ~2 years — after that, you're playing with house money.
Negotiation context
- It's been on market 15 days — a 2% lower offer ($35k) is reasonable based on typical stale-listing flexibility.
- 2 sale attempts since 16y ago; this cycle's ask has dropped $3k (8%) from the opening price — seller is motivated, your offer sets the floor, not the list.
Risks & watch-outs
- Climate carrying-cost: major wildfire risk — expect insurance premiums to compound above CPI over the hold.
Questions for the listing agent
- Built in 1973 — when were the roof, HVAC, electrical panel, plumbing, and water heater last replaced?
- Is there a deadline driving the sale (1031 exchange, divorce, estate, relocation)? That informs how much negotiation room exists.
- Schools are B-rated — typically a magnet for longer-tenancy family renters. What's the average tenant stay here, and is there a school-zone premium baked into asking?
- Crime grade is D in this area — have there been break-ins, vandalism, or insurance claims at this property in the last 3 years? What carrier currently insures it and at what premium?
- What's the average days-on-market for RENTAL listings here right now (not sales)? A rising rental-DOM trend means longer vacancies and softer asking-rent achievability than the comps imply.
- What's the recent tenant-quality profile in this submarket — average credit score on applications, eviction rate, late-payment / NSF rate, and stable-employment percentage? A property-management company in the area should have these aggregated.
- How much new for-sale + rental construction is in the pipeline within 1–3 miles? Heavy new supply typically softens prices + rents 12–24 months out; constrained supply supports both.
Investment metrics
- 1% rule
- 3.84% ✓
- Cap rate
- 35.48%
- Cash-on-cash
- 104.22%
- DSCR
- 5.64
- GRM
- 2.2
CMA / ARV
- ARV (on-the-fly)
- $47,040
- Comps found
- 5
Show comp detail 5 sales within ~0.75 mi
| Address | Dist | Beds/Ba | Sqft | Sold | Price | $/sf | Match |
|---|---|---|---|---|---|---|---|
| 6300 E 2nd Ave #85 | 0.00mi | 3/2.0 (+1) | 1,040 (+6%) | 4mo | $50,000 | $48 | 81 |
| 6300 E 2nd Ave #98 | 0.00mi | 3/2.0 (+1) | 924 (-6%) | 13mo | $55,000 | $60 | 75 |
| 6300 E 2nd Ave Trlr 129 | 0.00mi | 2/1.0 | 952 (-3%) | 21mo | $25,450 | $27 | 74 |
| 6300 E 2nd Ave #126 | 0.00mi | 3/1.0 (+1) | 924 (-6%) | 12mo | $40,000 | $43 | 71 |
| 6821 E 7th Ave | 0.44mi | 2/2.0 | 900 (-8%) | 10mo | $120,000 | $133 | 58 |
Match score weights: distance 35% · size 25% · config 20% · recency 20%. Top-matched comps best support the ARV.
Projected returns pro-forma
-3.0% appreciation · 3.49% rent growth · sell at horizon
- IRR
- —
- Equity multiple
- 6.02×
- Total profit
- $50,611
- Equity at exit
- $5,368
- IRR
- —
- Equity multiple
- 12.78×
- Total profit
- $118,711
- Equity at exit
- $3,113
Cash invested: $10,080 (down + closing). Projections, not guarantees.
Landlord ↔ Tenant lean methodology
- Overall (STATE)
- 28 Tenant-Leaning
- State Washington
- 28 Tenant-Leaning · D+8
- County
- — inherits STATE
- City
- — inherits STATE
ZIP-level market 99212
- Rents YoY
- 3.5%
- Active inventory
- 187
- Price-to-rent
- 2.2×
Monthly cashflow live
- Estimated rent
- $1,382 high interval (Pro) →
- Mortgage (P&I)
- −$189
- Tax from tax record
- −$13 /mo · $151/yr
- Insurance
- −$15
- HOA
- −$0
- Vacancy / Maint / Mgmt
- −$290
- Net cashflow
- $875
Break-even live
UW: 25.0% down · 7.5% · 30yr · 1.5% tax · 5.0% vac · 8.0% maint · 8.0% mgmt
Financing live
Cash to close
- Down payment
- $9,000
- Closing costs
- $1,080
- Reserves months
- —
- Total cash needed
- —
Loan-product check · same deal, 3 products live
Conventional
25% down · 7.5% · 30yr
- Down + closing
- —
- Monthly P&I
- —
- Monthly cashflow
- —
- DSCR
- —
- Eligible?
- —
Personal DTI + credit; lowest rate.
DSCR
20% down · 8.5% · 30yr
- Down + closing
- —
- Monthly P&I
- —
- Monthly cashflow
- —
- DSCR
- —
- Eligible?
- —
No personal income docs; deal must DSCR.
Hard money
10% down · 12.0% · 12mo
- Down + closing
- —
- Monthly P&I
- —
- Monthly cashflow
- —
- DSCR
- —
- Eligible?
- —
Short-term bridge; refi at stabilization.
Rent comps 10 comps
| Address | Beds | Baths | Sqft | Rent | $/sqft | DOM | Units | Dist |
|---|---|---|---|---|---|---|---|---|
| 402 S Eastern Rd Spokane Valley, WA | 1.0–2.0 | 1.0 | 715 | $1,095 | $1.53 | 14d | 3 | 0.15mi |
| 6121 E 6th Ave Spokane Valley, WA | 1.0 | 1.0 | 585 | $1,150 | $1.97 | 23d | 1 | 0.20mi |
| 6020 E 4th Ave Spokane Valley, WA | 1.0–2.0 | 1.0–2.0 | 735 | $1,695 | $2.30 | 14d | 5 | 0.25mi |
| 6017 E 6th Ave Unit M104 Spokane Valley, WA | 2.0 | 1.0 | 777 | $1,600 | $2.06 | 14d | 1 | 0.30mi |
| 5004 E 1st Ave Spokane Valley, WA | 2.0 | 1.0 | 900 | $1,250 | $1.39 | 14d | 1 | 0.82mi |
| 225 S Dearborn Rd Unit 4 Spokane Valley, WA | 2.0 | 1.0 | 560 | $1,150 | $2.05 | 23d | 1 | 1.12mi |
| 4405 E 5th Ave Spokane Valley, WA | 2.0 | 1.0 | 650 | $1,175 | $1.81 | 14d | 2 | 1.17mi |
| 4405 E 5th Ave Unit 36 Spokane Valley, WA | 2.0 | 1.0 | 640 | $1,150 | $1.80 | 23d | 1 | 1.20mi |
| 916 N Ella Rd Apt 55 Spokane Valley, WA | 2.0 | 1.5 | 950 | $1,450 | $1.53 | 43d | 1 | 1.22mi |
| 916 N Ella Rd Unit 16 Spokane Valley, WA | 2.0 | 1.0 | 750 | $1,200 | $1.60 | 43d | 1 | 1.22mi |
Listing history 11 events
-
2026-06-18price $36,000 Active 15 DOM
-
2026-06-18days on market $39,000 Active 15 DOM
-
2026-06-17days on market $39,000 Active 14 DOM
-
2026-06-16days on market $39,000 Active 13 DOM
-
2026-06-15days on market $39,000 Active 12 DOM
-
2026-06-14days on market $39,000 Active 10 DOM
-
2026-06-10days on market $39,000 Active 7 DOM
-
2026-06-09days on market $39,000 Active 6 DOM
-
2026-06-08days on market $39,000 Active 5 DOM
-
2026-06-07remarks 621-char remark
-
2026-06-07$39,000 Active 4 DOM
ⓘ Source: listings_history table (triggers on properties + properties_extension) + one-shot
backfill from property_details.listing_events for pre-trigger history.
Tax reassessment forecast WA · Resets to sale price
- Current annual tax
- $151 · $13/mo
- Projected year-2 tax
- $353 · $29/mo
- Expected delta
- +$202/yr (+$17/mo · 134.0%)
ⓘ Screening estimate from a state-policy table — verify with the county assessor before closing.
Climate risk First Street
- Flood 1/10 Low FEMA zone X (unshaded) · 0% chance over 30 yrs
- Wildfire 6/10 Major
- Heat 3/10 Moderate 7 d/yr ≥93°F today · 15 d/yr by 30 yrs out
- Wind 1/10 Low
- Air quality 9/10 Extreme 17 unhealthy d/yr today · 17 by 30 yrs out
Nearby sold comps map
Loading sold comps map…
Walkable amenities ~0.75 mi
Loading nearby amenities…
Taxation est. · year 1
- Rental income
- $16,585
- − Mortgage interest
- −$2,017
- − Property taxes
- −$151
- − Insurance
- −$180
- − Repairs & maintenance
- −$1,327
- − Management
- −$1,327
- − Depreciation
- −$1,047
- Taxable income
- $10,536
- Est. tax owed @ 24.0%
- −$2,529
- After-tax cash flow
- $7,977/yr
For passive investors: Depreciation is non-cash, so a rental often shows a tax loss while cash-flowing — sheltering income. Rental losses are passive: they offset passive income freely, and up to $25,000/yr can offset ordinary (W-2) income if you actively participate and your MAGI is under $100k (phasing out to $0 by $150k); unused losses carry forward. On sale, claimed depreciation is recaptured at up to 25%, and gains may owe capital-gains tax (a 1031 exchange can defer both). Figures are a year-1 estimate at your 24.0% rate — not tax advice; consult a CPA.
Schools (NCES district)
- District
- Spokane School District
- NCES district ID
- 5308250
- Math proficiency
- 47% ▲ 1.00%
- Reading proficiency
- 58% ▲ 1.00%
- Median HH income
- $43,187
- Composite
- 46.1/100
- National rank
- #5477
- State rank
- #136 of 291 in WA
Livability — Spokane Valley
- Score
- 85/100
- State rank
- #31
- US rank
- #512
Category grades
Schools grade is shown separately in the Schools card above.
Census & demographics
- Census place
- Spokane Valley, WA
- County
- Spokane County · 496,401 people
- City population
- 129,511
- Metro
- Spokane-Spokane Valley, WA
- Population (ZIP)
- 21,707
- Household income
- $67,049
- Rent vs Own
- Severe rent burden
- 842.0
Population outlook (Spokane County) Hauer SSP2
- Today (2025)
- 531,314 people
- By 2030
- 549,278 · +3.4%
- By 2040
- 577,822 · +8.8%
- By 2050
- 598,188 · +12.6%
- By 2075
- 630,744 · +18.7%
- By 2100
- 622,360 · +17.1%
Race, ethnicity, and origin ACS 2023
- Neighborhood character
- Predominantly White (86%)
- Race & ethnicity
- White 86% Two or more races 8% Hispanic / Latino 6%
- Hispanic origin (detail)
- Mexican 4%
- Common ancestry
- Portuguese 4% Slovak 3% Lithuanian 3%
- Foreign-born
- 4% · Canada
- Languages at home
- 95% English-only · Russian/Polish/Slavic 3% Spanish 2%
Political lean MEDSL · Spokane
- 2024 margin
- Toss-up / Even · D 46.0% · R 51.0% · Other 3.0%
- 2008→2024 swing
- -3.8pp toward R · 2008: -1.1pp · 2024: -5.0pp
- All cycles
- 2024: R+5.0 2020: R+4.3 2016: R+8.3 2012: R+6.3 2008: R+1.1
Not yet ingested
- Civics
- —
Market trends
- HPI YoY
- ▼ -316.37%
- Current HPI
- 361.41
- Rent YoY
- ▲ 3.49%
- Metro
- Spokane-Spokane Valley, WA
- State GDP YoY
- ▲ 4.65%
- F500 in state
- 22
Industry mix (Fortune 500 HQ in WA)
| Industry | F500 HQs | Revenue |
|---|---|---|
| Retail | 2 | $269B |
|
||
| Technology / Retail | 1 | $638B |
|
||
| Technology | 1 | $245B |
|
||
| Telecommunications | 1 | $38B |
|
||
| Food / Beverage | 1 | $36B |
|
||
| Automotive / Trucks | 1 | $34B |
|
||
Price history
+136.4% since first listed3 events — show timeline
- 2026-06-03 Listed $39,000 SPOKANEMLS as Distributed by MLS Grid
- 2010-07-29 Listing Removed — SPOKANEMLS as Distributed by MLS Grid
- 2010-05-13 Listed $16,500 SPOKANEMLS as Distributed by MLS Grid
Property tax history
+13.8%/yrLatest (2026): $151 · +146.7% YoY. Source: county tax records.
Cash-flow waterfall
monthlySold comps — $/sqft
last 12 mo · ≤1 miLoading sold comps…