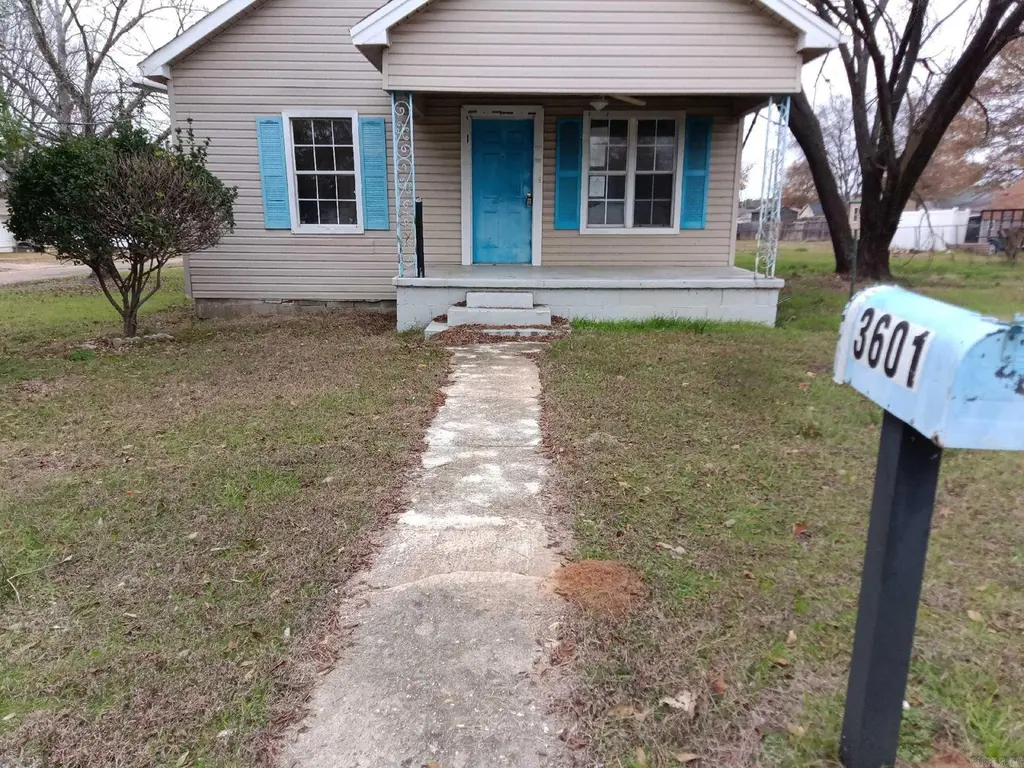
3601 Beech St · Texarkana, AR
Flood risk 1/10 · Minimal
- FEMA flood zone
- X (unshaded)
- Chance of flooding over 30 yrs
- 0.0%
- Est. flood insurance / yr
- $507 – $1,088
Fire risk 1/10 · Minimal
- Est. fire insurance / yr
- $1,499 – $2,785
Heat risk 7/10 · Major
- Hot days now (above 110°F)
- 7 days/yr
- Hot days in 30 yrs
- 22 days/yr
Wind risk 4/10 · Minor
- Chance of severe wind over 30 yrs
- 24.0%
Air-quality risk 2/10 · Minimal
- Unhealthy air days now
- 1 days/yr
- Unhealthy air days in 30 yrs
- 1 days/yr
Risk factors via First Street. Map © Google.
Why this score? — see what drove the B- grade
The composite is a weighted blend of 9 inputs, each scored 0–100. Each bar is that input's sub-score; the figure is the points it added to the 100-point composite (weight × sub-score).
- Cash flow +30.0/30.0
- 1% rule +10.0/10.0
- DSCR +10.0/10.0
- ARV discount +7.5/15.0
- Livability +3.2/5.0
- Rent growth +2.5/5.0
- Condition / age +2.5/5.0
- Schools +2.1/10.0
- Appreciation +0.0/10.0
$45,000
🖨 Deal sheet 📄 Offer letter ✓ Due diligence
Listing remarks MLS
Charming cottage situated on a corner lot! Upon entering through the front door, you will immediately notice the open concept living area that seamlessly combines with the formal dining space. The living room, dining area, and all three bedrooms feature exquisite small striped wood flooring. One of the bedrooms has been partially covered with linoleum squares; however, the wood floor is visible in the closet and in two other locations within the room. The kitchen offers ample cabinetry and includes a pantry located in the hallway. Adjacent to the kitchen is a spacious utility room, along with an additional bathroom. As you step down from the hallway, you'll find that the former garage has been transformed into two additional rooms. A carport has been added outside, directly in front of this area. Please note that the gas meter has been removed from the property, and the owner is uncertain about the condition of the electrical system. All offers submitted must include a pre-approval letter or proof of funds. The seller is open to considering seller financing, and the buyer will also need to sign a Non-Owner Occupant Addendum.
Key facts
- Pantry
- Ample cabinetry
- Formal dining space
Tags
Neighborhood map
What this means for you Summary
Snapshot
- This is a 3-bed/2.0-bath single-family listed at $45k.
Deal economics
- At list price, monthly cash flow is $627 ($8k/yr) — positive.
- The deal already cash-flows at list — no discount required.
- Meets the 1% rule at list price ($1k rent vs $45k).
- Cap rate 23.0% vs local median 4.5% in Texarkana — top-decile yield for the area; either an underpriced asset or a hidden risk that comps aren't pricing in. Stress-test before assuming the spread holds.
Location & tenants
- Location reads 64/100 on livability (#177 in AR) — a middle-class / working-renter tenant base. Strengths: cost of living A+, housing A+, health & safety A-; Watch: schools D, crime F, amenities F.
- Texarkana School District (suburban): math 27% / reading 24% proficiency, ranked #181 of 238 in AR (top 76%) — low school quality limits family demand, transient renter base, plan for 1-2y turnover; 64% free/reduced lunch — lower-income household profile, screen leases tightly.
- Market conditions: 273 active listings in the ZIP; 14 comparable units currently listed for rent nearby; rentals lingering (median 44d on market — plan ~5-8 weeks vacancy on turnover, expect pricing pressure); 100% of comp listings sitting > 30 days — soft ceiling on asking rent; 21 units permitted in Miller County in 2024 (0 in 5+ unit buildings).
- This rent runs 32% of the median local income ($47k/yr) — at the standard rent-burdened threshold; future hikes will face affordability resistance.
Forward outlook
- Local home prices are declining (-3.0%/yr); year-one equity from $311 of loan paydown is wiped out by about $1k of value loss. Plan a longer hold.
- Miller County population projected to shrink 7% by 2050 — rents likely to lag national; underwrite the cash flow, not the appreciation.
- At projected returns (-3.0% appreciation + 3.0% rent growth), your $13k cash investment doubles in ~2 years — after that, you're playing with house money.
Negotiation context
- Only 14 days on market — expect competitive offers; lowballing is unlikely to land.
- 4 sale attempts since 2y ago with the ask held roughly flat each time — persistent listings suggest the price (not the market) is what's stuck; bring a comps-based counter.
Risks & watch-outs
- Watch-outs: property tax is 3.0% of price; built in 1955 — expect roof / HVAC / electrical / plumbing capex.
- Climate carrying-cost: extreme-heat days projected 7→22/yr by 2055 (HVAC capex compounding) — expect insurance premiums to compound above CPI over the hold.
Questions for the listing agent
- Built in 1955 — when were the roof, HVAC, electrical panel, plumbing, and water heater last replaced?
- Property tax is high relative to price — has the assessment been appealed recently, and will the sale trigger a re-assessment?
- Is there a deadline driving the sale (1031 exchange, divorce, estate, relocation)? That informs how much negotiation room exists.
- Schools are D-rated, which usually means shorter tenancies and higher turnover. Who's the typical renter profile here, and what's been the actual vacancy rate?
- Crime grade is F in this area — have there been break-ins, vandalism, or insurance claims at this property in the last 3 years? What carrier currently insures it and at what premium?
- What's the average days-on-market for RENTAL listings here right now (not sales)? A rising rental-DOM trend means longer vacancies and softer asking-rent achievability than the comps imply.
- What's the recent tenant-quality profile in this submarket — average credit score on applications, eviction rate, late-payment / NSF rate, and stable-employment percentage? A property-management company in the area should have these aggregated.
- How much new for-sale + rental construction is in the pipeline within 1–3 miles? Heavy new supply typically softens prices + rents 12–24 months out; constrained supply supports both.
Investment metrics
- 1% rule
- 2.80% ✓
- Cap rate
- 23.00%
- Cash-on-cash
- 59.67%
- DSCR
- 3.66
- GRM
- 3.0
CMA / ARV
- ARV (median comp)
- $150,665
- List price
- $45,000
- Delta
- -70.13%
- Verdict
- UNDERPRICED
- Comps
- 20 within 1.0 mi
Show comp detail 6 sales within ~0.75 mi
| Address | Dist | Beds/Ba | Sqft | Sold | Price | $/sf | Match |
|---|---|---|---|---|---|---|---|
| 3303 Rice St | 0.29mi | 3/1.0 | 1,328 (+0%) | 24mo | $125,000 | $94 | 63 |
| 3508 Hickory St | 0.23mi | 3/1.0 | 1,130 (-15%) | 2mo | $163,000 | $144 | 59 |
| 406 E 36th St | 0.05mi | 3/2.0 | 1,504 (+13%) | 22mo | $167,000 | $111 | 57 |
| 914 E 33rd St | 0.52mi | 3/1.0 | 1,200 (-10%) | 3mo | $92,350 | $77 | 54 |
| 11 N Hermitage Dr | 0.74mi | 3/1.5 | 1,377 (+4%) | 6mo | $168,000 | $122 | 52 |
| 2818 Beech St | 0.51mi | 2/1.0 (-1) | 1,144 (-14%) | 3mo | $142,400 | $124 | 42 |
Match score weights: distance 35% · size 25% · config 20% · recency 20%. Top-matched comps best support the ARV.
Projected returns pro-forma
-3.0% appreciation · 3.0% rent growth · sell at horizon
- IRR
- 58.4%
- Equity multiple
- 3.59×
- Total profit
- $32,666
- Equity at exit
- $6,710
- IRR
- 63.2%
- Equity multiple
- 7.35×
- Total profit
- $80,047
- Equity at exit
- $3,891
Cash invested: $12,600 (down + closing). Projections, not guarantees.
Landlord ↔ Tenant lean methodology
- Overall (STATE)
- 92 Strongly Landlord-Friendly
- State Arkansas
- 92 Strongly Landlord-Friendly · R+14
- County
- — inherits STATE
- City
- — inherits STATE
ZIP-level market 71854
- Home prices YoY
- -16.9%
- Active inventory
- 273
- Price-to-rent
- 3.0×
Monthly cashflow live
- Estimated rent
- $1,258 high interval (Pro) →
- Mortgage (P&I)
- −$236
- Tax from tax record
- −$113 /mo · $1,350/yr
- Insurance
- −$19
- HOA
- −$0
- Vacancy / Maint / Mgmt
- −$264
- Net cashflow
- $627
Break-even live
UW: 25.0% down · 7.5% · 30yr · 1.5% tax · 5.0% vac · 8.0% maint · 8.0% mgmt
Financing live
Cash to close
- Down payment
- $11,250
- Closing costs
- $1,350
- Reserves months
- —
- Total cash needed
- —
Loan-product check · same deal, 3 products live
Conventional
25% down · 7.5% · 30yr
- Down + closing
- —
- Monthly P&I
- —
- Monthly cashflow
- —
- DSCR
- —
- Eligible?
- —
Personal DTI + credit; lowest rate.
DSCR
20% down · 8.5% · 30yr
- Down + closing
- —
- Monthly P&I
- —
- Monthly cashflow
- —
- DSCR
- —
- Eligible?
- —
No personal income docs; deal must DSCR.
Hard money
10% down · 12.0% · 12mo
- Down + closing
- —
- Monthly P&I
- —
- Monthly cashflow
- —
- DSCR
- —
- Eligible?
- —
Short-term bridge; refi at stabilization.
Rent comps 14 comps
| Address | Beds | Baths | Sqft | Rent | $/sqft | DOM | Units | Dist |
|---|---|---|---|---|---|---|---|---|
| 3801 Magnolia St Unit MG01 Texarkana, TX | 3.0 | 1.5 | 1200 | $1,000 | $0.83 | 43d | 1 | 0.42mi |
| 4101 Olive St Texarkana, TX | 2.0 | 1.0 | 1400 | $1,300 | $0.93 | 43d | 1 | 0.58mi |
| 1400 E 35th St Unit PS2-013 Texarkana, AR | 2.0 | 1.0 | 980 | $859 | $0.88 | 43d | 1 | 0.77mi |
| 1400 E 35th St Unit PS16-142 Texarkana, AR | 2.0 | 1.0 | 980 | $809 | $0.83 | 43d | 1 | 0.77mi |
| 1400 E 35th St Unit PS6-052 Texarkana, AR | 2.0 | 2.0 | 1025 | $899 | $0.88 | 43d | 1 | 0.77mi |
| 722 W 34th St Texarkana, TX | 2.0 | 1.0 | 1298 | $1,300 | $1.00 | 43d | 1 | 0.93mi |
| 4841 N Park Rd Texarkana, TX | 2.0 | 1.5 | 1260 | $1,100 | $0.87 | 43d | 1 | 0.94mi |
| 2101 Pecan St Texarkana, AR | 3.0 | 1.0 | 1453 | $1,125 | $0.77 | 43d | 1 | 1.04mi |
| 3302 Anthony Dr Texarkana, TX | 3.0 | 2.0 | 1726 | $850 | $0.49 | 43d | 1 | 1.07mi |
| 3514 Sabine Ave Texarkana, TX | 4.0 | 2.0 | 1600 | $1,845 | $1.15 | 43d | 1 | 1.15mi |
| 2301 Arkansas Blvd Texarkana, AR | 1.0–3.0 | 1.0–2.0 | 969 | $1,245 | $1.28 | 43d | 35 | 1.29mi |
| 2400 Brookridge Dr Texarkana, AR | 2.0–3.0 | 1.0–2.0 | 1000 | $1,095 | $1.09 | 43d | 3 | 1.29mi |
| 333 Links Dr Texarkana, AR | 1.0–2.0 | 1.0–2.0 | 790 | $960 | $1.21 | 43d | 1 | 1.34mi |
| 1504 Colorado St Texarkana, TX | 3.0 | 2.0 | 1298 | $1,595 | $1.23 | 43d | 1 | 1.35mi |
Listing history 25 events
-
2026-05-19historical
-
2026-05-11$45,000 Active 1142-char remark
Show marketing remark (1142 chars)
Charming cottage situated on a corner lot! Upon entering through the front door, you will immediately notice the open concept living area that seamlessly combines with the formal dining space. The living room, dining area, and all three bedrooms feature exquisite small striped wood flooring. One of the bedrooms has been partially covered with linoleum squares; however, the wood floor is visible in the closet and in two other locations within the room. The kitchen offers ample cabinetry and includes a pantry located in the hallway. Adjacent to the kitchen is a spacious utility room, along with an additional bathroom. As you step down from the hallway, you'll find that the former garage has been transformed into two additional rooms. A carport has been added outside, directly in front of this area. Please note that the gas meter has been removed from the property, and the owner is uncertain about the condition of the electrical system. All offers submitted must include a pre-approval letter or proof of funds. The seller is open to considering seller financing, and the buyer will also need to sign a Non-Owner Occupant Addendum.
-
2026-05-07price $45,000
-
2026-03-04price $52,500
-
2026-01-06$55,999 New Listing
-
2025-11-01historical
-
2025-10-22price $64,900
-
2025-10-22price $64,900
-
2025-08-14$69,900 New Listing
-
2025-04-24historical
-
2025-04-10price $60,800
-
2025-03-10price $61,200
-
2025-02-21price $61,600
-
2025-02-06price $62,000
-
2025-01-22price $63,900
-
2025-01-04price $66,500
-
2024-12-20price $69,100
-
2024-12-05price $72,400
-
2024-11-19price $76,600
-
2024-11-04price $86,100
-
2024-10-18price $102,800
-
2024-10-04$132,500 New Listing
-
2005-02-28soldstatus $43,213
-
2000-11-27soldstatus $52,000
-
1980-03-04soldstatus $27,000
ⓘ Source: listings_history table (triggers on properties + properties_extension) + one-shot
backfill from property_details.listing_events for pre-trigger history.
Tax reassessment forecast AR · Resets to sale price
- Current annual tax
- $1,350 · $113/mo
- Projected year-2 tax
- $1,350 · $113/mo
- Expected delta
- $0/yr ($0/mo · 0.0%)
ⓘ Screening estimate from a state-policy table — verify with the county assessor before closing.
Climate risk First Street
- Flood 1/10 Low FEMA zone X (unshaded) · 0% chance over 30 yrs
- Wildfire 1/10 Low
- Heat 7/10 Severe 7 d/yr ≥110°F today · 22 d/yr by 30 yrs out
- Wind 4/10 Moderate 24% chance of damaging wind over 30 yrs
- Air quality 2/10 Low 1 unhealthy d/yr today · 1 by 30 yrs out
Nearby sold comps map
Loading sold comps map…
Walkable amenities ~0.75 mi
Loading nearby amenities…
Taxation est. · year 1
- Rental income
- $15,095
- − Mortgage interest
- −$2,521
- − Property taxes
- −$1,350
- − Insurance
- −$225
- − Repairs & maintenance
- −$1,208
- − Management
- −$1,208
- − Depreciation
- −$1,309
- Taxable income
- $7,275
- Est. tax owed @ 24.0%
- −$1,746
- After-tax cash flow
- $5,772/yr
For passive investors: Depreciation is non-cash, so a rental often shows a tax loss while cash-flowing — sheltering income. Rental losses are passive: they offset passive income freely, and up to $25,000/yr can offset ordinary (W-2) income if you actively participate and your MAGI is under $100k (phasing out to $0 by $150k); unused losses carry forward. On sale, claimed depreciation is recaptured at up to 25%, and gains may owe capital-gains tax (a 1031 exchange can defer both). Figures are a year-1 estimate at your 24.0% rate — not tax advice; consult a CPA.
Schools (NCES district)
- District
- Texarkana School District
- NCES district ID
- 0513110
- Math proficiency
- 27% ▼ -12.00%
- Reading proficiency
- 24% ▼ -9.00%
- Median HH income
- $39,320
- Composite
- 21.47/100
- National rank
- #8332
- State rank
- #181 of 238 in AR
Livability — Texarkana
- Score
- 64/100
- State rank
- #177
- US rank
- #14514
Category grades
Schools grade is shown separately in the Schools card above.
Census & demographics
- Census place
- Texarkana, AR
- County
- Miller County · 35,720 people
- City population
- 35,720
- Metro
- Texarkana, TX-AR
- Population (ZIP)
- 35,720
- Household income
- $46,878
- Rent vs Own
- Severe rent burden
- 1388.0
Population outlook (Miller County) Hauer SSP2
- Today (2025)
- 44,197 people
- By 2030
- 43,844 · -0.8%
- By 2040
- 42,680 · -3.4%
- By 2050
- 41,024 · -7.2%
- By 2075
- 35,685 · -19.3%
- By 2100
- 28,325 · -35.9%
Race, ethnicity, and origin ACS 2023
- Neighborhood character
- Majority White (62%)
- Race & ethnicity
- White 62% Black 30% Hispanic / Latino 4% Two or more races 3%
- Common ancestry
- Lithuanian 1% Slovak 1%
- Foreign-born
- 2% · Canada
- Languages at home
- 98% English-only · Spanish 2%
Political lean MEDSL · Miller
- 2024 margin
- Solid R (+51.1) · D 23.9% · R 74.9% · Other 1.2%
- 2008→2024 swing
- -17.6pp toward R · 2008: -33.5pp · 2024: -51.1pp
- All cycles
- 2024: R+51.1 2020: R+46.4 2016: R+43.8 2012: R+39.8 2008: R+33.5
Not yet ingested
- Civics
- —
Market trends
- HPI YoY
- ▼ -40.00%
- Current HPI
- 196.7615
- Rent YoY
- —
- Metro
- Texarkana, TX-AR
- State GDP YoY
- ▲ 3.80%
- F500 in state
- 10
Industry mix (Fortune 500 HQ in AR)
| Industry | F500 HQs | Revenue |
|---|---|---|
| Retail | 1 | $681B |
|
||
| Food / Agriculture | 1 | $53B |
|
||
| Retail / Energy | 1 | $22B |
|
||
| Transportation / Logistics | 1 | $12B |
|
||
| Energy | 1 | $4B |
|
||
Price history
+66.7% since first listed25 events — show timeline
- 2026-05-19 Listing Removed — CARMLS
- 2026-05-11 Listed $45,000 TBOR
- 2026-05-07 Price Changed $45,000 CARMLS
- 2026-03-04 Price Changed $52,500 CARMLS
- 2026-01-06 Listed $55,999 CARMLS
- 2025-11-01 Listing Removed — CARMLS
- 2025-10-22 Price Changed $64,900 CARMLS
- 2025-10-22 Price Changed $64,900 HSBOR
- 2025-08-14 Listed $69,900 CARMLS
- 2025-04-24 Listing Removed — CARMLS
- 2025-04-10 Price Changed $60,800 CARMLS
- 2025-03-10 Price Changed $61,200 CARMLS
- 2025-02-21 Price Changed $61,600 CARMLS
- 2025-02-06 Price Changed $62,000 CARMLS
- 2025-01-22 Price Changed $63,900 CARMLS
- 2025-01-04 Price Changed $66,500 CARMLS
- 2024-12-20 Price Changed $69,100 CARMLS
- 2024-12-05 Price Changed $72,400 CARMLS
- 2024-11-19 Price Changed $76,600 CARMLS
- 2024-11-04 Price Changed $86,100 CARMLS
- 2024-10-18 Price Changed $102,800 CARMLS
- 2024-10-04 Listed $132,500 CARMLS
- 2005-02-28 Sold (Public Records) $43,213 Public Records
- 2000-11-27 Sold (Public Records) $52,000 Public Records
- 1980-03-04 Sold (Public Records) $27,000 Public Records
Property tax history
+18.6%/yrLatest (2025): $1,350 · +263.0% YoY. Source: county tax records.
Cash-flow waterfall
monthlySold comps — $/sqft
last 12 mo · ≤1 miLoading sold comps…