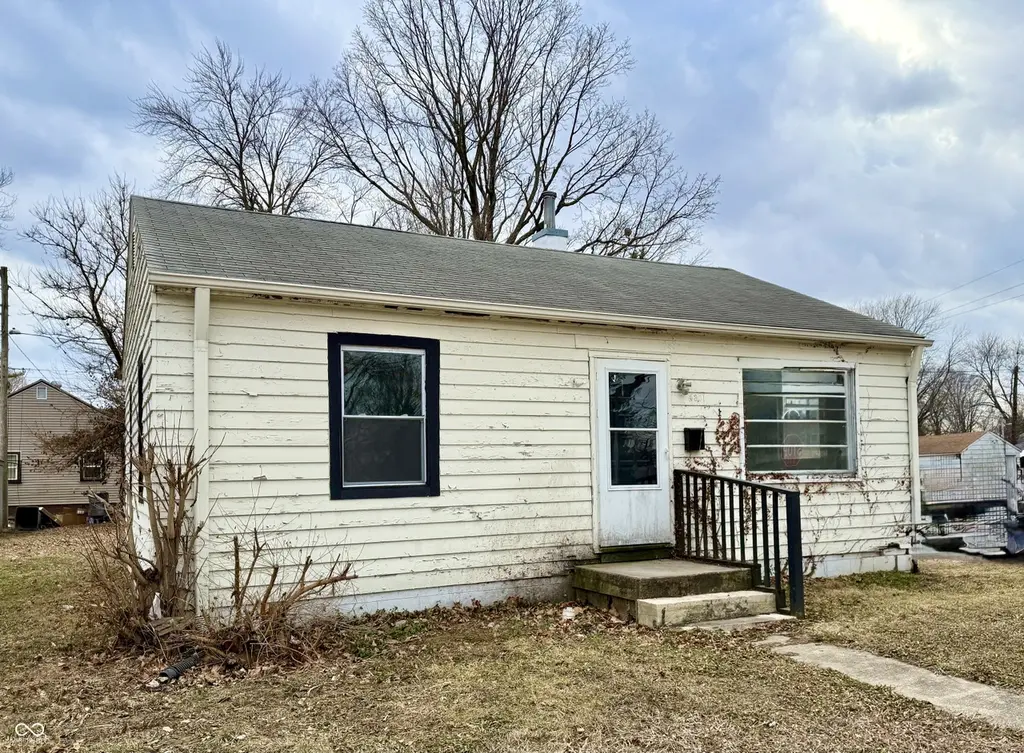
4301 E 21st St · Indianapolis city (balance), IN
Flood risk 1/10 · Minimal
- FEMA flood zone
- X (unshaded)
- Chance of flooding over 30 yrs
- 0.0%
- Est. flood insurance / yr
- $507 – $1,088
Fire risk 1/10 · Minimal
- Est. fire insurance / yr
- $717 – $1,331
Heat risk 3/10 · Minor
- Hot days now (above 101°F)
- 7 days/yr
- Hot days in 30 yrs
- 18 days/yr
Wind risk 2/10 · Minimal
- Chance of severe wind over 30 yrs
- 0.0%
Air-quality risk 4/10 · Minor
- Unhealthy air days now
- 5 days/yr
- Unhealthy air days in 30 yrs
- 7 days/yr
Risk factors via First Street. Map © Google.
Why this score? — see what drove the B grade
The composite is a weighted blend of 9 inputs, each scored 0–100. Each bar is that input's sub-score; the figure is the points it added to the 100-point composite (weight × sub-score).
- Cash flow +30.0/30.0
- ARV discount +15.0/15.0
- 1% rule +10.0/10.0
- DSCR +10.0/10.0
- Rent growth +2.7/5.0
- Livability +2.5/5.0
- Condition / age +2.5/5.0
- Schools +1.4/10.0
- Appreciation +0.0/10.0
$62,900
🖨 Deal sheet 📄 Offer letter ✓ Due diligence
Listing remarks MLS
Attention all visionaries! This home is ready to become your next project. With your trained eye and your masterful touch, this home will be represented in the most remarkable of ways. With a corner lot, large yard, and ample-sized bedrooms, you can't afford to miss this one- it's standing ready for you.
Key facts
- Large yard
- Corner lot
- 5,793 sq ft lot
Tags
Neighborhood map
What this means for you Summary
Snapshot
- This is a 1-bed/1.0-bath single-family listed at $63k.
Deal economics
- At list price, monthly cash flow is $266 ($3k/yr) — positive.
- The deal already cash-flows at list — no discount required.
- Meets the 1% rule at list price ($972 rent vs $63k).
- Recommended offer: $57k (9.0% below list) — sets the bar for market timing.
- Cap rate 11.4% vs local median 4.4% in Indianapolis city (balance) — top-decile yield for the area; either an underpriced asset or a hidden risk that comps aren't pricing in. Stress-test before assuming the spread holds.
Location & tenants
- Location reads: area grade B — affects rentability + tenant quality, not the cash-flow math above.
- Indianapolis Public Schools (urban): math 14% / reading 20% proficiency, ranked #286 of 301 in IN (top 95%) — low school quality limits family demand, transient renter base, plan for 1-2y turnover; 77% free/reduced lunch — lower-income household profile, screen leases tightly.
- Market conditions: Rents flat; 334 active listings in the ZIP; 40 comparable units currently listed for rent nearby; rentals at typical pace (median 24d on market — plan ~3-4 weeks tenant-placement turnaround); lower-income renter base — watch delinquency; 1,906 units permitted in Marion County in 2024 (621 in 5+ unit buildings).
- This rent runs 31% of the median local income ($38k/yr) — at the standard rent-burdened threshold; future hikes will face affordability resistance.
Forward outlook
- Local home prices are declining (-3.0%/yr); year-one equity from $435 of loan paydown is wiped out by about $2k of value loss. Plan a longer hold.
- Marion County population projected at +18% by 2050 — long-run rental-demand tailwind backs the buy-and-hold thesis.
- At projected returns (-3.0% appreciation + 0.8% rent growth), your $18k cash investment doubles in ~9 years — after that, you're playing with house money.
Negotiation context
- It's been on market 119 days — a 9% lower offer ($57k) is reasonable based on typical stale-listing flexibility.
- 2 sale attempts; this cycle's ask has dropped $7k (10%) from the opening price — seller is motivated, your offer sets the floor, not the list.
Risks & watch-outs
- Watch-outs: property tax is 2.8% of price; built in 1951 — expect roof / HVAC / electrical / plumbing capex.
Questions for the listing agent
- It's been on market 119 days. Have you received any prior offers? Is the seller open to a 9% concession, seller financing, or rate buy-down credit?
- Built in 1951 — when were the roof, HVAC, electrical panel, plumbing, and water heater last replaced?
- Property tax is high relative to price — has the assessment been appealed recently, and will the sale trigger a re-assessment?
- Why hasn't it sold? Are there any deal-killer items the seller is aware of (foundation, flood, title, zoning, code violations)?
- Is there a deadline driving the sale (1031 exchange, divorce, estate, relocation)? That informs how much negotiation room exists.
- What's the average days-on-market for RENTAL listings here right now (not sales)? A rising rental-DOM trend means longer vacancies and softer asking-rent achievability than the comps imply.
- What's the recent tenant-quality profile in this submarket — average credit score on applications, eviction rate, late-payment / NSF rate, and stable-employment percentage? A property-management company in the area should have these aggregated.
- How much new for-sale + rental construction is in the pipeline within 1–3 miles? Heavy new supply typically softens prices + rents 12–24 months out; constrained supply supports both.
Investment metrics
- 1% rule
- 1.54% ✓
- Cap rate
- 11.36%
- Cash-on-cash
- 18.10%
- DSCR
- 1.81
- GRM
- 5.4
CMA / ARV
- ARV (median comp)
- $96,104
- List price
- $62,900
- Delta
- -34.55%
- Verdict
- UNDERPRICED
- Comps
- 20 within 1.0 mi
Show comp detail 10 sales within ~0.75 mi
| Address | Dist | Beds/Ba | Sqft | Sold | Price | $/sf | Match |
|---|---|---|---|---|---|---|---|
| 2135 Wallace Ave | 0.36mi | 2/1.0 (+1) | 864 (0%) | 15mo | $159,000 | $184 | 66 |
| 2203 N Drexel Ave | 0.31mi | 2/1.0 (+1) | 835 (-3%) | 14mo | $30,000 | $36 | 63 |
| 1718 N Euclid Ave | 0.38mi | 2/1.0 (+1) | 840 (-3%) | 16mo | $87,500 | $104 | 59 |
| 2363 N Gale St | 0.66mi | 2/1.0 (+1) | 866 (+0%) | 10mo | $60,000 | $69 | 55 |
| 4910 East 21st St | 0.43mi | 2/1.0 (+1) | 920 (+6%) | 13mo | $155,000 | $168 | 53 |
| 1409 N Denny St | 0.75mi | 1/1.0 | 858 (-1%) | 14mo | $65,000 | $76 | 52 |
| 1536 N Sherman Dr | 0.66mi | 2/1.0 (+1) | 816 (-6%) | 7mo | $55,000 | $67 | 49 |
| 1902 N Euclid Ave | 0.23mi | 2/1.0 (+1) | 768 (-11%) | 21mo | $119,000 | $155 | 48 |
| 4733 E 18th St | 0.50mi | 2/1.0 (+1) | 748 (-13%) | 10mo | $100,000 | $134 | 41 |
| 1705 Kildare Ave | 0.63mi | 2/1.0 (+1) | 796 (-8%) | 21mo | $146,500 | $184 | 35 |
Match score weights: distance 35% · size 25% · config 20% · recency 20%. Top-matched comps best support the ARV.
Projected returns pro-forma
-3.0% appreciation · 0.81% rent growth · sell at horizon
- IRR
- 7.0%
- Equity multiple
- 1.27×
- Total profit
- $4,692
- Equity at exit
- $9,379
- IRR
- 14.2%
- Equity multiple
- 2.01×
- Total profit
- $17,876
- Equity at exit
- $5,438
Cash invested: $17,612 (down + closing). Projections, not guarantees.
Landlord ↔ Tenant lean methodology
- Overall (STATE)
- 90 Strongly Landlord-Friendly
- State Indiana
- 90 Strongly Landlord-Friendly · R+11
- County
- — inherits STATE
- City
- — inherits STATE
ZIP-level market 46218
- Home prices YoY
- -17.1%
- Rents YoY
- 0.8%
- Active inventory
- 334
- Price-to-rent
- 5.4×
Monthly cashflow live
- Estimated rent
- $972 high interval (Pro) →
- Mortgage (P&I)
- −$330
- Tax from tax record
- −$146 /mo · $1,751/yr
- Insurance
- −$26
- HOA
- −$0
- Vacancy / Maint / Mgmt
- −$204
- Net cashflow
- $266
Break-even live
UW: 25.0% down · 7.5% · 30yr · 1.5% tax · 5.0% vac · 8.0% maint · 8.0% mgmt
Financing live
Cash to close
- Down payment
- $15,725
- Closing costs
- $1,887
- Reserves months
- —
- Total cash needed
- —
Loan-product check · same deal, 3 products live
Conventional
25% down · 7.5% · 30yr
- Down + closing
- —
- Monthly P&I
- —
- Monthly cashflow
- —
- DSCR
- —
- Eligible?
- —
Personal DTI + credit; lowest rate.
DSCR
20% down · 8.5% · 30yr
- Down + closing
- —
- Monthly P&I
- —
- Monthly cashflow
- —
- DSCR
- —
- Eligible?
- —
No personal income docs; deal must DSCR.
Hard money
10% down · 12.0% · 12mo
- Down + closing
- —
- Monthly P&I
- —
- Monthly cashflow
- —
- DSCR
- —
- Eligible?
- —
Short-term bridge; refi at stabilization.
Rent comps 40 comps
| Address | Beds | Baths | Sqft | Rent | $/sqft | DOM | Units | Dist |
|---|---|---|---|---|---|---|---|---|
| 2030 N Colorado Ave Indianapolis, IN | 2.0 | 1.0 | 728 | $1,150 | $1.58 | 23d | 1 | 0.05mi |
| 1951 N Bosart Ave Indianapolis, IN | 2.0 | 1.0 | 728 | $1,000 | $1.37 | 4d | 1 | 0.34mi |
| 1531 N Grant Ave Indianapolis, IN | 1.0 | 1.0 | 611 | $875 | $1.43 | 23d | 1 | 0.55mi |
| 1512 N Gladstone Ave Unit 1510 1510 Indianapolis, IN | 1.0 | 1.0 | 570 | $830 | $1.46 | 14d | 1 | 0.57mi |
| 1510 N Gladstone Ave Indianapolis, IN | 1.0 | 1.0 | 570 | $765 | $1.34 | 43d | 1 | 0.57mi |
| 1518 N Chester Ave Indianapolis, IN | 2.0 | 1.0 | 672 | $700 | $1.04 | 7d | 1 | 0.58mi |
| 1509 N Chester Ave Indianapolis, IN | 2.0 | 1.0 | 950 | $1,100 | $1.16 | 21d | 1 | 0.59mi |
| 1506 N Grant Ave Indianapolis, IN | 2.0 | 1.0 | 780 | $1,150 | $1.47 | 14d | 1 | 0.60mi |
| 1824 N Riley Ave Indianapolis, IN | 2.0 | 1.0 | 720 | $1,150 | $1.60 | 43d | 1 | 0.61mi |
| 1450 N Gladstone Ave Indianapolis, IN | 1.0 | 1.0 | 588 | $799 | $1.36 | 43d | 1 | 0.62mi |
| 3709 Brookside Parkway South Dr Indianapolis, IN | 1.0 | 1.0 | 742 | $825 | $1.11 | 23d | 1 | 0.65mi |
| 1532 N Sherman Dr Unit 1530 Sherman Indianapolis, IN | 1.0 | 1.0 | 768 | $550 | $0.72 | 2d | 1 | 0.65mi |
| 1432 N Colorado Ave Indianapolis, IN | 1.0 | 1.0 | 584 | $875 | $1.50 | 23d | 1 | 0.67mi |
| 3617 Brookside Parkway South Dr Indianapolis, IN | 2.0 | 1.0 | 800 | $999 | $1.25 | 23d | 1 | 0.67mi |
| 1421 N Colorado Ave Indianapolis, IN | 2.0 | 1.0 | 983 | $1,225 | $1.25 | 23d | 1 | 0.68mi |
| 3601 Brookside Parkway South Dr Indianapolis, IN | 2.0 | 1.0 | 1025 | $995 | $0.97 | 43d | 1 | 0.69mi |
| 3601 Brookside Parkway South Dr Indianapolis, IN | 2.0 | 1.0 | 1025 | $995 | $0.97 | 23d | 1 | 0.69mi |
| 5119 E 21st St Indianapolis, IN | 2.0 | 1.0 | 816 | $1,199 | $1.47 | 43d | 1 | 0.72mi |
| 1417 N Denny St Indianapolis, IN | 2.0 | 1.0 | 1000 | $1,125 | $1.12 | 23d | 1 | 0.73mi |
| 1327 N Chester Ave Indianapolis, IN | 1.0 | 1.0 | 600 | $795 | $1.32 | 14d | 1 | 0.76mi |
| 1306 N Chester Ave Indianapolis, IN | 1.0 | 1.0 | 600 | $800 | $1.33 | 20d | 1 | 0.81mi |
| 1421 N Olney St Indianapolis, IN | 2.0 | 1.0 | 1064 | $975 | $0.92 | 10d | 1 | 0.83mi |
| 1505 N Tuxedo St Unit 1507 Indianapolis, IN | 2.0 | 1.0 | 1000 | $1,100 | $1.10 | 43d | 1 | 0.86mi |
| 2422 Adams St Unit 2 Indianapolis, IN | 1.0 | 1.0 | 700 | $850 | $1.21 | 43d | 1 | 0.86mi |
| 1358 N Gale St Indianapolis, IN | 1.0 | 1.0 | 550 | $890 | $1.62 | 16d | 1 | 0.87mi |
| 5242 E 20th Pl Indianapolis, IN | 2.0 | 1.0 | 720 | $1,050 | $1.46 | 7d | 1 | 0.91mi |
| 1354 N Olney St Unit 1356 Indianapolis, IN | 1.0 | 1.0 | 765 | $775 | $1.01 | 43d | 1 | 0.91mi |
| 2722 N Olney St Indianapolis, IN | 2.0 | 1.0 | 650 | $795 | $1.22 | 43d | 1 | 0.92mi |
| 1301 N Olney St Unit 1303 Indianapolis, IN | 2.0 | 1.0 | 750 | $1,100 | $1.47 | 43d | 1 | 0.97mi |
| 1931 N Oxford St Indianapolis, IN | 1.0 | 1.0 | 616 | $875 | $1.42 | 4d | 1 | 0.98mi |
| 5322 E 19th Pl Indianapolis, IN | 2.0 | 1.0 | 720 | $945 | $1.31 | 43d | 1 | 1.00mi |
| 3058 Brookside Parkway North Dr Indianapolis, IN | 1.0 | 1.0 | 700 | $875 | $1.25 | 12d | 1 | 1.01mi |
| 2449 Wheeler St Indianapolis, IN | 1.0 | 1.0 | 600 | $950 | $1.58 | 23d | 1 | 1.03mi |
| 4615 E 30th St Indianapolis, IN | 2.0 | 1.0 | 660 | $1,100 | $1.67 | 23d | 1 | 1.04mi |
| 2841 E 19th St Indianapolis, IN | 2.0 | 1.0 | 812 | $850 | $1.05 | 4d | 1 | 1.05mi |
| 1106 N Gale St Unit 1 Indianapolis, IN | 2.0 | 1.0 | 750 | $895 | $1.19 | 43d | 1 | 1.06mi |
| 953 N Linwood Ave Indianapolis, IN | 2.0 | 1.0 | 960 | $1,325 | $1.38 | 43d | 1 | 1.08mi |
| 2827 E 18th St Indianapolis, IN | 2.0 | 1.0 | 726 | $1,300 | $1.79 | 23d | 1 | 1.09mi |
| 3011 Oxford Ln Indianapolis, IN | 1.0 | 1.0 | 640 | $800 | $1.25 | 43d | 1 | 1.10mi |
| 896 N Gladstone Ave Indianapolis, IN | 1.0 | 1.0 | 580 | $775 | $1.34 | 43d | 1 | 1.11mi |
Listing history 4 events
-
2026-04-21status Active 305-char remark
Show marketing remark (305 chars)
Attention all visionaries! This home is ready to become your next project. With your trained eye and your masterful touch, this home will be represented in the most remarkable of ways. With a corner lot, large yard, and ample-sized bedrooms, you can't afford to miss this one- it's standing ready for you.
-
2026-04-19historical 305-char remark
Show marketing remark (305 chars)
Attention all visionaries! This home is ready to become your next project. With your trained eye and your masterful touch, this home will be represented in the most remarkable of ways. With a corner lot, large yard, and ample-sized bedrooms, you can't afford to miss this one- it's standing ready for you.
-
2026-03-17price $62,900 305-char remark
Show marketing remark (305 chars)
Attention all visionaries! This home is ready to become your next project. With your trained eye and your masterful touch, this home will be represented in the most remarkable of ways. With a corner lot, large yard, and ample-sized bedrooms, you can't afford to miss this one- it's standing ready for you.
-
2026-01-20$70,000 Active 305-char remark
Show marketing remark (305 chars)
Attention all visionaries! This home is ready to become your next project. With your trained eye and your masterful touch, this home will be represented in the most remarkable of ways. With a corner lot, large yard, and ample-sized bedrooms, you can't afford to miss this one- it's standing ready for you.
ⓘ Source: listings_history table (triggers on properties + properties_extension) + one-shot
backfill from property_details.listing_events for pre-trigger history.
Tax reassessment forecast IN · Partial reset (capped growth)
- Current annual tax
- $1,751 · $146/mo
- Projected year-2 tax
- $1,751 · $146/mo
- Expected delta
- $0/yr ($0/mo · 0.0%)
ⓘ Screening estimate from a state-policy table — verify with the county assessor before closing.
Climate risk First Street
- Flood 1/10 Low FEMA zone X (unshaded) · 0% chance over 30 yrs
- Wildfire 1/10 Low
- Heat 3/10 Moderate 7 d/yr ≥101°F today · 18 d/yr by 30 yrs out
- Wind 2/10 Low 0% chance of damaging wind over 30 yrs
- Air quality 4/10 Moderate 5 unhealthy d/yr today · 7 by 30 yrs out
Nearby sold comps map
Loading sold comps map…
Walkable amenities ~0.75 mi
Loading nearby amenities…
Taxation est. · year 1
- Rental income
- $11,661
- − Mortgage interest
- −$3,523
- − Property taxes
- −$1,751
- − Insurance
- −$314
- − Repairs & maintenance
- −$933
- − Management
- −$933
- − Depreciation
- −$1,830
- Taxable income
- $2,377
- Est. tax owed @ 24.0%
- −$570
- After-tax cash flow
- $2,618/yr
For passive investors: Depreciation is non-cash, so a rental often shows a tax loss while cash-flowing — sheltering income. Rental losses are passive: they offset passive income freely, and up to $25,000/yr can offset ordinary (W-2) income if you actively participate and your MAGI is under $100k (phasing out to $0 by $150k); unused losses carry forward. On sale, claimed depreciation is recaptured at up to 25%, and gains may owe capital-gains tax (a 1031 exchange can defer both). Figures are a year-1 estimate at your 24.0% rate — not tax advice; consult a CPA.
Schools (NCES district)
- District
- Indianapolis Public Schools
- NCES district ID
- 1804770
- Math proficiency
- 14% ▼ -7.00%
- Reading proficiency
- 20% ▼ -3.00%
- Median HH income
- $32,034
- Composite
- 13.69/100
- National rank
- #9499
- State rank
- #286 of 301 in IN
Livability — Indianapolis city (balance)
No livability data for this city. (Only ~50 U.S. cities are tracked.)
Census & demographics
- Census place
- Indianapolis city (balance), IN
- County
- Marion County · 998,460 people
- City population
- 881,119
- Metro
- Indianapolis-Carmel-Anderson, IN
- Population (ZIP)
- 29,360
- Household income
- $38,063
- Rent vs Own
- Severe rent burden
- 2340.0
Population outlook (Marion County) Hauer SSP2
- Today (2025)
- 1,025,572 people
- By 2030
- 1,065,727 · +3.9%
- By 2040
- 1,141,577 · +11.3%
- By 2050
- 1,208,920 · +17.9%
- By 2075
- 1,367,288 · +33.3%
- By 2100
- 1,438,201 · +40.2%
Race, ethnicity, and origin ACS 2023
- Neighborhood character
- Predominantly Black (68%)
- Race & ethnicity
- Black 68% White 18% Hispanic / Latino 9% Two or more races 6%
- Hispanic origin (detail)
- Mexican 6%
- Common ancestry
- Romanian 1%
- Foreign-born
- 5% · Canada, Philippines
- Languages at home
- 92% English-only · Spanish 7%
Political lean MEDSL · Marion
- 2024 margin
- Strong D (+27.7) · D 63.0% · R 35.3% · Other 1.7%
- 2008→2024 swing
- -0.7pp no change · 2008: 28.4pp · 2024: 27.7pp
- All cycles
- 2024: D+27.7 2020: D+29.1 2016: D+22.8 2012: D+22.2 2008: D+28.4
Not yet ingested
- Civics
- —
Market trends
- HPI YoY
- ▼ -81.57%
- Current HPI
- 395.7071
- Rent YoY
- ▲ 0.81%
- Metro
- Indianapolis-Carmel-Anderson, IN
- State GDP YoY
- ▲ 2.90%
- F500 in state
- 18
Industry mix (Fortune 500 HQ in IN)
| Industry | F500 HQs | Revenue |
|---|---|---|
| Industrial Machinery | 2 | $37B |
|
||
| Healthcare | 1 | $177B |
|
||
| Pharmaceuticals | 1 | $45B |
|
||
| Metals / Steel | 1 | $18B |
|
||
| Agriculture | 1 | $17B |
|
||
| Packaging | 1 | $12B |
|
||
Price history
-10.1% since first listed4 events — show timeline
- 2026-04-21 Relisted — MIBOR as Distributed by MLS Grid
- 2026-04-19 Listing Removed — MIBOR as Distributed by MLS Grid
- 2026-03-17 Price Changed $62,900 MIBOR as Distributed by MLS Grid
- 2026-01-20 Listed $70,000 MIBOR as Distributed by MLS Grid
Property tax history
+13.4%/yrLatest (2025): $1,751 · +39.8% YoY. Source: county tax records.
Cash-flow waterfall
monthlySold comps — $/sqft
last 12 mo · ≤1 miLoading sold comps…