 Triplex
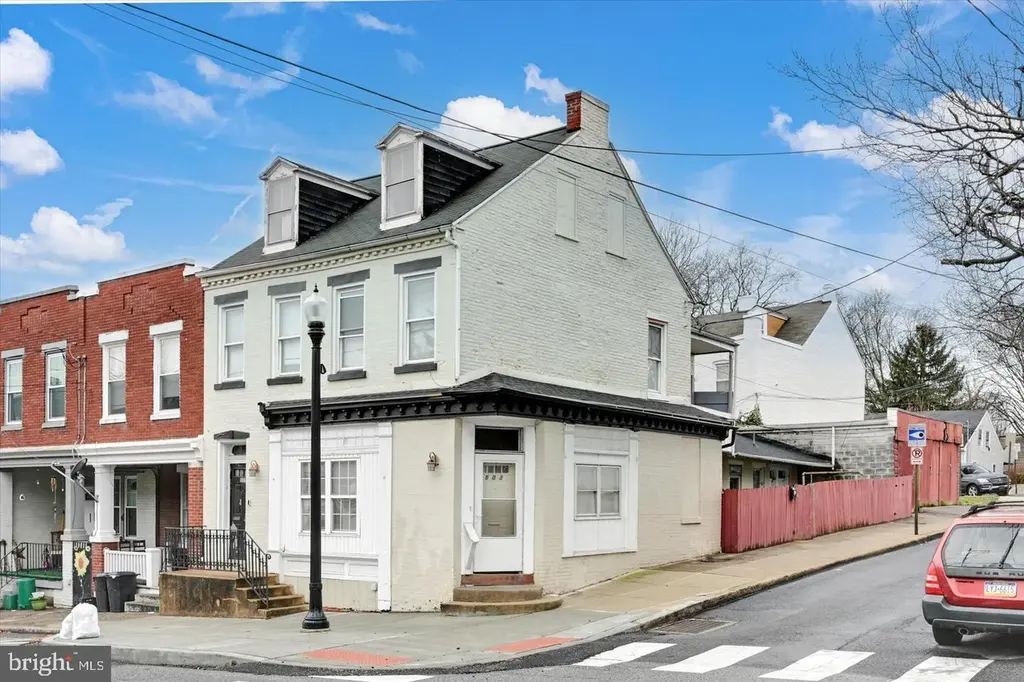
503-505 Manor St · Lancaster, PA
Flood risk 1/10 · Minimal
- FEMA flood zone
- X (unshaded)
- Chance of flooding over 30 yrs
- 0.0%
- Est. flood insurance / yr
- $507 – $1,088
Fire risk 1/10 · Minimal
- Est. fire insurance / yr
- $511 – $949
Heat risk 6/10 · Moderate
- Hot days now (above 101°F)
- 7 days/yr
- Hot days in 30 yrs
- 15 days/yr
Wind risk 4/10 · Minor
- Chance of severe wind over 30 yrs
- 16.0%
Air-quality risk 4/10 · Minor
- Unhealthy air days now
- 4 days/yr
- Unhealthy air days in 30 yrs
- 7 days/yr
Risk factors via First Street. Map © Google.
Why this score? — see what drove the C- grade
The composite is a weighted blend of 9 inputs, each scored 0–100. Each bar is that input's sub-score; the figure is the points it added to the 100-point composite (weight × sub-score).
- Cash flow +26.1/30.0
- DSCR +8.8/10.0
- 1% rule +6.4/10.0
- Livability +4.2/5.0
- Rent growth +2.6/5.0
- Condition / age +2.5/5.0
- Schools +1.6/10.0
- ARV discount +0.0/15.0
- Appreciation +0.0/10.0
$364,900
🖨 Deal sheet 📄 Offer letter ✓ Due diligence
Multi-family units
County records classify this as Multi-Family (2-4 Unit). Listing-text estimate: 3 units. confirmed
Listing remarks MLS
A freshly renovated 3 unit + 3 garages with great income. Well maintained and new roof. Separate electric, Fully occupied.
Key facts
- 2,614 sq ft lot
- 3 garage spots
- Built 1930
Neighborhood map
What this means for you Summary
Snapshot
- This is a 1×2bd/1.0ba + 2×1bd/1.0ba units multifamily listed at $365k.
Deal economics
- At list price, monthly cash flow is $918 ($11k/yr) — positive. Per door: $306/mo.
- The deal already cash-flows at list — no discount required.
- Meets the 1% rule at list price ($4k rent vs $365k).
- Recommended offer: $359k (1.5% below list) — sets the bar for market timing.
- Cap rate 9.3% vs local median 4.2% in Lancaster — top-decile yield for the area; either an underpriced asset or a hidden risk that comps aren't pricing in. Stress-test before assuming the spread holds.
Location & tenants
- Location reads 85/100 on livability (#71 in PA, #498 nationally) — a professional / high-income tenant draw. Strengths: amenities A+, commute A+, cost of living A+; Watch: crime C-, employment C-.
- Lancaster SD (urban): math 12% / reading 25% proficiency, ranked #500 of 539 in PA (top 93%) — low school quality limits family demand, transient renter base, plan for 1-2y turnover; 72% free/reduced lunch — lower-income household profile, screen leases tightly.
- Market conditions: Rents flat; 292 active listings in the ZIP; 16 comparable units currently listed for rent nearby; rentals lingering (median 44d on market — plan ~5-8 weeks vacancy on turnover, expect pricing pressure); 50% of comp listings sitting > 30 days — soft ceiling on asking rent; solid renter incomes; 1,093 units permitted in Lancaster County in 2024 (201 in 5+ unit buildings).
- At $4,175/mo this rent would consume 65% of the median local household income ($77k/yr) (locally 2557% of renters already pay >50% of income on rent) — very limited rent-growth headroom before tenants either downsize or default.
Forward outlook
- Local home prices are declining (-3.0%/yr); year-one equity from $3k of loan paydown is wiped out by about $11k of value loss. Plan a longer hold.
- Lancaster County population projected at +5% by 2050 — modest demand growth; plan on rents tracking national, not racing it.
Negotiation context
- It's been on market 25 days — a 2% lower offer ($359k) is reasonable based on typical stale-listing flexibility.
- 7 sale attempts since 15y ago with the ask held roughly flat each time — persistent listings suggest the price (not the market) is what's stuck; bring a comps-based counter.
Risks & watch-outs
- Watch-outs: built in 1930 — expect roof / HVAC / electrical / plumbing capex.
- Climate carrying-cost: extreme-heat days projected 7→15/yr by 2055 (HVAC capex compounding) — expect insurance premiums to compound above CPI over the hold.
Questions for the listing agent
- Can we see the unit-by-unit rent roll, current vacancy, and any below-market leases? What's the average tenancy length?
- What capital expenditures (roof, boiler, parking lot, exteriors) have been made in the last 5 years, and what's planned in the next 2?
- Built in 1930 — when were the roof, HVAC, electrical panel, plumbing, and water heater last replaced?
- Is there a deadline driving the sale (1031 exchange, divorce, estate, relocation)? That informs how much negotiation room exists.
- What's the average days-on-market for RENTAL listings here right now (not sales)? A rising rental-DOM trend means longer vacancies and softer asking-rent achievability than the comps imply.
- What's the recent tenant-quality profile in this submarket — average credit score on applications, eviction rate, late-payment / NSF rate, and stable-employment percentage? A property-management company in the area should have these aggregated.
- How much new apartment / multifamily construction is in the pipeline within 1–3 miles? Heavy new supply (>2% of stock underway) typically softens rents 12–24 months out; light construction supports rent growth.
Investment metrics
- 1% rule
- 1.14% ✓
- Cap rate
- 9.31%
- Cash-on-cash
- 10.78%
- DSCR
- 1.48
- GRM
- 7.3
CMA / ARV
- ARV (on-the-fly)
- $306,344
- Comps found
- 12
Show comp detail 12 sales within ~0.75 mi
| Address | Dist | Beds/Ba | Sqft | Sold | Price | $/sf | Match |
|---|---|---|---|---|---|---|---|
| 503-505 Manor St | 0.00mi | 4/3.0 | 2,056 (0%) | 1mo | $355,000 | $173 | 99 |
| 329 W King St | 0.19mi | 4/— | 2,149 (+4%) | 1mo | $270,000 | $126 | 83 |
| 747-749 Manor St | 0.33mi | 4/3.0 | 2,048 (-0%) | 2mo | $335,000 | $164 | 82 |
| 642 Second St | 0.29mi | 4/— | 2,013 (-2%) | 4mo | $270,000 | $134 | 80 |
| 751 High St | 0.36mi | 5/— (+1) | 2,152 (+5%) | 2mo | $383,500 | $178 | 69 |
| 411-413 S Arch St | 0.28mi | 5/— (+1) | 1,896 (-8%) | 1mo | $230,500 | $122 | 68 |
| 662 Saint Joseph St | 0.29mi | 5/2.0 (+1) | 1,941 (-6%) | 2mo | $290,000 | $149 | 66 |
| 348 S Queen St | 0.57mi | 4/2.0 | 2,080 (+1%) | 2mo | $229,900 | $111 | 66 |
| 410 W Vine St | 0.20mi | 5/2.5 (+1) | 2,311 (+12%) | 4mo | $252,500 | $109 | 59 |
| 612 W Chestnut St | 0.34mi | 3/— (-1) | 1,862 (-9%) | 7mo | $385,000 | $207 | 58 |
| 136-142 Fairview Ave | 0.42mi | 5/— (+1) | 1,810 (-12%) | 10mo | $405,000 | $224 | 47 |
| 432 S Queen St | 0.64mi | 5/2.0 (+1) | 1,827 (-11%) | 3mo | $245,000 | $134 | 40 |
Match score weights: distance 35% · size 25% · config 20% · recency 20%. Top-matched comps best support the ARV.
Projected returns pro-forma
-3.0% appreciation · 0.47% rent growth · sell at horizon
- IRR
- -3.0%
- Equity multiple
- 0.89×
- Total profit
- $-11,078
- Equity at exit
- $54,408
- IRR
- 3.8%
- Equity multiple
- 1.25×
- Total profit
- $25,074
- Equity at exit
- $31,550
Cash invested: $102,172 (down + closing). Projections, not guarantees.
Landlord ↔ Tenant lean methodology
- Overall (STATE)
- 62 Landlord-Friendly
- State Pennsylvania
- 62 Landlord-Friendly · EVEN
- County
- — inherits STATE
- City
- — inherits STATE
ZIP-level market 17603
- Rents YoY
- 0.5%
- Active inventory
- 292
- Price-to-rent
- 20.6×
Monthly cashflow live
- Estimated rent
- $4,175 high interval (Pro) →
- Mortgage (P&I)
- −$1,914
- Tax from tax record
- −$315 /mo · $3,781/yr
- Insurance
- −$152
- HOA
- −$0
- Vacancy / Maint / Mgmt
- −$877
- Net cashflow
- $918
Break-even live
3-unit breakdown (identical units grouped — click to expand)
| Units | Beds | Baths | Est. rent |
|---|---|---|---|
| 1× unit | 2 | 1 | $1,475 |
| 2× units | 1 | 1 | $2,700 |
| #2 | 1 | 1 | $1,350 |
| #3 | 1 | 1 | $1,350 |
| Total (3 units) | $4,175 | ||
UW: 25.0% down · 7.5% · 30yr · 1.5% tax · 5.0% vac · 8.0% maint · 8.0% mgmt
Financing live
Cash to close
- Down payment
- $91,225
- Closing costs
- $10,947
- Reserves months
- —
- Total cash needed
- —
Loan-product check · same deal, 3 products live
Conventional
25% down · 7.5% · 30yr
- Down + closing
- —
- Monthly P&I
- —
- Monthly cashflow
- —
- DSCR
- —
- Eligible?
- —
Personal DTI + credit; lowest rate.
DSCR
20% down · 8.5% · 30yr
- Down + closing
- —
- Monthly P&I
- —
- Monthly cashflow
- —
- DSCR
- —
- Eligible?
- —
No personal income docs; deal must DSCR.
Hard money
10% down · 12.0% · 12mo
- Down + closing
- —
- Monthly P&I
- —
- Monthly cashflow
- —
- DSCR
- —
- Eligible?
- —
Short-term bridge; refi at stabilization.
Rent comps 16 comps
| Address | Beds | Baths | Sqft | Rent | $/sqft | DOM | Units | Dist |
|---|---|---|---|---|---|---|---|---|
| 529 Manor St Lancaster, PA | 3.0 | 1.0 | 1434 | $1,635 | $1.14 | 13d | 1 | 0.07mi |
| 609 Saint Joseph St Lancaster, PA | 4.0 | 2.0 | 1523 | $1,695 | $1.11 | 43d | 1 | 0.22mi |
| 49 W Farnum St Lancaster, PA | 3.0 | 1.0 | 1820 | $1,650 | $0.91 | 43d | 1 | 0.39mi |
| 118 N Prince St Lancaster, PA | 1.0–3.0 | 1.0–3.0 | 1274 | $4,703 | $3.69 | 13d | 48 | 0.40mi |
| 337 W Lemon St Unit 2 Lancaster, PA | 3.0 | 1.0 | 1588 | $1,895 | $1.19 | 13d | 1 | 0.55mi |
| 549 Howard Ave Lancaster, PA | 4.0 | 1.0 | 1439 | $1,700 | $1.18 | 43d | 1 | 0.56mi |
| 611 S West End Ave Lancaster, PA | 4.0 | 1.5 | 1589 | $1,800 | $1.13 | 13d | 1 | 0.63mi |
| 403 N Queen St Lancaster, PA | 3.0 | 2.0 | 1950 | $3,500 | $1.79 | 13d | 1 | 0.70mi |
| 520 W Frederick St Lancaster, PA | 4.0 | 1.0 | 1713 | $1,895 | $1.11 | 43d | 1 | 0.72mi |
| 1121 Spring Grove Ave Lancaster, PA | 4.0 | 2.0 | 1755 | $2,200 | $1.25 | 43d | 1 | 0.86mi |
| 708 S Lime St Unit 3 Lancaster, PA | 4.0 | 1.0 | 1742 | $1,850 | $1.06 | 43d | 1 | 1.02mi |
| 860 N Market St Lancaster, PA | 3.0 | 2.0 | 1514 | $1,850 | $1.22 | 43d | 1 | 1.10mi |
| 1415 Spencer Ave Lancaster, PA | 1.0–3.0 | 1.0–2.0 | 1181 | $3,720 | $3.15 | 13d | 1 | 1.16mi |
| 1330 Wabank Rd Lancaster, PA | 1.0–3.0 | 1.0–2.5 | 1423 | $2,062 | $1.45 | 13d | 21 | 1.29mi |
| 836 N Plum St Lancaster, PA | 3.0 | 2.0 | 1602 | $2,150 | $1.34 | 13d | 1 | 1.33mi |
| 631 E Frederick St Lancaster, PA | 3.0 | 1.0 | 1830 | $1,850 | $1.01 | 43d | 1 | 1.42mi |
Listing history 25 events
-
2026-04-21status Pending
-
2026-03-27$364,900 Active
-
2023-05-05soldstatus $327,550 Closed 122-char remark
Show marketing remark (122 chars)
A freshly renovated 3 unit + 3 garages with great income. Well maintained and new roof. Separate electric, Fully occupied.
-
2023-03-30status Pending 122-char remark
Show marketing remark (122 chars)
A freshly renovated 3 unit + 3 garages with great income. Well maintained and new roof. Separate electric, Fully occupied.
-
2023-03-09$339,000 Active 122-char remark
Show marketing remark (122 chars)
A freshly renovated 3 unit + 3 garages with great income. Well maintained and new roof. Separate electric, Fully occupied.
-
2023-03-03historical $339,000 122-char remark
Show marketing remark (122 chars)
A freshly renovated 3 unit + 3 garages with great income. Well maintained and new roof. Separate electric, Fully occupied.
-
2022-04-08soldstatus $245,000 Closed 137-char remark
Show marketing remark (137 chars)
Well Maintained 3 unit & 3 garages bringing in approximately 2,300/month income. Great opportunity for a great investment property
-
2022-04-08soldstatus $245,000
Show marketing remark (137 chars)
Well Maintained 3 unit & 3 garages bringing in approximately 2,300/month income. Great opportunity for a great investment property
-
2022-03-09historical Active Under Contract 137-char remark
Show marketing remark (137 chars)
Well Maintained 3 unit & 3 garages bringing in approximately 2,300/month income. Great opportunity for a great investment property
-
2022-02-17price $255,000 137-char remark
Show marketing remark (137 chars)
Well Maintained 3 unit & 3 garages bringing in approximately 2,300/month income. Great opportunity for a great investment property
-
2022-02-17status Active 137-char remark
Show marketing remark (137 chars)
Well Maintained 3 unit & 3 garages bringing in approximately 2,300/month income. Great opportunity for a great investment property
-
2021-12-13status Pending 137-char remark
Show marketing remark (137 chars)
Well Maintained 3 unit & 3 garages bringing in approximately 2,300/month income. Great opportunity for a great investment property
-
2021-11-24$245,000 Active 137-char remark
Show marketing remark (137 chars)
Well Maintained 3 unit & 3 garages bringing in approximately 2,300/month income. Great opportunity for a great investment property
-
2021-06-14soldstatus $215,000
-
2013-05-28soldstatus $104,000
-
2013-05-22soldstatus $104,000
-
2013-04-29historical
-
2013-03-04$109,900
-
2013-02-07historical
-
2012-02-08$109,900
-
2011-12-01historical
-
2011-06-17$119,900
-
2005-11-03soldstatus $84,000
-
2003-06-25soldstatus $65,000
-
1990-09-19soldstatus $33,000
ⓘ Source: listings_history table (triggers on properties + properties_extension) + one-shot
backfill from property_details.listing_events for pre-trigger history.
Tax reassessment forecast PA · Partial reset (capped growth)
- Current annual tax
- $3,781 · $315/mo
- Projected year-2 tax
- $4,773 · $398/mo
- Expected delta
- +$992/yr (+$83/mo · 26.2%)
ⓘ Screening estimate from a state-policy table — verify with the county assessor before closing.
Climate risk First Street
- Flood 1/10 Low FEMA zone X (unshaded) · 0% chance over 30 yrs
- Wildfire 1/10 Low
- Heat 6/10 Major 7 d/yr ≥101°F today · 15 d/yr by 30 yrs out
- Wind 4/10 Moderate 16% chance of damaging wind over 30 yrs
- Air quality 4/10 Moderate 4 unhealthy d/yr today · 7 by 30 yrs out
Nearby sold comps map
Loading sold comps map…
Walkable amenities ~0.75 mi
Loading nearby amenities…
Taxation est. · year 1
- Rental income
- $50,100
- − Mortgage interest
- −$20,440
- − Property taxes
- −$3,781
- − Insurance
- −$1,824
- − Repairs & maintenance
- −$4,008
- − Management
- −$4,008
- − Depreciation
- −$10,615
- Taxable income
- $5,424
- Est. tax owed @ 24.0%
- −$1,302
- After-tax cash flow
- $9,709/yr
For passive investors: Depreciation is non-cash, so a rental often shows a tax loss while cash-flowing — sheltering income. Rental losses are passive: they offset passive income freely, and up to $25,000/yr can offset ordinary (W-2) income if you actively participate and your MAGI is under $100k (phasing out to $0 by $150k); unused losses carry forward. On sale, claimed depreciation is recaptured at up to 25%, and gains may owe capital-gains tax (a 1031 exchange can defer both). Figures are a year-1 estimate at your 24.0% rate — not tax advice; consult a CPA.
Schools (NCES district)
- District
- Lancaster SD
- NCES district ID
- 4213140
- Math proficiency
- 12% ▼ -10.00%
- Reading proficiency
- 25% ▼ -13.00%
- Median HH income
- $38,500
- Composite
- 15.52/100
- National rank
- #9301
- State rank
- #500 of 539 in PA
Livability — Lancaster
- Score
- 85/100
- State rank
- #71
- US rank
- #498
Category grades
Schools grade is shown separately in the Schools card above.
Census & demographics
- Census place
- Lancaster, PA
- County
- Lancaster County · 390,309 people
- City population
- 176,170
- Metro
- Lancaster, PA
- Population (ZIP)
- 67,571
- Household income
- $77,084
- Rent vs Own
- Severe rent burden
- 2557.0
Population outlook (Lancaster County) Hauer SSP2
- Today (2025)
- 561,011 people
- By 2030
- 570,969 · +1.8%
- By 2040
- 585,929 · +4.4%
- By 2050
- 591,056 · +5.4%
- By 2075
- 594,747 · +6.0%
- By 2100
- 558,850 · -0.4%
Race, ethnicity, and origin ACS 2023
- Neighborhood character
- Diverse neighborhood (Simpson 0.59)
- Race & ethnicity
- White 58% Hispanic / Latino 27% Two or more races 12% Black 7% Asian 4%
- Hispanic origin (detail)
- Mexican 1% Puerto Rican 19% Cuban 1% Dominican 2%
- Common ancestry
- Romanian 2% Slovak 2% Lithuanian 1%
- Foreign-born
- 9% · Canada, China, India
- Languages at home
- 77% English-only · Spanish 17% Other Indo-European 1% Chinese 1%
Political lean MEDSL · Lancaster
- 2024 margin
- R (+15.9) · D 41.5% · R 57.5%
- 2008→2024 swing
- -4.1pp toward R · 2008: -11.8pp · 2024: -15.9pp
- All cycles
- 2024: R+15.9 2020: R+15.8 2016: R+19.7 2012: R+19.2 2008: R+11.8
Not yet ingested
- Civics
- —
Market trends
- HPI YoY
- ▼ -508.78%
- Current HPI
- 289.3324
- Rent YoY
- ▲ 0.47%
- Metro
- Lancaster, PA
- State GDP YoY
- ▲ 1.68%
- F500 in state
- 34
Industry mix (Fortune 500 HQ in PA)
| Industry | F500 HQs | Revenue |
|---|---|---|
| Healthcare | 2 | $309B |
|
||
| Insurance | 2 | $27B |
|
||
| Telecommunications / Media | 1 | $124B |
|
||
| Industrial Distribution | 1 | $22B |
|
||
| Financial Services | 1 | $20B |
|
||
| Chemicals / Materials | 1 | $18B |
|
||
Price history
+1005.8% since first listed25 events — show timeline
- 2026-04-21 Pending — BRIGHT MLS
- 2026-03-27 Listed $364,900 BRIGHT MLS
- 2023-05-05 Sold (MLS) $327,550 BRIGHT MLS
- 2023-03-30 Pending — BRIGHT MLS
- 2023-03-09 Listed $339,000 BRIGHT MLS
- 2023-03-03 Coming Soon $339,000 BRIGHT MLS
- 2022-04-08 Sold (Public Records) $245,000 Public Records
- 2022-04-08 Sold (MLS) $245,000 BRIGHT MLS
- 2022-03-09 Contingent — BRIGHT MLS
- 2022-02-17 Price Changed $255,000 BRIGHT MLS
- 2022-02-17 Relisted — BRIGHT MLS
- 2021-12-13 Pending — BRIGHT MLS
- 2021-11-24 Listed $245,000 BRIGHT MLS
- 2021-06-14 Sold (Public Records) $215,000 Public Records
- 2013-05-28 Sold (Public Records) $104,000 Public Records
- 2013-05-22 Sold (MLS) $104,000 BRIGHT MLS
- 2013-04-29 Listing Removed — BRIGHT MLS
- 2013-03-04 Listed $109,900 BRIGHT MLS
- 2013-02-07 Listing Removed — BRIGHT MLS
- 2012-02-08 Listed $109,900 BRIGHT MLS
- 2011-12-01 Listing Removed — BRIGHT MLS
- 2011-06-17 Listed $119,900 BRIGHT MLS
- 2005-11-03 Sold (Public Records) $84,000 Public Records
- 2003-06-25 Sold (Public Records) $65,000 Public Records
- 1990-09-19 Sold (Public Records) $33,000 Public Records
Property tax history
+0.4%/yrLatest (2026): $3,781 · +3.3% YoY. Source: county tax records.
Cash-flow waterfall
monthlySold comps — $/sqft
last 12 mo · ≤1 miLoading sold comps…