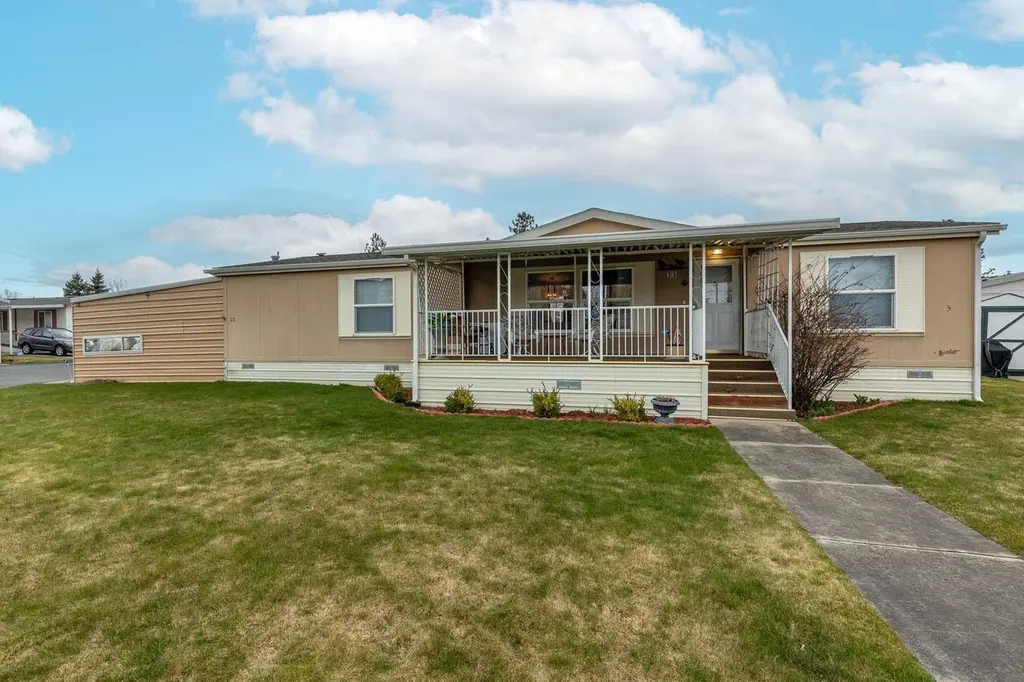
6805 N Crestline St #33 · Spokane, WA
Flood risk 1/10 · Minimal
- FEMA flood zone
- X (unshaded)
- Chance of flooding over 30 yrs
- 0.0%
- Est. flood insurance / yr
- $473 – $860
Fire risk 3/10 · Minor
- Est. fire insurance / yr
- $604 – $1,122
Heat risk 3/10 · Minor
- Hot days now (above 94°F)
- 7 days/yr
- Hot days in 30 yrs
- 14 days/yr
Wind risk 1/10 · Minimal
- Chance of severe wind over 30 yrs
- —
Air-quality risk 10/10 · Severe
- Unhealthy air days now
- 19 days/yr
- Unhealthy air days in 30 yrs
- 21 days/yr
Risk factors via First Street. Map © Google.
Why this score? — see what drove the C grade
The composite is a weighted blend of 9 inputs, each scored 0–100. Each bar is that input's sub-score; the figure is the points it added to the 100-point composite (weight × sub-score).
- Cash flow +23.9/30.0
- DSCR +7.7/10.0
- 1% rule +6.2/10.0
- ARV discount +5.6/15.0
- Rent growth +4.9/5.0
- Schools +4.6/10.0
- Livability +4.0/5.0
- Condition / age +2.5/5.0
- Appreciation +0.0/10.0
$170,000
🖨 Deal sheet 📄 Offer letter ✓ Due diligence
Listing remarks MLS
WELL MAINTAINED Manufactured Home!!! This 1568 Sq Ft home features open living room w/ formal dining, large kitchen w/ eating space & eating bar, den/office w/ built in hutch, etc. Updates: 2012 - Steel lifetime screens - all window & New controls in sprinklers; 2010 - Rebath in master bath. It’s move in ready! 8X10 Storage Shed w/ power installed. Lot lease includes water & sewer & garbage. Possible Financing: Financial Services Unlimited: 800-238-9202 //or// 21st Mortgage Corp: 800-955-0021
Key facts
- Newer ac unit
- Charming front porch
- Covered parking
Tags
Property features AI
Finance
- Other: Located in Miller park; Make: Marle
- HOA & community: Senior community; Land lease: $498/month
Exterior
- Parking: Carport (2 spaces)
- Utilities: High-speed internet available
- Home design: Manufactured home (residential); One story
- Construction: Wood siding; Composition roof; Slab and block foundation; skirted; axel removed
- Exterior features: Deck; Patio; Automatic sprinkler; Corner lot; Private road frontage
Interior
- Kitchen: Free-standing range; Dishwasher; Refrigerator
- Bedrooms: 3 bedrooms
- Heating & cooling: Natural gas forced air heating; Central air conditioning
- Interior features: Hot water; Utility room; Grab bars throughout
Neighborhood map
What this means for you Summary
Snapshot
- This is a 3-bed/2.0-bath manufactured listed at $170k.
Deal economics
- At list price, monthly cash flow is $329 ($4k/yr) — positive.
- The deal already cash-flows at list — no discount required.
- Meets the 1% rule at list price ($2k rent vs $170k).
- Recommended offer: $160k (6.0% below list) — sets the bar for market timing.
- Cap rate 8.6% vs local median 3.2% in Spokane — top-decile yield for the area; either an underpriced asset or a hidden risk that comps aren't pricing in. Stress-test before assuming the spread holds.
Location & tenants
- Location reads 80/100 on livability (#93 in WA, #1,822 nationally) — a professional / high-income tenant draw. Strengths: amenities A+, commute A+, housing A+; Watch: crime F.
- Spokane School District (urban): math 47% / reading 58% proficiency, ranked #136 of 291 in WA (top 47%) — acceptable for families but not a draw, mixed tenant base, ~2y average lease.
- Market conditions: Rents rising fast (+9.5%/yr); 207 active listings in the ZIP; 11 comparable units currently listed for rent nearby; rentals leasing fast (median 14d on market — plan ~1-2 weeks tenant-placement turnaround); 3,608 units permitted in Spokane County in 2024 (1,792 in 5+ unit buildings).
- This rent runs 31% of the median local income ($74k/yr) — at the standard rent-burdened threshold; future hikes will face affordability resistance.
Forward outlook
- Local home prices are declining (-3.0%/yr); year-one equity from $1k of loan paydown is wiped out by about $5k of value loss. Plan a longer hold.
- Spokane County population projected at +13% by 2050 — modest demand growth; plan on rents tracking national, not racing it.
- At projected returns (-3.0% appreciation + 8.0% rent growth), your $48k cash investment doubles in ~8 years — after that, you're playing with house money.
Negotiation context
- It's been on market 87 days — a 6% lower offer ($160k) is reasonable based on typical stale-listing flexibility.
- 2 sale attempts since 13y ago; this cycle's ask has dropped $10k (6%) from the opening price — seller is motivated, your offer sets the floor, not the list.
- Current owner paid $52k; list at $170k implies a 227% gain — meaningful room to come down on a strong offer.
Questions for the listing agent
- It's been on market 87 days. Have you received any prior offers? Is the seller open to a 6% concession, seller financing, or rate buy-down credit?
- Why hasn't it sold? Are there any deal-killer items the seller is aware of (foundation, flood, title, zoning, code violations)?
- Is there a deadline driving the sale (1031 exchange, divorce, estate, relocation)? That informs how much negotiation room exists.
- Schools are B-rated — typically a magnet for longer-tenancy family renters. What's the average tenant stay here, and is there a school-zone premium baked into asking?
- Crime grade is F in this area — have there been break-ins, vandalism, or insurance claims at this property in the last 3 years? What carrier currently insures it and at what premium?
- What's the average days-on-market for RENTAL listings here right now (not sales)? A rising rental-DOM trend means longer vacancies and softer asking-rent achievability than the comps imply.
- What's the recent tenant-quality profile in this submarket — average credit score on applications, eviction rate, late-payment / NSF rate, and stable-employment percentage? A property-management company in the area should have these aggregated.
- How much new for-sale + rental construction is in the pipeline within 1–3 miles? Heavy new supply typically softens prices + rents 12–24 months out; constrained supply supports both.
Investment metrics
- 1% rule
- 1.12% ✓
- Cap rate
- 8.62%
- Cash-on-cash
- 8.30%
- DSCR
- 1.37
- GRM
- 7.4
CMA / ARV
- ARV (on-the-fly)
- $163,072
- Comps found
- 9
Show comp detail 9 sales within ~0.75 mi
| Address | Dist | Beds/Ba | Sqft | Sold | Price | $/sf | Match |
|---|---|---|---|---|---|---|---|
| 6408 N Altamont St | 0.33mi | 4/2.0 (+1) | 1,512 (-4%) | 3mo | $325,000 | $215 | 71 |
| 6632 N Crestline St | 0.10mi | 3/2.0 | 1,386 (-12%) | 11mo | $330,000 | $238 | 67 |
| 6624 N Crestline St | 0.12mi | 3/2.0 | 1,450 (-8%) | 20mo | $335,000 | $231 | 66 |
| 2206 E Houghton Ave | 0.47mi | 3/2.0 | 1,566 (-0%) | 17mo | $385,000 | $246 | 64 |
| 6805 N Crestline St #24 | 0.00mi | 3/2.0 | 1,782 (+14%) | 19mo | $70,000 | $39 | 62 |
| 1211 E Lyons #62 Ave | 0.52mi | 3/2.0 | 1,400 (-11%) | 6mo | $135,000 | $96 | 53 |
| 1209 E Lyons Ave #193 | 0.54mi | 2/2.0 (-1) | 1,680 (+7%) | 9mo | $93,500 | $56 | 50 |
| 1211 E Lyons Ave #83 | 0.52mi | 3/2.0 | 1,344 (-14%) | 5mo | $93,000 | $69 | 48 |
| 1205 E Lyons Ave #8 | 0.64mi | 2/2.0 (-1) | 1,344 (-14%) | 23mo | $140,000 | $104 | 23 |
Match score weights: distance 35% · size 25% · config 20% · recency 20%. Top-matched comps best support the ARV.
Projected returns pro-forma
-3.0% appreciation · 8.0% rent growth · sell at horizon
- IRR
- 1.8%
- Equity multiple
- 1.07×
- Total profit
- $3,501
- Equity at exit
- $25,348
- IRR
- 15.8%
- Equity multiple
- 2.60×
- Total profit
- $75,944
- Equity at exit
- $14,698
Cash invested: $47,600 (down + closing). Projections, not guarantees.
Landlord ↔ Tenant lean methodology
- Overall (STATE)
- 28 Tenant-Leaning
- State Washington
- 28 Tenant-Leaning · D+8
- County
- — inherits STATE
- City
- — inherits STATE
ZIP-level market 99217
- Home prices YoY
- -30.7%
- Rents YoY
- 9.5%
- Active inventory
- 207
- Price-to-rent
- 7.4×
Monthly cashflow live
- Estimated rent
- $1,904 high interval (Pro) →
- Mortgage (P&I)
- −$891
- Tax est. 1.5%
- −$212 /mo · $2,550/yr
- Insurance
- −$71
- HOA
- −$0
- Vacancy / Maint / Mgmt
- −$400
- Net cashflow
- $329
Break-even live
UW: 25.0% down · 7.5% · 30yr · 1.5% tax · 5.0% vac · 8.0% maint · 8.0% mgmt
Financing live
Cash to close
- Down payment
- $42,500
- Closing costs
- $5,100
- Reserves months
- —
- Total cash needed
- —
Loan-product check · same deal, 3 products live
Conventional
25% down · 7.5% · 30yr
- Down + closing
- —
- Monthly P&I
- —
- Monthly cashflow
- —
- DSCR
- —
- Eligible?
- —
Personal DTI + credit; lowest rate.
DSCR
20% down · 8.5% · 30yr
- Down + closing
- —
- Monthly P&I
- —
- Monthly cashflow
- —
- DSCR
- —
- Eligible?
- —
No personal income docs; deal must DSCR.
Hard money
10% down · 12.0% · 12mo
- Down + closing
- —
- Monthly P&I
- —
- Monthly cashflow
- —
- DSCR
- —
- Eligible?
- —
Short-term bridge; refi at stabilization.
Rent comps 11 comps
| Address | Beds | Baths | Sqft | Rent | $/sqft | DOM | Units | Dist |
|---|---|---|---|---|---|---|---|---|
| 1517 E Calkins Ave Spokane, WA | 4.0 | 2.0 | 1753 | $2,200 | $1.25 | 13d | 1 | 0.66mi |
| 2420 E Joseph Ave Spokane, WA | 3.0 | 2.5 | 1268 | $1,900 | $1.50 | 23d | 1 | 0.72mi |
| 1718 E Lincoln Rd Spokane, WA | 1.0–2.0 | 1.0–2.0 | 975 | $1,795 | $1.84 | 13d | 10 | 0.73mi |
| 1508 E Nebraska Ave Spokane, WA | 3.0 | 2.0 | 2200 | $1,995 | $0.91 | 23d | 1 | 0.82mi |
| 723 E Sitka Spokane, WA | 2.0 | 2.0 | 1400 | $1,875 | $1.34 | 13d | 1 | 0.92mi |
| 6903 N Cincinnati St Spokane, WA | 3.0 | 2.0 | 1600 | $2,100 | $1.31 | 23d | 1 | 0.93mi |
| 510 E Dalke Ave Spokane, WA | 2.0 | 1.0 | 1500 | $1,595 | $1.06 | 21d | 1 | 1.14mi |
| 6203 N Astor St Spokane, WA | 2.0 | 1.0 | 1100 | $1,400 | $1.27 | 13d | 1 | 1.20mi |
| 6203 N Astor St Unit 2 Spokane, WA | 2.0 | 1.5 | 1100 | $1,400 | $1.27 | 21d | 1 | 1.20mi |
| 7024 N Colton St Spokane, WA | 2.0 | 2.0 | 1082 | $1,385 | $1.28 | 13d | 1 | 1.23mi |
| 636 E Magnesium Rd Spokane, WA | 1.0–3.0 | 1.0–3.0 | 1053 | $2,325 | $2.21 | 13d | 12 | 1.46mi |
Listing history 19 events
-
2026-06-18days on market $170,000 Active 87 DOM
-
2026-06-17days on market $170,000 Active 86 DOM
-
2026-06-16days on market $170,000 Active 85 DOM
-
2026-06-15days on market $170,000 Active 84 DOM
-
2026-06-14days on market $170,000 Active 82 DOM
-
2026-06-10days on market $170,000 Active 79 DOM
-
2026-06-09days on market $170,000 Active 78 DOM
-
2026-06-08days on market $170,000 Active 77 DOM
-
2026-06-07days on market $170,000 Active 76 DOM
-
2026-06-03days on market $170,000 Active 72 DOM
-
2026-06-02days on market $170,000 Active 71 DOM
-
2026-06-01days on market $170,000 Active 70 DOM
-
2026-05-31days on market $170,000 Active 69 DOM
-
2026-05-31days on market $170,000 Active 68 DOM
-
2026-05-01price $170,000
-
2026-05-01price $175,000
-
2026-03-23$180,000 Active
-
2014-03-04soldstatus $52,000 531-char remark
Show marketing remark (531 chars)
WELL MAINTAINED Manufactured Home!!! This 1568 Sq Ft home features open living room w/ formal dining, large kitchen w/ eating space & eating bar, den/office w/ built in hutch, etc. Updates: 2012 - Steel lifetime screens - all window & New controls in sprinklers; 2010 - Rebath in master bath. It’s move in ready! 8X10 Storage Shed w/ power installed. Lot lease includes water & sewer & garbage. Possible Financing: Financial Services Unlimited: 800-238-9202 //or// 21st Mortgage Corp: 800-955-0021
-
2013-05-18$55,000 531-char remark
Show marketing remark (531 chars)
WELL MAINTAINED Manufactured Home!!! This 1568 Sq Ft home features open living room w/ formal dining, large kitchen w/ eating space & eating bar, den/office w/ built in hutch, etc. Updates: 2012 - Steel lifetime screens - all window & New controls in sprinklers; 2010 - Rebath in master bath. It’s move in ready! 8X10 Storage Shed w/ power installed. Lot lease includes water & sewer & garbage. Possible Financing: Financial Services Unlimited: 800-238-9202 //or// 21st Mortgage Corp: 800-955-0021
ⓘ Source: listings_history table (triggers on properties + properties_extension) + one-shot
backfill from property_details.listing_events for pre-trigger history.
Climate risk First Street
- Flood 1/10 Low FEMA zone X (unshaded) · 0% chance over 30 yrs
- Wildfire 3/10 Moderate
- Heat 3/10 Moderate 7 d/yr ≥94°F today · 14 d/yr by 30 yrs out
- Wind 1/10 Low
- Air quality 10/10 Extreme 19 unhealthy d/yr today · 21 by 30 yrs out
Nearby sold comps map
Loading sold comps map…
Walkable amenities ~0.75 mi
Loading nearby amenities…
Taxation est. · year 1
- Rental income
- $22,844
- − Mortgage interest
- −$9,523
- − Property taxes
- −$2,550
- − Insurance
- −$850
- − Repairs & maintenance
- −$1,828
- − Management
- −$1,828
- − Depreciation
- −$4,945
- Taxable income
- $1,321
- Est. tax owed @ 24.0%
- −$317
- After-tax cash flow
- $3,632/yr
For passive investors: Depreciation is non-cash, so a rental often shows a tax loss while cash-flowing — sheltering income. Rental losses are passive: they offset passive income freely, and up to $25,000/yr can offset ordinary (W-2) income if you actively participate and your MAGI is under $100k (phasing out to $0 by $150k); unused losses carry forward. On sale, claimed depreciation is recaptured at up to 25%, and gains may owe capital-gains tax (a 1031 exchange can defer both). Figures are a year-1 estimate at your 24.0% rate — not tax advice; consult a CPA.
Schools (NCES district)
- District
- Spokane School District
- NCES district ID
- 5308250
- Math proficiency
- 47% ▲ 1.00%
- Reading proficiency
- 58% ▲ 1.00%
- Median HH income
- $43,187
- Composite
- 46.1/100
- National rank
- #5477
- State rank
- #136 of 291 in WA
Livability — Spokane
- Score
- 80/100
- State rank
- #93
- US rank
- #1822
Category grades
Schools grade is shown separately in the Schools card above.
Census & demographics
- Census place
- Spokane, WA
- County
- Spokane County · 496,401 people
- City population
- 298,820
- Metro
- Spokane-Spokane Valley, WA
- Population (ZIP)
- 21,441
- Household income
- $73,620
- Rent vs Own
- Severe rent burden
- 630.0
Population outlook (Spokane County) Hauer SSP2
- Today (2025)
- 531,314 people
- By 2030
- 549,278 · +3.4%
- By 2040
- 577,822 · +8.8%
- By 2050
- 598,188 · +12.6%
- By 2075
- 630,744 · +18.7%
- By 2100
- 622,360 · +17.1%
Race, ethnicity, and origin ACS 2023
- Neighborhood character
- Predominantly White (79%)
- Race & ethnicity
- White 79% Two or more races 10% Hispanic / Latino 8% Asian 4% Pacific Islander 1% Native American 1%
- Hispanic origin (detail)
- Mexican 6%
- Common ancestry
- Portuguese 4% Scotch-Irish 4% Iranian 3%
- Foreign-born
- 12% · Canada, Vietnam
- Languages at home
- 85% English-only · Russian/Polish/Slavic 6% Spanish 3% Other Asian/Pacific 2%
Political lean MEDSL · Spokane
- 2024 margin
- Toss-up / Even · D 46.0% · R 51.0% · Other 3.0%
- 2008→2024 swing
- -3.8pp toward R · 2008: -1.1pp · 2024: -5.0pp
- All cycles
- 2024: R+5.0 2020: R+4.3 2016: R+8.3 2012: R+6.3 2008: R+1.1
Not yet ingested
- Civics
- —
Market trends
- HPI YoY
- ▼ -152.19%
- Current HPI
- 343.0283
- Rent YoY
- ▲ 9.52%
- Metro
- Spokane-Spokane Valley, WA
- State GDP YoY
- ▲ 4.65%
- F500 in state
- 22
Industry mix (Fortune 500 HQ in WA)
| Industry | F500 HQs | Revenue |
|---|---|---|
| Retail | 2 | $269B |
|
||
| Technology / Retail | 1 | $638B |
|
||
| Technology | 1 | $245B |
|
||
| Telecommunications | 1 | $38B |
|
||
| Food / Beverage | 1 | $36B |
|
||
| Automotive / Trucks | 1 | $34B |
|
||
Price history
+209.1% since first listed5 events — show timeline
- 2026-05-01 Price Changed $170,000 SPOKANEMLS as Distributed by MLS Grid
- 2026-05-01 Price Changed $175,000 SPOKANEMLS as Distributed by MLS Grid
- 2026-03-23 Listed $180,000 SPOKANEMLS as Distributed by MLS Grid
- 2014-03-04 Sold (MLS) $52,000 SPOKANEMLS as Distributed by MLS Grid
- 2013-05-18 Listed $55,000 SPOKANEMLS as Distributed by MLS Grid
Property tax history
-5.3%/yrLatest (2026): $311 · -79.8% YoY. Source: county tax records.
Cash-flow waterfall
monthlySold comps — $/sqft
last 12 mo · ≤1 miLoading sold comps…