259 Three Mile Creek Rd · Rosiclare, IL
Flood risk 1/10 · Minimal
- FEMA flood zone
- X (unshaded)
- Chance of flooding over 30 yrs
- 0.0%
- Est. flood insurance / yr
- $507 – $1,088
Fire risk 1/10 · Minimal
- Est. fire insurance / yr
- $804 – $1,492
Heat risk 5/10 · Moderate
- Hot days now (above 107°F)
- 7 days/yr
- Hot days in 30 yrs
- 20 days/yr
Wind risk 3/10 · Minor
- Chance of severe wind over 30 yrs
- 4.0%
Air-quality risk 2/10 · Minimal
- Unhealthy air days now
- 1 days/yr
- Unhealthy air days in 30 yrs
- 2 days/yr
Risk factors via First Street. Map © Google.
Why this score? — see what drove the B grade
The composite is a weighted blend of 9 inputs, each scored 0–100. Each bar is that input's sub-score; the figure is the points it added to the 100-point composite (weight × sub-score).
- Cash flow +27.1/30.0
- ARV discount +15.0/15.0
- DSCR +9.4/10.0
- 1% rule +7.1/10.0
- Appreciation +5.0/10.0
- Livability +3.6/5.0
- Rent growth +2.5/5.0
- Condition / age +2.5/5.0
- Schools +1.0/10.0
$109,900
🖨 Deal sheet 📄 Offer letter ✓ Due diligence
Listing remarks
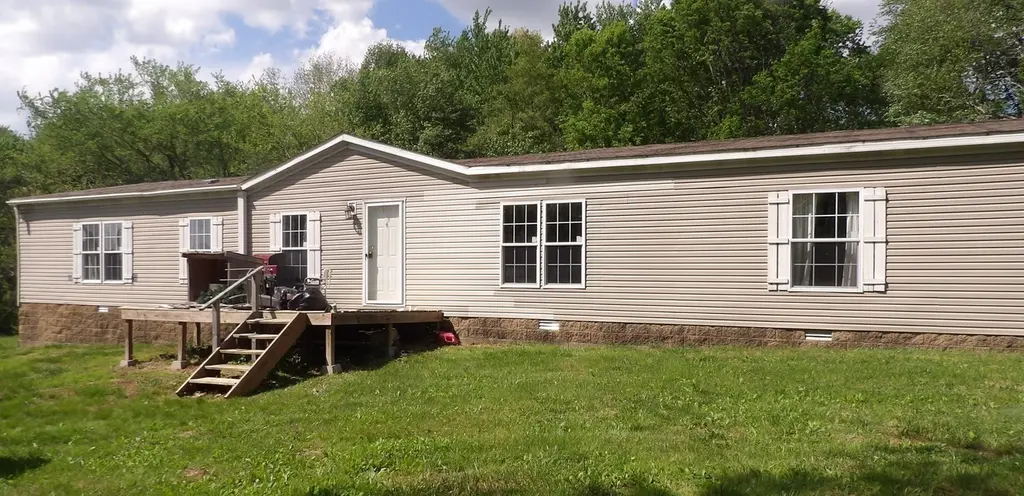
Situated in the small town of Rosiclare right on the Ohio River, this property is your opportunity for a peaceful getaway of your own. Just 45 minutes to Shawnee National Forest, this is a prime location for outdoor activities, such as hiking, camping, boating, hunting, etc. This property features a 1950sqft manufactured home with 4 bedrooms and 2 bathrooms and sits on 5.9 acres of beautiful southern Illinois land. Whether you’re looking for a vacation home, hunting cabin, or full time residence, this property is a great find!
Key facts
- 5.95 acre lot
- Parking
- Built 2017
Property features AI
Exterior
- Parking: No garage; Gravel parking
- Utilities: Public water available; Septic system
- Home design: Single family residence; Built in 2017; Approximately 1950 building area
- Construction: Shingle roof; Fleetwood Sandalwood mobile home make/model listed
- Exterior features: Level lot; Irregular lot dimensions
Interior
- Kitchen: Eat-in kitchen
- Bedrooms: 4 bedrooms; Bedrooms include egress windows; Bedroom sizes on main level: 26×20, 15×15, 15×15, 12×12
- Flooring: Carpet in several bedrooms; Laminate flooring in kitchen and one bedroom
- Bathrooms: 2 full bathrooms
- Heating & cooling: Electric heating
- Interior features: Dishwasher; No fireplaces
Neighborhood map
What this means for you Summary
Snapshot
- This is a 4-bed/2.0-bath single-family listed at $110k.
Deal economics
- At list price, monthly cash flow is $313 ($4k/yr) — positive.
- The deal already cash-flows at list — no discount required.
- Meets the 1% rule at list price ($1k rent vs $110k).
- Recommended offer: $108k (1.5% below list) — sets the bar for market timing.
Location & tenants
- Location reads 72/100 on livability (#320 in IL) — a middle-class / working-renter tenant base. Strengths: cost of living A+, housing A+, health & safety A+; Watch: amenities F, commute F, employment D-.
- Hardin County CUSD 1 (rural): math 7% / reading 17% proficiency, ranked #564 of 620 in IL (top 91%) — low school quality limits family demand, transient renter base, plan for 1-2y turnover.
- Zoned schools: Hardin County High School (math 5% / reading 24%, grade F, #473 of 693 statewide, top 69%, 161 students, 0% FRL) — zoned schools average 0% FRL vs 52% district-wide (52 pts lower); this property's tenant base skews higher-income than the district average.
- Market conditions: 1 active listings in the ZIP.
Forward outlook
- In year one you build about $4k of equity ($760 loan paydown + $3k appreciation (3.0% local appreciation)).
- Hardin County population projected at -26% by 2050 — secular population decline; favor cash flow + early exit over multi-decade hold.
- At projected returns (3.0% appreciation + 3.0% rent growth), your $31k cash investment doubles in ~4 years — after that, you're playing with house money.
- By year 8, paydown + projected appreciation supports a ~$30k cash-out refi (75% LTV) — recoverable capital for the next deal without selling this one.
Negotiation context
- It's been on market 22 days — a 2% lower offer ($108k) is reasonable based on typical stale-listing flexibility.
Risks & watch-outs
- Climate carrying-cost: extreme-heat days projected 7→20/yr by 2055 (HVAC capex compounding) — expect insurance premiums to compound above CPI over the hold.
Questions for the listing agent
- Is there a deadline driving the sale (1031 exchange, divorce, estate, relocation)? That informs how much negotiation room exists.
- Schools are F-rated, which usually means shorter tenancies and higher turnover. Who's the typical renter profile here, and what's been the actual vacancy rate?
- What's the average days-on-market for RENTAL listings here right now (not sales)? A rising rental-DOM trend means longer vacancies and softer asking-rent achievability than the comps imply.
- What's the recent tenant-quality profile in this submarket — average credit score on applications, eviction rate, late-payment / NSF rate, and stable-employment percentage? A property-management company in the area should have these aggregated.
- How much new for-sale + rental construction is in the pipeline within 1–3 miles? Heavy new supply typically softens prices + rents 12–24 months out; constrained supply supports both.
Investment metrics
- 1% rule
- 1.21% ✓
- Cap rate
- 9.71%
- Cash-on-cash
- 12.19%
- DSCR
- 1.54
- GRM
- 6.9
CMA / ARV
- ARV (median comp)
- $178,199
- List price
- $109,900
- Delta
- -32.66%
- Verdict
- UNDERPRICED
- Comps
- 2 within 1.0 mi
Projected returns pro-forma
3.0% appreciation · 3.0% rent growth · sell at horizon
- IRR
- 18.9%
- Equity multiple
- 2.08×
- Total profit
- $33,156
- Equity at exit
- $49,416
- IRR
- 20.2%
- Equity multiple
- 3.93×
- Total profit
- $90,152
- Equity at exit
- $76,156
Cash invested: $30,772 (down + closing). Projections, not guarantees.
Landlord ↔ Tenant lean methodology
- Overall (STATE)
- 43 Moderately Tenant-Leaning
- State Illinois
- 43 Moderately Tenant-Leaning · D+7
- County
- — inherits STATE
- City
- — inherits STATE
ZIP-level market 62982-0000
- Active inventory
- 1
- Price-to-rent
- 6.9×
Monthly cashflow live
- Estimated rent
- $1,328 medium interval (Pro) →
- Mortgage (P&I)
- −$576
- Tax from tax record
- −$114 /mo · $1,369/yr
- Insurance
- −$46
- HOA
- −$0
- Vacancy / Maint / Mgmt
- −$279
- Net cashflow
- $313
Break-even live
UW: 25.0% down · 7.5% · 30yr · 1.5% tax · 5.0% vac · 8.0% maint · 8.0% mgmt
Financing live
Cash to close
- Down payment
- $27,475
- Closing costs
- $3,297
- Reserves months
- —
- Total cash needed
- —
Loan-product check · same deal, 3 products live
Conventional
25% down · 7.5% · 30yr
- Down + closing
- —
- Monthly P&I
- —
- Monthly cashflow
- —
- DSCR
- —
- Eligible?
- —
Personal DTI + credit; lowest rate.
DSCR
20% down · 8.5% · 30yr
- Down + closing
- —
- Monthly P&I
- —
- Monthly cashflow
- —
- DSCR
- —
- Eligible?
- —
No personal income docs; deal must DSCR.
Hard money
10% down · 12.0% · 12mo
- Down + closing
- —
- Monthly P&I
- —
- Monthly cashflow
- —
- DSCR
- —
- Eligible?
- —
Short-term bridge; refi at stabilization.
Listing history 18 events
-
2026-06-18price $109,900 Active 22 DOM
-
2026-06-18days on market $114,900 Active 22 DOM
-
2026-06-17days on market $114,900 Active 21 DOM
-
2026-06-16days on market $114,900 Active 20 DOM
-
2026-06-15days on market $114,900 Active 19 DOM
-
2026-06-13days on market $114,900 Active 17 DOM
-
2026-06-12pricedays on market $114,900 Active 16 DOM
-
2026-06-09days on market $119,500 Active 13 DOM
-
2026-06-08days on market $119,500 Active 12 DOM
-
2026-06-07days on market $119,500 Active 11 DOM
-
2026-06-05days on market $119,500 Active 9 DOM
-
2026-06-04remarks 532-char remark
-
2026-06-04days on market $119,500 Active 7 DOM
-
2026-06-02days on market $119,500 Active 6 DOM
-
2026-06-01days on market $119,500 Active 5 DOM
-
2026-05-31days on market $119,500 Active 4 DOM
-
2026-05-31days on market $119,500 Active 3 DOM
-
2026-05-18historical
ⓘ Source: listings_history table (triggers on properties + properties_extension) + one-shot
backfill from property_details.listing_events for pre-trigger history.
Tax reassessment forecast IL · Partial reset (capped growth)
- Current annual tax
- $1,369 · $114/mo
- Projected year-2 tax
- $1,932 · $161/mo
- Expected delta
- +$563/yr (+$47/mo · 41.1%)
ⓘ Screening estimate from a state-policy table — verify with the county assessor before closing.
Climate risk First Street
- Flood 1/10 Low FEMA zone X (unshaded) · 0% chance over 30 yrs
- Wildfire 1/10 Low
- Heat 5/10 Major 7 d/yr ≥107°F today · 20 d/yr by 30 yrs out
- Wind 3/10 Moderate 4% chance of damaging wind over 30 yrs
- Air quality 2/10 Low 1 unhealthy d/yr today · 2 by 30 yrs out
Nearby sold comps map
Loading sold comps map…
Walkable amenities ~0.75 mi
Loading nearby amenities…
Taxation est. · year 1
- Rental income
- $15,932
- − Mortgage interest
- −$6,156
- − Property taxes
- −$1,369
- − Insurance
- −$550
- − Repairs & maintenance
- −$1,275
- − Management
- −$1,275
- − Depreciation
- −$3,197
- Taxable income
- $2,111
- Est. tax owed @ 24.0%
- −$507
- After-tax cash flow
- $3,245/yr
For passive investors: Depreciation is non-cash, so a rental often shows a tax loss while cash-flowing — sheltering income. Rental losses are passive: they offset passive income freely, and up to $25,000/yr can offset ordinary (W-2) income if you actively participate and your MAGI is under $100k (phasing out to $0 by $150k); unused losses carry forward. On sale, claimed depreciation is recaptured at up to 25%, and gains may owe capital-gains tax (a 1031 exchange can defer both). Figures are a year-1 estimate at your 24.0% rate — not tax advice; consult a CPA.
Schools (NCES district)
- District
- Hardin County CUSD 1
- NCES district ID
- 1718200
- Math proficiency
- 7% ▼ -6.00%
- Reading proficiency
- 17% ▼ -6.00%
- Median HH income
- $37,617
- Composite
- 10.06/100
- National rank
- #9807
- State rank
- #564 of 620 in IL
Livability — Rosiclare
- Score
- 72/100
- State rank
- #320
- US rank
- #6346
Category grades
Schools grade is shown separately in the Schools card above.
Census & demographics
No demographic data for this ZIP.
Market trends
- HPI YoY
- —
- Current HPI
- —
- Rent YoY
- —
- Metro
- —
- State GDP YoY
- ▲ 1.59%
- F500 in state
- 60
Industry mix (Fortune 500 HQ in IL)
| Industry | F500 HQs | Revenue |
|---|---|---|
| Insurance | 4 | $201B |
|
||
| Consumer Goods | 4 | $87B |
|
||
| Industrial Machinery | 3 | $64B |
|
||
| Healthcare | 2 | $55B |
|
||
| Retail / Pharmacy | 1 | $148B |
|
||
| Agriculture / Food | 1 | $86B |
|
||
Price history
-8.0% since first listed5 events — show timeline
- 2026-06-18 Price Changed $109,900 RMLSA as Distributed by MLS Grid
- 2026-06-11 Price Changed $114,900 RMLSA as Distributed by MLS Grid
- 2026-05-27 Listed $119,500 RMLSA as Distributed by MLS Grid
- 2026-05-22 Coming Soon $119,500 RMLSA as Distributed by MLS Grid
- 2026-05-18 Listing Removed — MRED as Distributed by MLS Grid
Property tax history
+28.8%/yrLatest (2024): $1,369 · -1.0% YoY. Source: county tax records.
Cash-flow waterfall
monthlySold comps — $/sqft
last 12 mo · ≤1 miLoading sold comps…