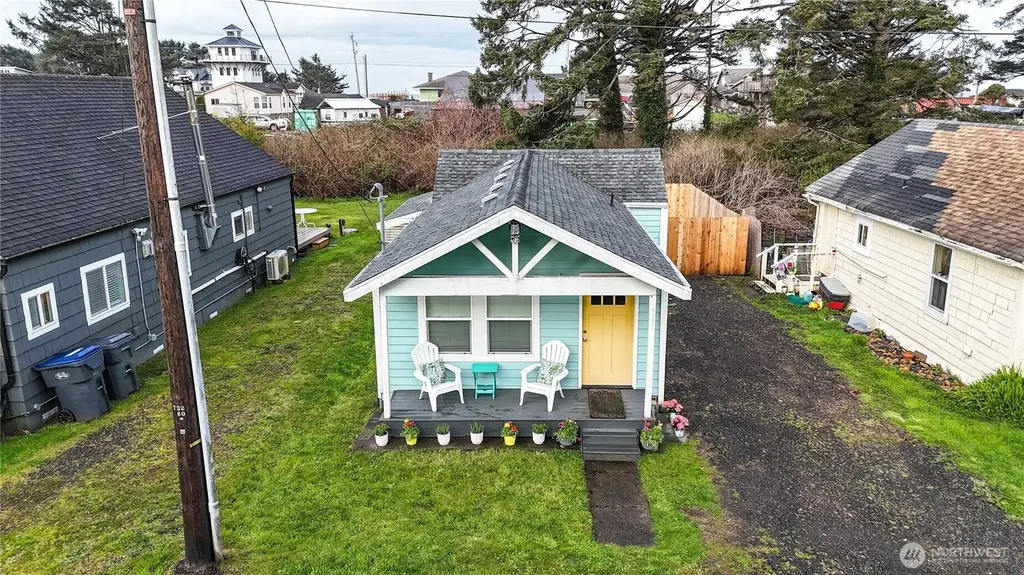
4787 forwood Ave · Moclips, WA
Flood risk 1/10 · Minimal
- FEMA flood zone
- X (unshaded)
- Chance of flooding over 30 yrs
- 0.0%
- Est. flood insurance / yr
- $507 – $1,088
Fire risk 1/10 · Minimal
- Est. fire insurance / yr
- $604 – $1,122
Heat risk 1/10 · Minimal
- Hot days now (above 76°F)
- 7 days/yr
- Hot days in 30 yrs
- 13 days/yr
Wind risk 1/10 · Minimal
- Chance of severe wind over 30 yrs
- —
Air-quality risk 6/10 · Moderate
- Unhealthy air days now
- 6 days/yr
- Unhealthy air days in 30 yrs
- 6 days/yr
Risk factors via First Street. Map © Google.
Why this score? — see what drove the D grade
The composite is a weighted blend of 9 inputs, each scored 0–100. Each bar is that input's sub-score; the figure is the points it added to the 100-point composite (weight × sub-score).
- ARV discount +15.0/15.0
- Cash flow +9.7/30.0
- Appreciation +4.1/10.0
- Schools +3.4/10.0
- DSCR +2.7/10.0
- Rent growth +2.5/5.0
- Condition / age +2.5/5.0
- Livability +2.1/5.0
- 1% rule +1.8/10.0
$260,000
🖨 Deal sheet (PDF) 📄 Offer letter ✓ Due diligence
Listing remarks
Stylishly decorated by a professional designer with a breezy coastal flair, this charming cottage is the kind of place that makes you exhale the moment you walk in. Light, curated, and fully furnished, it feels like a true retreat from the everyday. Beach access is just a ten-minute walk from your front door, putting razor clamming, beachcombing, and epic Pacific sunsets well within reach. Seabrook is just minutes away with its boutique shops, restaurants, and beloved Pacific Northwest resort-town atmosphere -- all the charm, without the Seabrook price tag. Whether you are searching for your own personal slice of the coast or a turnkey vacation rental investment, this cottage delivers on bo
Key facts
- 3,238 sq ft lot
- 2 parking spots
- Built 1957
Neighborhood map
What this means for you Summary
Snapshot
- This is a 1-bed/1.0-bath single-family listed at $260k.
Deal economics
- At list price, monthly cash flow is $-172 ($-2k/yr) — negative.
- To cash-flow at today's rent, offer at most $230k (11.7% below list).
- To meet the 1% rule (rent ≥ 1% of price), the offer needs to be $178k (31.6% below list).
- Recommended offer: $178k (31.6% below list) — sets the bar for 1% rule.
Location & tenants
- Location reads 41/100 on livability (#607 in WA) — a working-class tenant base; expect higher turnover. Strengths: crime A, cost of living B+; Watch: commute C-, health & safety C-, amenities F.
- North Beach School District (rural): math 32% / reading 44% proficiency, ranked #236 of 291 in WA (top 81%) — families likely to look elsewhere, expect single-tenant / working-renter base with shorter leases; 63% free/reduced lunch — lower-income household profile, screen leases tightly.
- Zoned schools: Pacific Beach Elementary School (110 students, 84% FRL); North Beach Junior High School (162 students, 78% FRL); North Beach Senior High School (177 students, 63% FRL).
- Market conditions: 105 active listings in the ZIP; 297 units permitted in Grays Harbor County in 2024 (17 in 5+ unit buildings).
Forward outlook
- Local home prices are declining (-1.9%/yr); year-one equity from $2k of loan paydown is wiped out by about $5k of value loss. Plan a longer hold.
- Grays Harbor County population projected at -24% by 2050 — secular population decline; favor cash flow + early exit over multi-decade hold.
Negotiation context
- It's been on market 81 days — a 6% lower offer ($244k) is reasonable based on typical stale-listing flexibility.
- 2 sale attempts since 9y ago; this cycle's ask has dropped $15k (5%) from the opening price — seller is motivated, your offer sets the floor, not the list.
- Current owner paid $56k; list at $260k implies a 364% gain — meaningful room to come down on a strong offer.
Risks & watch-outs
- Watch-outs: built in 1957 — expect roof / HVAC / electrical / plumbing capex.
Questions for the listing agent
- What do current leases actually rent for vs. the listed asking? Can we see a recent rent roll and the last 12 months of T-12 income?
- It's been on market 81 days. Have you received any prior offers? Is the seller open to a 32% concession, seller financing, or rate buy-down credit?
- Built in 1957 — when were the roof, HVAC, electrical panel, plumbing, and water heater last replaced?
- Why hasn't it sold? Are there any deal-killer items the seller is aware of (foundation, flood, title, zoning, code violations)?
- Is there a deadline driving the sale (1031 exchange, divorce, estate, relocation)? That informs how much negotiation room exists.
- Schools are F-rated, which usually means shorter tenancies and higher turnover. Who's the typical renter profile here, and what's been the actual vacancy rate?
- The area grade is low — what's the realistic commute time and amenity access for the typical tenant pool here? Any planned neighborhood developments (good or bad) we should know about?
- What's the average days-on-market for RENTAL listings here right now (not sales)? A rising rental-DOM trend means longer vacancies and softer asking-rent achievability than the comps imply.
- What's the recent tenant-quality profile in this submarket — average credit score on applications, eviction rate, late-payment / NSF rate, and stable-employment percentage? A property-management company in the area should have these aggregated.
- How much new for-sale + rental construction is in the pipeline within 1–3 miles? Heavy new supply typically softens prices + rents 12–24 months out; constrained supply supports both.
Investment metrics
- 1% rule
- 0.68% ✗
- Cap rate
- 5.50%
- Cash-on-cash
- -2.83%
- DSCR
- 0.87
- GRM
- 12.2
CMA / ARV
- ARV (median comp)
- $417,432
- List price
- $260,000
- Delta
- -37.71%
- Verdict
- UNDERPRICED
- Comps
- 5 within 1.0 mi
Show comp detail 1 sale within ~0.75 mi
| Address | Dist | Beds/Ba | Sqft | Sold | Price | $/sf | Match |
|---|---|---|---|---|---|---|---|
| 48300 Pacific Ave | 0.33mi | 1/1.0 | 576 (-8%) | 6mo | $420,000 | $729 | 67 |
Match score weights: distance 35% · size 25% · config 20% · recency 20%. Top-matched comps best support the ARV.
Projected returns pro-forma
-1.88% appreciation · 3.0% rent growth · sell at horizon
- IRR
- -14.2%
- Equity multiple
- 0.44×
- Total profit
- $-40,810
- Equity at exit
- $51,914
- IRR
- -6.9%
- Equity multiple
- 0.46×
- Total profit
- $-38,959
- Equity at exit
- $45,725
Cash invested: $72,800 (down + closing). Projections, not guarantees.
Landlord ↔ Tenant lean methodology
- Overall (STATE)
- 28 Tenant-Leaning
- State Washington
- 28 Tenant-Leaning · D+8
- County
- — inherits STATE
- City
- — inherits STATE
ZIP-level market 98571
- Home prices YoY
- -0.8%
- Active inventory
- 105
- Price-to-rent
- 12.2×
Monthly cashflow live
- Estimated rent
- $1,779 medium interval (Pro) →
- Mortgage (P&I)
- −$1,363
- Tax from tax record
- −$106 /mo · $1,266/yr
- Insurance
- −$108
- HOA
- −$0
- Vacancy / Maint / Mgmt
- −$374
- Net cashflow
- $-172
Break-even live
Sensitivity live
| Price | -10% $-24 | -5% $-98 | +0% $-172 | +5% $-245 | +10% $-319 |
|---|---|---|---|---|---|
| Rent | -10% $-312 | -5% $-242 | +0% $-172 | +5% $-101 | +10% $-31 |
| Rate | -1.0pp $-41 | -0.5pp $-105 | base $-172 | +0.5pp $-239 | +1.0pp $-308 |
UW: 25.0% down · 7.5% · 30yr · 1.5% tax · 5.0% vac · 8.0% maint · 8.0% mgmt
Financing live
Cash to close
- Down payment
- $65,000
- Closing costs
- $7,800
- Reserves months
- —
- Total cash needed
- —
Loan-product check · same deal, 3 products live
Conventional
25% down · 7.5% · 30yr
- Down + closing
- —
- Monthly P&I
- —
- Monthly cashflow
- —
- DSCR
- —
- Eligible?
- —
Personal DTI + credit; lowest rate.
DSCR
20% down · 8.5% · 30yr
- Down + closing
- —
- Monthly P&I
- —
- Monthly cashflow
- —
- DSCR
- —
- Eligible?
- —
No personal income docs; deal must DSCR.
Hard money
10% down · 12.0% · 12mo
- Down + closing
- —
- Monthly P&I
- —
- Monthly cashflow
- —
- DSCR
- —
- Eligible?
- —
Short-term bridge; refi at stabilization.
Listing history 22 events
-
2026-06-22days on market $260,000 Active 81 DOM
-
2026-06-19days on market $260,000 Active 78 DOM
-
2026-06-18days on market $260,000 Active 77 DOM
-
2026-06-17days on market $260,000 Active 76 DOM
-
2026-06-16days on market $260,000 Active 75 DOM
-
2026-06-15days on market $260,000 Active 74 DOM
-
2026-06-14days on market $260,000 Active 72 DOM
-
2026-06-12days on market $260,000 Active 71 DOM
-
2026-06-09days on market $260,000 Active 68 DOM
-
2026-06-08days on market $260,000 Active 67 DOM
-
2026-06-07days on market $260,000 Active 66 DOM
-
2026-06-05days on market $260,000 Active 63 DOM
-
2026-06-03days on market $260,000 Active 62 DOM
-
2026-06-02days on market $260,000 Active 61 DOM
-
2026-06-01days on market $260,000 Active 60 DOM
-
2026-05-31days on market $260,000 Active 59 DOM
-
2026-05-30days on market $260,000 Active 58 DOM
-
2026-04-02$275,000 Active
-
2017-09-06soldstatus $56,000 Sold
-
2017-07-24status Pending Inspection
-
2017-07-21status Pending
-
2017-07-03$62,000 Active
ⓘ Source: listings_history table (triggers on properties + properties_extension) + one-shot
backfill from property_details.listing_events for pre-trigger history.
Tax reassessment forecast WA · Resets to sale price
- Current annual tax
- $1,266 · $106/mo
- Projected year-2 tax
- $2,548 · $212/mo
- Expected delta
- +$1,282/yr (+$107/mo · 101.2%)
ⓘ Screening estimate from a state-policy table — verify with the county assessor before closing.
Climate risk First Street
- Flood 1/10 Low FEMA zone X (unshaded) · 0% chance over 30 yrs
- Wildfire 1/10 Low
- Heat 1/10 Low 7 d/yr ≥76°F today · 13 d/yr by 30 yrs out
- Wind 1/10 Low
- Air quality 6/10 Major 6 unhealthy d/yr today · 6 by 30 yrs out
Nearby sold comps map
Loading sold comps map…
Walkable amenities ~0.75 mi
Loading nearby amenities…
Taxation est. · year 1
- Rental income
- $21,353
- − Mortgage interest
- −$14,564
- − Property taxes
- −$1,266
- − Insurance
- −$1,300
- − Repairs & maintenance
- −$1,708
- − Management
- −$1,708
- − Depreciation
- −$7,564
- Taxable loss
- −$6,758
- Est. tax savings @ 24.0%
- +$1,622
- After-tax cash flow
- $-437/yr
For passive investors: Depreciation is non-cash, so a rental often shows a tax loss while cash-flowing — sheltering income. Rental losses are passive: they offset passive income freely, and up to $25,000/yr can offset ordinary (W-2) income if you actively participate and your MAGI is under $100k (phasing out to $0 by $150k); unused losses carry forward. On sale, claimed depreciation is recaptured at up to 25%, and gains may owe capital-gains tax (a 1031 exchange can defer both). Figures are a year-1 estimate at your 24.0% rate — not tax advice; consult a CPA.
Schools (NCES district)
- District
- North Beach School District
- NCES district ID
- 5305700
- Math proficiency
- 32% ▼ -4.00%
- Reading proficiency
- 44% ▬ 0.00%
- Median HH income
- $40,966
- Composite
- 34.46/100
- National rank
- #10153
- State rank
- #236 of 291 in WA
Livability — Moclips
- Score
- 41/100
- State rank
- #607
- US rank
- #27130
Category grades
Schools grade is shown separately in the Schools card above.
Census & demographics
- Census place
- Moclips, WA
- City population
- 98
- Population (ZIP)
- 52
Population outlook (Grays Harbor County) Hauer SSP2
- Today (2025)
- 66,443 people
- By 2030
- 63,255 · -4.8%
- By 2040
- 56,466 · -15.0%
- By 2050
- 50,516 · -24.0%
- By 2075
- 39,296 · -40.9%
- By 2100
- 31,142 · -53.1%
Race, ethnicity, and origin ACS 2023
- Neighborhood character
- Predominantly White (100%)
- Race & ethnicity
- White 100%
Political lean MEDSL · Grays Harbor
- 2024 margin
- Lean R (+6.0) · D 45.6% · R 51.6% · Other 2.8%
- 2008→2024 swing
- -20.6pp toward R · 2008: 14.6pp · 2024: -6.0pp
- All cycles
- 2024: R+6.0 2020: R+6.6 2016: R+7.1 2012: D+14.0 2008: D+14.6
Not yet ingested
- Civics
- —
Market trends
- HPI YoY
- ▼ -1.88%
- Current HPI
- 231.3572
- Rent YoY
- —
- Metro
- —
- State GDP YoY
- ▲ 4.65%
- F500 in state
- 22
Industry mix (Fortune 500 HQ in WA)
| Industry | F500 HQs | Revenue |
|---|---|---|
| Retail | 2 | $269B |
|
||
| Technology / Retail | 1 | $638B |
|
||
| Technology | 1 | $245B |
|
||
| Telecommunications | 1 | $38B |
|
||
| Food / Beverage | 1 | $36B |
|
||
| Automotive / Trucks | 1 | $34B |
|
||
Price history
+343.5% since first listed5 events — show timeline
- 2026-04-02 Listed $275,000 NWMLS as Distributed by MLS Grid
- 2017-09-06 Sold (MLS) $56,000 NWMLS as Distributed by MLS Grid
- 2017-07-24 Pending — NWMLS as Distributed by MLS Grid
- 2017-07-21 Pending — NWMLS as Distributed by MLS Grid
- 2017-07-03 Listed $62,000 NWMLS as Distributed by MLS Grid
Property tax history
+8.8%/yrLatest (2026): $1,266 · +2.3% YoY. Source: county tax records.
Cash-flow waterfall
monthlySold comps — $/sqft
last 12 mo · ≤1 miLoading sold comps…