 🏷️ Likely Rental
75 29th St · San Francisco, CA
Flood risk 4/10 · Minor
- FEMA flood zone
- X (unshaded)
- Chance of flooding over 30 yrs
- 0.22%
- Est. flood insurance / yr
- $507 – $1,088
Fire risk 1/10 · Minimal
- Est. fire insurance / yr
- $659 – $1,223
Heat risk 2/10 · Minimal
- Hot days now (above 78°F)
- 8 days/yr
- Hot days in 30 yrs
- 19 days/yr
Wind risk 1/10 · Minimal
- Chance of severe wind over 30 yrs
- —
Air-quality risk 7/10 · Major
- Unhealthy air days now
- 13 days/yr
- Unhealthy air days in 30 yrs
- 13 days/yr
Risk factors via First Street. Map © Google.
Why this score? — see what drove the B grade
The composite is a weighted blend of 9 inputs, each scored 0–100. Each bar is that input's sub-score; the figure is the points it added to the 100-point composite (weight × sub-score).
- Cash flow +28.1/30.0
- DSCR +10.0/10.0
- 1% rule +7.7/10.0
- ARV discount +7.5/15.0
- Rent growth +5.0/5.0
- Schools +5.0/10.0
- Livability +3.8/5.0
- Condition / age +3.8/5.0
- Appreciation +0.0/10.0
$499,000
🖨 Deal sheet 📄 Offer letter ✓ Due diligence
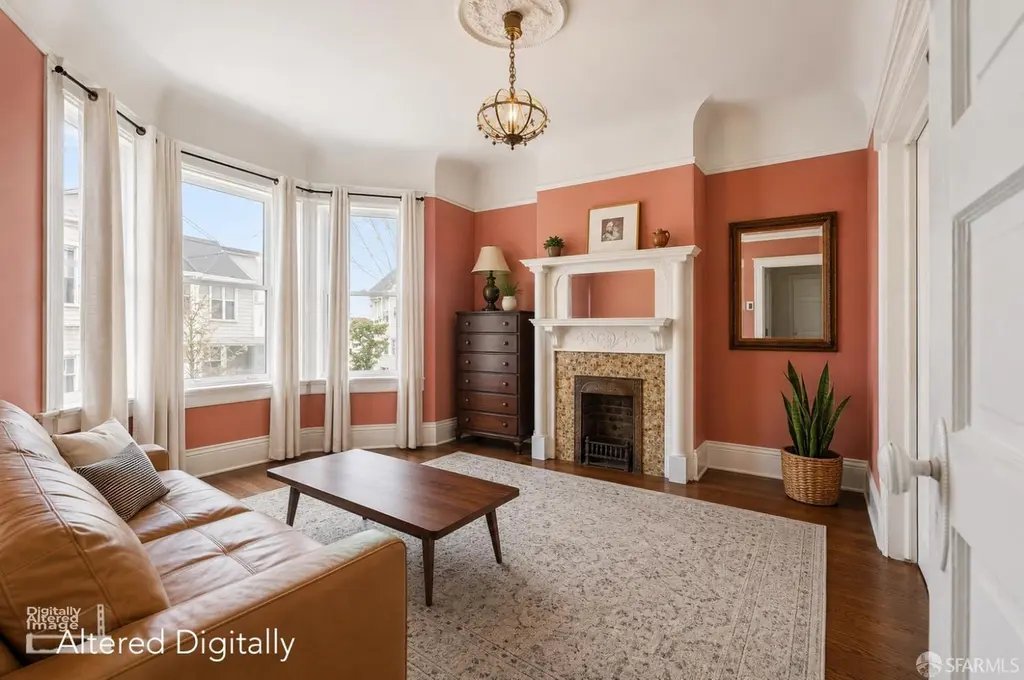
Listing remarks
After being carefully stewarded by the same family for over sixty years, this stunning Edwardian is ready for someone new to take the helm. Maybe that someone is you? This downstairs flat is currently tenant occupied @ 2936.74/month. The flexible five room floor plan provides two or three bedrooms a large kitchen, one split bath, separate laundry porch with access to the shared back yard. The location is amazing with access to Bernal, Noe and Glen Park all within reach. You can take an evening stroll to the top of Bernal or spend time at the Outer Noe Rec Center just as easily. Enjoy brunch of Waffles at Four Chairs, a classic Italian dinner at Emmy's Spaghetti Shack or high end sushi a
Key facts
- Shared back yard
- Access to noe
- Large kitchen
Tags
Neighborhood map
What this means for you Summary
Snapshot
- This is a 2-bed/1.0-bath single-family listed at $499k. Condition is rated good.
Deal economics
- At list price, monthly cash flow is $2k ($19k/yr) — positive.
- The deal already cash-flows at list — no discount required.
- Meets the 1% rule at list price ($6k rent vs $499k).
- Cap rate 10.1% vs local median 2.1% in San Francisco — top-decile yield for the area; either an underpriced asset or a hidden risk that comps aren't pricing in. Stress-test before assuming the spread holds.
Location & tenants
- Location reads 76/100 on livability (#90 in CA, #3,143 nationally) — a middle-class / working-renter tenant base. Strengths: amenities A+, commute A+, employment A+; Watch: crime F, cost of living F.
- San Francisco Unified (urban): math 50% / reading 56% proficiency, ranked #322 of 1,400 in CA (top 23%) — acceptable for families but not a draw, mixed tenant base, ~2y average lease.
- Market conditions: Rents rising fast (+14.5%/yr); 161 active listings in the ZIP; 40 comparable units currently listed for rent nearby; rentals at typical pace (median 24d on market — plan ~3-4 weeks tenant-placement turnaround); high-income renter base; 750 units permitted in San Francisco County in 2024 (688 in 5+ unit buildings).
- At $6,352/mo this rent would consume 48% of the median local household income ($158k/yr) (locally 2732% of renters already pay >50% of income on rent) — very limited rent-growth headroom before tenants either downsize or default.
Forward outlook
- Local home prices are declining (-3.0%/yr); year-one equity from $3k of loan paydown is wiped out by about $15k of value loss. Plan a longer hold.
- San Francisco County population projected at +39% by 2050 — long-run rental-demand tailwind backs the buy-and-hold thesis.
- At projected returns (-3.0% appreciation + 8.0% rent growth), your $140k cash investment doubles in ~7 years — after that, you're playing with house money.
Negotiation context
- Only 8 days on market — expect competitive offers; lowballing is unlikely to land.
Risks & watch-outs
- Watch-outs: built in 1908 — expect roof / HVAC / electrical / plumbing capex.
Questions for the listing agent
- Built in 1908 — when were the roof, HVAC, electrical panel, plumbing, and water heater last replaced?
- Is there a deadline driving the sale (1031 exchange, divorce, estate, relocation)? That informs how much negotiation room exists.
- Schools are B-rated — typically a magnet for longer-tenancy family renters. What's the average tenant stay here, and is there a school-zone premium baked into asking?
- Crime grade is F in this area — have there been break-ins, vandalism, or insurance claims at this property in the last 3 years? What carrier currently insures it and at what premium?
- What's the average days-on-market for RENTAL listings here right now (not sales)? A rising rental-DOM trend means longer vacancies and softer asking-rent achievability than the comps imply.
- What's the recent tenant-quality profile in this submarket — average credit score on applications, eviction rate, late-payment / NSF rate, and stable-employment percentage? A property-management company in the area should have these aggregated.
- How much new for-sale + rental construction is in the pipeline within 1–3 miles? Heavy new supply typically softens prices + rents 12–24 months out; constrained supply supports both.
Investment metrics
- 1% rule
- 1.27% ✓
- Cap rate
- 10.07%
- Cash-on-cash
- 13.48%
- DSCR
- 1.60
- GRM
- 6.5
CMA / ARV
- ARV (median comp)
- $1,535,746
- List price
- $499,000
- Delta
- -67.51%
- Verdict
- UNDERPRICED
- Comps
- 20 within 1.0 mi
Show comp detail 12 sales within ~0.75 mi
| Address | Dist | Beds/Ba | Sqft | Sold | Price | $/sf | Match |
|---|---|---|---|---|---|---|---|
| 117 Tiffany Ave | 0.10mi | 2/1.0 | 1,200 (-9%) | 2mo | $1,040,000 | $867 | 78 |
| 149 Anderson St | 0.44mi | 3/2.0 (+1) | 1,351 (+2%) | 1mo | $1,910,000 | $1,414 | 66 |
| 709 Eugenia Ave | 0.37mi | 2/1.0 | 1,200 (-9%) | 2mo | $1,750,000 | $1,458 | 66 |
| 1504 Noe St | 0.51mi | 2/1.0 | 1,237 (-7%) | 0mo | $1,545,000 | $1,249 | 65 |
| 286 Crescent Ave | 0.65mi | 3/1.0 (+1) | 1,319 (-0%) | 2mo | $1,200,000 | $910 | 62 |
| 97 Banks St | 0.55mi | 2/1.5 | 1,400 (+6%) | 2mo | $2,270,000 | $1,621 | 61 |
| 50 Manchester St | 0.46mi | 3/2.0 (+1) | 1,435 (+8%) | 1mo | $1,600,000 | $1,115 | 55 |
| 54 Bradford St | 0.70mi | 2/2.0 | 1,445 (+9%) | 3mo | $2,305,000 | $1,595 | 46 |
| 665 27th St | 0.73mi | 2/1.0 | 1,175 (-11%) | 3mo | $2,441,067 | $2,078 | 45 |
| 373 Chenery St | 0.61mi | 3/1.5 (+1) | 1,493 (+13%) | 1mo | $2,150,000 | $1,440 | 42 |
| 121 Bradford St | 0.73mi | 3/2.0 (+1) | 1,456 (+10%) | 2mo | $1,850,000 | $1,271 | 38 |
| 320 College Ave | 0.68mi | 3/2.0 (+1) | 1,500 (+13%) | 3mo | $1,650,000 | $1,100 | 35 |
Match score weights: distance 35% · size 25% · config 20% · recency 20%. Top-matched comps best support the ARV.
Projected returns pro-forma
-3.0% appreciation · 8.0% rent growth · sell at horizon
- IRR
- 9.1%
- Equity multiple
- 1.38×
- Total profit
- $52,785
- Equity at exit
- $74,403
- IRR
- 22.1%
- Equity multiple
- 3.35×
- Total profit
- $327,883
- Equity at exit
- $43,144
Cash invested: $139,720 (down + closing). Projections, not guarantees.
Landlord ↔ Tenant lean methodology
- Overall (CITY)
- 0 Strongly Tenant-Friendly
- State California
- 18 Strongly Tenant-Friendly · D+13
- County
- — inherits STATE
- City San Francisco
- 0 Strongly Tenant-Friendly · D+57
ZIP-level market 94110
- Rents YoY
- 14.5%
- Active inventory
- 161
- Price-to-rent
- 6.5×
Monthly cashflow live
- Estimated rent
- $6,352 high interval (Pro) →
- Mortgage (P&I)
- −$2,617
- Tax est. 1.5%
- −$624 /mo · $7,485/yr
- Insurance
- −$208
- HOA
- −$0
- Vacancy / Maint / Mgmt
- −$1,334
- Net cashflow
- $1,570
Break-even live
UW: 25.0% down · 7.5% · 30yr · 1.5% tax · 5.0% vac · 8.0% maint · 8.0% mgmt
Financing live
Cash to close
- Down payment
- $124,750
- Closing costs
- $14,970
- Reserves months
- —
- Total cash needed
- —
Loan-product check · same deal, 3 products live
Conventional
25% down · 7.5% · 30yr
- Down + closing
- —
- Monthly P&I
- —
- Monthly cashflow
- —
- DSCR
- —
- Eligible?
- —
Personal DTI + credit; lowest rate.
DSCR
20% down · 8.5% · 30yr
- Down + closing
- —
- Monthly P&I
- —
- Monthly cashflow
- —
- DSCR
- —
- Eligible?
- —
No personal income docs; deal must DSCR.
Hard money
10% down · 12.0% · 12mo
- Down + closing
- —
- Monthly P&I
- —
- Monthly cashflow
- —
- DSCR
- —
- Eligible?
- —
Short-term bridge; refi at stabilization.
Rent comps 40 comps
| Address | Beds | Baths | Sqft | Rent | $/sqft | DOM | Units | Dist |
|---|---|---|---|---|---|---|---|---|
| 79 Coleridge St San Francisco, CA | 3.0 | 2.0 | 1850 | $9,750 | $5.27 | 24d | 1 | 0.17mi |
| 1772 Dolores St #1 San Francisco, CA | 2.0 | 1.0 | 900 | $3,995 | $4.44 | 24d | 1 | 0.24mi |
| 317 29th St #304 San Francisco, CA | 1.0 | 1.0 | 882 | $4,995 | $5.66 | 24d | 1 | 0.30mi |
| 3645 25th St San Francisco, CA | 3.0 | 2.0 | 1100 | $7,000 | $6.36 | 43d | 1 | 0.43mi |
| 1394-1396 Sanchez St Unit 1394 San Francisco, CA | 2.0 | 1.0 | 1130 | $4,500 | $3.98 | 43d | 1 | 0.45mi |
| 1626 Noe St San Francisco, CA | 3.0 | 2.0 | 1870 | $12,000 | $6.42 | 24d | 1 | 0.52mi |
| 351-353 Richland Ave Unit 351 San Francisco, CA | 2.0 | 2.0 | 1147 | $5,950 | $5.19 | 24d | 1 | 0.59mi |
| 1043 Dolores St San Francisco, CA | 2.0 | 2.0 | 1012 | $7,500 | $7.41 | 2d | 1 | 0.62mi |
| 858 Capp St Unit 1794 San Francisco, CA | 2.0 | 2.5 | 1818 | $17,050 | $9.38 | 24d | 1 | 0.66mi |
| 3375 22nd St Unit 4 San Francisco, CA | 1.0 | 1.0 | 1000 | $3,995 | $4.00 | 15d | 1 | 0.76mi |
| 4325 Cesar Chavez St San Francisco, CA | 1.0 | 1.0 | 1200 | $5,000 | $4.17 | 43d | 1 | 0.82mi |
| 996 Noe St San Francisco, CA | 2.0 | 1.5 | 972 | $7,500 | $7.72 | 43d | 1 | 0.85mi |
| 5285 Diamond Heights Blvd San Francisco, CA | 1.0–2.0 | 1.0–2.0 | 805 | $6,437 | $8.00 | 2d | 5 | 0.88mi |
| 2 Fair Oaks St #4 San Francisco, CA | 3.0 | 1.0 | 1513 | $9,900 | $6.54 | 18d | 1 | 0.88mi |
| 922 Valencia St Unit A San Francisco, CA | 3.0 | 2.5 | 1250 | $8,450 | $6.76 | 43d | 1 | 0.97mi |
| 922 Valencia St San Francisco, CA | 3.0 | 3.0 | 1100 | $8,450 | $7.68 | 43d | 1 | 0.97mi |
| 922 Valencia St Apt C San Francisco, CA | 3.0 | 2.5 | 1300 | $7,950 | $6.12 | 43d | 1 | 0.97mi |
| 569-571 Capp St San Francisco, CA | 3.0 | 1.0 | 1600 | $6,995 | $4.37 | 2d | 1 | 0.97mi |
| 783 Guerrero St #779 San Francisco, CA | 2.0 | 1.0 | 1008 | $4,500 | $4.46 | 7d | 1 | 1.02mi |
| 5160 Diamond Heights Blvd Unit 301C San Francisco, CA | 2.0 | 1.0 | 990 | $4,250 | $4.29 | 43d | 1 | 1.02mi |
| 2830 22nd St Unit 2830 San Francisco, CA | 2.0 | 2.0 | 1090 | $5,200 | $4.77 | 16d | 1 | 1.03mi |
| 2960 Diamond St San Francisco, CA | 2.0 | 1.0 | 1089 | $4,500 | $4.13 | 11d | 1 | 1.05mi |
| 2333 Mission St #2 San Francisco, CA | 2.0 | 2.0 | 1010 | $4,900 | $4.85 | 7d | 1 | 1.09mi |
| 4058 20th St San Francisco, CA | 3.0 | 2.0 | 1794 | $13,975 | $7.79 | 24d | 1 | 1.10mi |
| 1236 Utah St San Francisco, CA | 1.0 | 1.0 | 1200 | $1,200 | $1.00 | 24d | 1 | 1.12mi |
| 830 Alabama St San Francisco, CA | 3.0 | 2.0 | 1465 | $9,500 | $6.48 | 43d | 1 | 1.13mi |
| 3436 19th St Unit A San Francisco, CA | 3.0 | 2.0 | 1250 | $7,225 | $5.78 | 20d | 1 | 1.13mi |
| 1428 Silliman St San Francisco, CA | 2.0 | 1.0 | 1800 | $3,500 | $1.94 | 43d | 1 | 1.14mi |
| 290 Holyoke St San Francisco, CA | 3.0 | 2.0 | 1652 | $6,250 | $3.78 | 5d | 1 | 1.32mi |
| 18 Perego Ter San Francisco, CA | 2.0 | 2.0 | 1100 | $5,145 | $4.68 | 43d | 1 | 1.33mi |
| 2018 Oakdale Ave San Francisco, CA | 3.0 | 2.0 | 1300 | $4,995 | $3.84 | 43d | 1 | 1.33mi |
| 1724 Burrows St San Francisco, CA | 2.0 | 1.5 | 1372 | $5,200 | $3.79 | 7d | 1 | 1.33mi |
| 47 Ford St San Francisco, CA | 2.0 | 1.5 | 1401 | $6,500 | $4.64 | 20d | 1 | 1.34mi |
| 258 Dorland St Unit 7 San Francisco, CA | 2.0 | 2.0 | 1500 | $5,500 | $3.67 | 43d | 1 | 1.34mi |
| 21 Rio Ct San Francisco, CA | 3.0 | 2.0 | 1200 | $4,600 | $3.83 | 18d | 1 | 1.35mi |
| 600 S Van Ness Ave San Francisco, CA | 2.0 | 2.0 | 1200 | $6,500 | $5.42 | 2d | 1 | 1.36mi |
| 3550 Market St San Francisco, CA | 2.0 | 2.0 | 1012 | $5,495 | $5.43 | 43d | 1 | 1.37mi |
| 3550 Market St Unit 206 San Francisco, CA | 2.0 | 2.0 | 1012 | $4,950 | $4.89 | 18d | 1 | 1.37mi |
| 542 Valencia St Unit A San Francisco, CA | 2.0 | 1.0 | 1600 | $5,000 | $3.12 | 24d | 1 | 1.39mi |
| 300 Monterey Blvd Unit 101 San Francisco, CA | 2.0 | 2.0 | 925 | $4,100 | $4.43 | 15d | 1 | 1.40mi |
Listing history 1 events
-
2026-05-15$499,000 Active 1046-char remark
ⓘ Source: listings_history table (triggers on properties + properties_extension) + one-shot
backfill from property_details.listing_events for pre-trigger history.
Climate risk First Street
- Flood 4/10 Moderate FEMA zone X (unshaded) · 22% chance over 30 yrs
- Wildfire 1/10 Low
- Heat 2/10 Low 8 d/yr ≥78°F today · 19 d/yr by 30 yrs out
- Wind 1/10 Low
- Air quality 7/10 Severe 13 unhealthy d/yr today · 13 by 30 yrs out
Nearby sold comps map
Loading sold comps map…
Walkable amenities ~0.75 mi
Loading nearby amenities…
Taxation est. · year 1
- Rental income
- $76,226
- − Mortgage interest
- −$27,952
- − Property taxes
- −$7,485
- − Insurance
- −$2,495
- − Repairs & maintenance
- −$6,098
- − Management
- −$6,098
- − Depreciation
- −$14,516
- Taxable income
- $11,582
- Est. tax owed @ 24.0%
- −$2,780
- After-tax cash flow
- $16,057/yr
For passive investors: Depreciation is non-cash, so a rental often shows a tax loss while cash-flowing — sheltering income. Rental losses are passive: they offset passive income freely, and up to $25,000/yr can offset ordinary (W-2) income if you actively participate and your MAGI is under $100k (phasing out to $0 by $150k); unused losses carry forward. On sale, claimed depreciation is recaptured at up to 25%, and gains may owe capital-gains tax (a 1031 exchange can defer both). Figures are a year-1 estimate at your 24.0% rate — not tax advice; consult a CPA.
Condition & rehab AI · 4 photos
This Edwardian home is in good condition with a flexible floor plan and a tenant occupied at a competitive rent. It offers a great location and potential for value-add improvements.
Value-add opportunities
- Both Paint the exterior — Enhances curb appeal and resale value
- Both Replace the light fixture in the living room — Improves the aesthetic and functionality
- Both Install new flooring in the kitchen — Modernizes the space and improves rental appeal
Renovation cost estimate screening
Value-add ROI direction
- Both Paint the exterior — Enhances curb appeal and resale value ↑
- Both Replace the light fixture in the living room — Improves the aesthetic and functionality ↑
- Both Install new flooring in the kitchen — Modernizes the space and improves rental appeal ↑
ⓘ Cost ranges are severity-bucket heuristics (US national rule-of-thumb). Get contractor quotes + a written scope before underwriting a rehab budget.
Schools (NCES district)
- District
- San Francisco Unified
- NCES district ID
- 0634410
- Math proficiency
- 50% ▬ 0.00%
- Reading proficiency
- 56% ▲ 1.00%
- Median HH income
- $81,249
- Composite
- 50.14/100
- National rank
- #4088
- State rank
- #322 of 1400 in CA
Livability — San Francisco
- Score
- 76/100
- State rank
- #90
- US rank
- #3143
Category grades
Schools grade is shown separately in the Schools card above.
Census & demographics
- Census place
- San Francisco, CA
- County
- San Francisco County · 827,552 people
- City population
- 827,552
- Metro
- San Francisco-Oakland-Berkeley, CA
- Population (ZIP)
- 66,865
- Household income
- $158,351
- Rent vs Own
- Severe rent burden
- 2732.0
Population outlook (San Francisco County) Hauer SSP2
- Today (2025)
- 1,030,936 people
- By 2030
- 1,110,409 · +7.7%
- By 2040
- 1,270,010 · +23.2%
- By 2050
- 1,435,001 · +39.2%
- By 2075
- 1,779,074 · +72.6%
- By 2100
- 1,966,767 · +90.8%
Race, ethnicity, and origin ACS 2023
- Neighborhood character
- Highly diverse neighborhood (Simpson 0.70)
- Race & ethnicity
- White 41% Hispanic / Latino 32% Asian 16% Two or more races 15% Black 4% Native American 1%
- Hispanic origin (detail)
- Mexican 16% Puerto Rican 1%
- Common ancestry
- Lithuanian 3% Italian 2% Romanian 2%
- Foreign-born
- 28% · Canada, China, Vietnam
- Languages at home
- 58% English-only · Spanish 27% Chinese 5% Other Indo-European 2%
Political lean MEDSL · San Francisco
- 2024 margin
- Solid D (+64.8) · D 80.3% · R 15.5% · Other 4.1%
- 2008→2024 swing
- -5.7pp toward R · 2008: 70.5pp · 2024: 64.8pp
- All cycles
- 2024: D+64.8 2020: D+72.5 2016: D+76.1 2012: D+70.2 2008: D+70.5
Not yet ingested
- Civics
- —
Market trends
- HPI YoY
- ▼ -1385.62%
- Current HPI
- 267.2424
- Rent YoY
- ▲ 14.54%
- Metro
- San Francisco-Oakland-Berkeley, CA
- State GDP YoY
- ▲ 3.21%
- F500 in state
- 116
Industry mix (Fortune 500 HQ in CA)
| Industry | F500 HQs | Revenue |
|---|---|---|
| Technology | 27 | $1,492B |
|
||
| Financial Services | 3 | $174B |
|
||
| Retail | 3 | $44B |
|
||
| Insurance | 3 | $26B |
|
||
| Media / Entertainment | 2 | $115B |
|
||
| Pharmaceuticals / Biotech | 2 | $62B |
|
||
Cash-flow waterfall
monthlySold comps — $/sqft
last 12 mo · ≤1 miLoading sold comps…