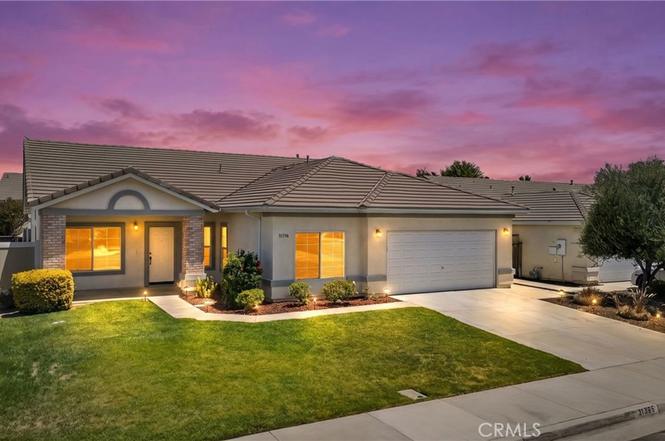
31396 Rivera St · French Valley, CA
Flood risk 1/10 · Minimal
- FEMA flood zone
- D
- Chance of flooding over 30 yrs
- 0.0%
- Est. flood insurance / yr
- $544 – $1,084
Fire risk 7/10 · Major
- Est. fire insurance / yr
- $659 – $1,223
Heat risk 7/10 · Major
- Hot days now (above 104°F)
- 6 days/yr
- Hot days in 30 yrs
- 16 days/yr
Wind risk 1/10 · Minimal
- Chance of severe wind over 30 yrs
- —
Air-quality risk 4/10 · Minor
- Unhealthy air days now
- 6 days/yr
- Unhealthy air days in 30 yrs
- 7 days/yr
Risk factors via First Street. Map © Google.
Why this score? — see what drove the D grade
The composite is a weighted blend of 9 inputs, each scored 0–100. Each bar is that input's sub-score; the figure is the points it added to the 100-point composite (weight × sub-score).
- ARV discount +11.4/15.0
- Appreciation +10.0/10.0
- Cash flow +6.4/30.0
- Schools +5.7/10.0
- Livability +3.0/5.0
- Condition / age +2.5/5.0
- Rent growth +2.3/5.0
- DSCR +0.7/10.0
- 1% rule +0.6/10.0
$619,999
🖨 Deal sheet 📄 Offer letter ✓ Due diligence
Listing remarks MLS
THIS SPACIOUS HOUSE HAS VAULTED CEILINGS, NICE SIZE BEDROOMS, BEAUTIFUL TILE IN THE FAMILY RM/KITCHEN AREA, BATHRM AND LAUNDRY AREA, AS WELL AS CEILING FANS IN EVERYROOM. KITCHEN FEATURES TILE COUNTER TOPS & LARGE ISLAND W/ BUILT IN CABINETS. FRONT & BACKYARD FULLY LANDSCAPED W/ A REDWOOD JACUZZI FOR RELAXATION, AND THE BACKYARD INCLUDES A DOG RUN.
Key facts
- Cozy gas fireplace
- Dual sinks
- Quartz countertops
Tags
Property features AI
Finance
- Financial info: Special assessments
- HOA & community: Part of Dutch Village association; Annual association fee: $133; Secondary association fee: $35 monthly; Community features include street lighting and sidewalks; Association amenities: call for rules
Exterior
- Parking: Attached garage with direct access; 2 garage spaces; Driveway parking; Total 2 parking spaces
- Security: Smoke detector(s); Carbon monoxide detector(s)
- Utilities: Public sewer; District/Public water; Natural gas connected; Electricity connected; Water connected
- Home design: Planned development; One story; Front entry; Entry level: 1
- Construction: Stucco construction
- Exterior features: House (single-family); Vinyl and wood fencing; Front yard; Sprinkler system; Wood patio/porch; No pool; Has view
Interior
- Kitchen: Gas cooktop; Built-in range; Gas oven; Microwave; Dishwasher; Water heater unit; Formal dining area, breakfast nook, and eating area in kitchen
- Bedrooms: Primary bedroom (main floor); All bedrooms on one level; Main floor bedroom; Total of 4 main-level bedrooms; Primary suite
- Flooring: Tile; Vinyl; Carpet
- Bathrooms: Two full bathrooms; Main floor full bath; Separate tub and shower; Bathtub; Double sinks in primary bath
- Heating & cooling: Central cooling; Central furnace heating
- Interior features: Quartz counters; High ceilings (9 feet+); Ceiling fan(s); Open floor plan; Kitchen open to family room; Remodeled kitchen; Kitchen island; Carbon monoxide detector(s); Smoke detector
- Laundry & utility: Laundry room inside the home (individual room)
Neighborhood map
What this means for you Summary
Snapshot
- This is a 3-bed/2.0-bath single-family listed at $620k.
Deal economics
- At list price, monthly cash flow is $-1k ($-13k/yr) — negative.
- To cash-flow at today's rent, offer at most $432k (30.4% below list).
- To meet the 1% rule (rent ≥ 1% of price), the offer needs to be $344k (44.5% below list).
- Recommended offer: $344k (44.5% below list) — sets the bar for 1% rule.
Location & tenants
- Location reads 59/100 on livability (#655 in CA) — a working-class tenant base; expect higher turnover. Strengths: employment A+, housing A+; Watch: crime D-, amenities F, commute F.
- Temecula Valley Unified (urban): math 55% / reading 69% proficiency, ranked #173 of 1,400 in CA (top 12%) — acceptable for families but not a draw, mixed tenant base, ~2y average lease; only 17% free/reduced lunch — higher-income household profile.
- Zoned schools: French Valley Elementary (880 students, 24% FRL); Bella Vista Middle (1,396 students, 26% FRL); Chaparral High (3,030 students, 27% FRL).
- Market conditions: Rents soft (-0.8%/yr); 355 active listings in the ZIP; 15 comparable units currently listed for rent nearby; rentals leasing fast (median 13d on market — plan ~1-2 weeks tenant-placement turnaround); high-income renter base; 9,195 units permitted in Riverside County in 2024 (1,512 in 5+ unit buildings).
- This rent runs 31% of the median local income ($133k/yr) — at the standard rent-burdened threshold; future hikes will face affordability resistance.
Forward outlook
- In year one you build about $66k of equity ($4k loan paydown + $62k appreciation (10.0% local appreciation)).
- Riverside County population projected at +22% by 2050 — long-run rental-demand tailwind backs the buy-and-hold thesis.
- By year 2, paydown + projected appreciation supports a ~$107k cash-out refi (75% LTV) — recoverable capital for the next deal without selling this one.
Negotiation context
- Only 8 days on market — expect competitive offers; lowballing is unlikely to land.
- 4 sale attempts since 21y ago with the ask held roughly flat each time — persistent listings suggest the price (not the market) is what's stuck; bring a comps-based counter.
- Current owner paid $200k; list at $620k implies a 210% gain — meaningful room to come down on a strong offer.
Risks & watch-outs
- Climate carrying-cost: major wildfire risk; extreme-heat days projected 6→16/yr by 2055 (HVAC capex compounding) — expect insurance premiums to compound above CPI over the hold.
Questions for the listing agent
- What do current leases actually rent for vs. the listed asking? Can we see a recent rent roll and the last 12 months of T-12 income?
- What does the HOA fee cover, when was the last increase, and are there any pending special assessments or reserve-fund shortfalls?
- Is there a deadline driving the sale (1031 exchange, divorce, estate, relocation)? That informs how much negotiation room exists.
- Schools are D-rated, which usually means shorter tenancies and higher turnover. Who's the typical renter profile here, and what's been the actual vacancy rate?
- Crime grade is D in this area — have there been break-ins, vandalism, or insurance claims at this property in the last 3 years? What carrier currently insures it and at what premium?
- The area grade is low — what's the realistic commute time and amenity access for the typical tenant pool here? Any planned neighborhood developments (good or bad) we should know about?
- What's the average days-on-market for RENTAL listings here right now (not sales)? A rising rental-DOM trend means longer vacancies and softer asking-rent achievability than the comps imply.
- What's the recent tenant-quality profile in this submarket — average credit score on applications, eviction rate, late-payment / NSF rate, and stable-employment percentage? A property-management company in the area should have these aggregated.
- How much new for-sale + rental construction is in the pipeline within 1–3 miles? Heavy new supply typically softens prices + rents 12–24 months out; constrained supply supports both.
Investment metrics
- 1% rule
- 0.56% ✗
- Cap rate
- 4.23%
- Cash-on-cash
- -7.37%
- DSCR
- 0.67
- GRM
- 15.0
CMA / ARV
- ARV (on-the-fly)
- $678,321
- Comps found
- 12
Show comp detail 12 sales within ~0.75 mi
| Address | Dist | Beds/Ba | Sqft | Sold | Price | $/sf | Match |
|---|---|---|---|---|---|---|---|
| 31429 Amsterdam | 0.08mi | 4/2.0 (+1) | 1,921 (-6%) | 3mo | $640,000 | $333 | 79 |
| 36143 Tahoe St | 0.32mi | 3/2.0 | 2,122 (+4%) | 1mo | $600,000 | $283 | 77 |
| 36171 Joltaire | 0.41mi | 3/2.0 | 2,122 (+4%) | 2mo | $589,000 | $278 | 72 |
| 36123 Joltaire | 0.45mi | 3/2.0 | 2,122 (+4%) | 1mo | $625,000 | $295 | 72 |
| 31572 Adour | 0.23mi | 4/2.0 (+1) | 1,866 (-8%) | 5mo | $600,000 | $322 | 66 |
| 31238 Jan Steen Ct | 0.57mi | 4/2.0 (+1) | 1,838 (-10%) | 2mo | $689,000 | $375 | 50 |
| 36415 Flare | 0.56mi | 4/3.0 (+1) | 1,861 (-9%) | 2mo | $600,000 | $322 | 49 |
| 31832 Gimbal Way | 0.51mi | 4/3.0 (+1) | 1,861 (-9%) | 11mo | $620,000 | $333 | 43 |
| 36390 W Flare | 0.58mi | 4/3.0 (+1) | 1,861 (-9%) | 11mo | $620,000 | $333 | 41 |
| 31656 Haute Ct | 0.64mi | 4/2.0 (+1) | 1,749 (-14%) | 4mo | $600,000 | $343 | 38 |
| 35908 Curie Ct | 0.64mi | 4/2.0 (+1) | 1,749 (-14%) | 5mo | $583,000 | $333 | 37 |
| 31343 Tulette | 0.72mi | 4/3.0 (+1) | 2,236 (+10%) | 6mo | $579,000 | $259 | 36 |
Match score weights: distance 35% · size 25% · config 20% · recency 20%. Top-matched comps best support the ARV.
Projected returns pro-forma
10.0% appreciation · 0.0% rent growth · sell at horizon
- IRR
- 18.4%
- Equity multiple
- 2.49×
- Total profit
- $259,419
- Equity at exit
- $558,544
- IRR
- 16.7%
- Equity multiple
- 5.60×
- Total profit
- $798,775
- Equity at exit
- $1,204,522
Cash invested: $173,600 (down + closing). Projections, not guarantees.
Landlord ↔ Tenant lean methodology
- Overall (STATE)
- 18 Strongly Tenant-Friendly
- State California
- 18 Strongly Tenant-Friendly · D+13
- County
- — inherits STATE
- City
- — inherits STATE
ZIP-level market 92596
- Home prices YoY
- 3.9%
- Rents YoY
- -0.8%
- Active inventory
- 355
- Price-to-rent
- 15.0×
Monthly cashflow live
- Estimated rent
- $3,443 high interval (Pro) →
- Mortgage (P&I)
- −$3,251
- Tax from tax record
- −$230 /mo · $2,764/yr
- Insurance
- −$258
- HOA
- −$46
- Vacancy / Maint / Mgmt
- −$723
- Net cashflow
- $-1,066
Break-even live
UW: 25.0% down · 7.5% · 30yr · 1.5% tax · 5.0% vac · 8.0% maint · 8.0% mgmt
Financing live
Cash to close
- Down payment
- $155,000
- Closing costs
- $18,600
- Reserves months
- —
- Total cash needed
- —
Loan-product check · same deal, 3 products live
Conventional
25% down · 7.5% · 30yr
- Down + closing
- —
- Monthly P&I
- —
- Monthly cashflow
- —
- DSCR
- —
- Eligible?
- —
Personal DTI + credit; lowest rate.
DSCR
20% down · 8.5% · 30yr
- Down + closing
- —
- Monthly P&I
- —
- Monthly cashflow
- —
- DSCR
- —
- Eligible?
- —
No personal income docs; deal must DSCR.
Hard money
10% down · 12.0% · 12mo
- Down + closing
- —
- Monthly P&I
- —
- Monthly cashflow
- —
- DSCR
- —
- Eligible?
- —
Short-term bridge; refi at stabilization.
Rent comps 15 comps
| Address | Beds | Baths | Sqft | Rent | $/sqft | DOM | Units | Dist |
|---|---|---|---|---|---|---|---|---|
| 36264 Capri Dr Winchester, CA | 4.0 | 2.5 | 1999 | $3,300 | $1.65 | 17d | 1 | 0.34mi |
| 36308 Cosimo Ln Winchester, CA | 3.0 | 2.5 | 1550 | $2,695 | $1.74 | 19d | 1 | 0.50mi |
| 37184 Running Springs Rd Murrieta, CA | 4.0 | 2.0 | 1991 | $3,550 | $1.78 | 23d | 1 | 0.94mi |
| 35350 Marabella Ct Unit 35350 Winchester, CA | 3.0 | 2.5 | 1925 | $3,300 | $1.71 | 1d | 1 | 1.04mi |
| 31624 Chamise Ln Murrieta, CA | 4.0 | 3.0 | 2409 | $3,350 | $1.39 | 4d | 1 | 1.26mi |
| 31624 Chamise Ln Murrieta, CA | 4.0 | 3.0 | 2409 | $3,350 | $1.39 | 19d | 1 | 1.26mi |
| 31647 Angel Aura Dr Winchester, CA | 3.0 | 2.5 | 1711 | $3,195 | $1.87 | 16d | 1 | 1.27mi |
| 31629 Angel Aura Dr Winchester, CA | 3.0 | 3.0 | 1711 | $3,099 | $1.81 | 21d | 1 | 1.28mi |
| 36996 Camino Springs Ave Murrieta, CA | 3.0 | 2.5 | 2000 | $3,595 | $1.80 | 2d | 1 | 1.29mi |
| 36980 Camino Springs Ave Murrieta, CA | 4.0 | 3.0 | 2253 | $3,299 | $1.46 | 1d | 1 | 1.31mi |
| 30315 Brittle Brush St Murrieta, CA | 3.0 | 2.5 | 1577 | $3,195 | $2.03 | 43d | 1 | 1.41mi |
| 30072 Bonita Springs St Murrieta, CA | 3.0 | 2.5 | 1577 | $3,200 | $2.03 | 12d | 1 | 1.41mi |
| 36594 Camino Springs Ave Murrieta, CA | 3.0 | 2.5 | 1870 | $3,350 | $1.79 | 10d | 1 | 1.44mi |
| 36594 Camino Springs Ave Murrieta, CA | 3.0 | 2.0 | 1870 | $3,299 | $1.76 | 1d | 1 | 1.44mi |
| 36575 Camino Springs Ave Murrieta, CA | 4.0 | 3.0 | 2064 | $3,300 | $1.60 | 2d | 1 | 1.45mi |
HOA detail
- Monthly dues
- $46 · $552/yr
Listing history 6 events
-
2026-06-18days on market $619,999 Active 8 DOM
-
2026-06-17days on market $619,999 Active 7 DOM
-
2026-06-16days on market $619,999 Active 6 DOM
-
2026-06-15days on market $619,999 Active 5 DOM
-
2026-06-13remarks 699-char remark
-
2026-06-13$619,999 Active 3 DOM
ⓘ Source: listings_history table (triggers on properties + properties_extension) + one-shot
backfill from property_details.listing_events for pre-trigger history.
Tax reassessment forecast CA · Resets to sale price
- Current annual tax
- $2,764 · $230/mo
- Projected year-2 tax
- $4,712 · $393/mo
- Expected delta
- +$1,948/yr (+$162/mo · 70.5%)
ⓘ Screening estimate from a state-policy table — verify with the county assessor before closing.
Climate risk First Street
- Flood 1/10 Low FEMA zone D · 0% chance over 30 yrs
- Wildfire 7/10 Severe
- Heat 7/10 Severe 6 d/yr ≥104°F today · 16 d/yr by 30 yrs out
- Wind 1/10 Low
- Air quality 4/10 Moderate 6 unhealthy d/yr today · 7 by 30 yrs out
Nearby sold comps map
Loading sold comps map…
Walkable amenities ~0.75 mi
Loading nearby amenities…
Taxation est. · year 1
- Rental income
- $41,314
- − Mortgage interest
- −$34,730
- − Property taxes
- −$2,764
- − Insurance
- −$3,100
- − Repairs & maintenance
- −$3,305
- − Management
- −$3,305
- − HOA
- −$552
- − Depreciation
- −$18,036
- Taxable loss
- −$24,478
- Est. tax savings @ 24.0%
- +$5,875
- After-tax cash flow
- $-6,919/yr
For passive investors: Depreciation is non-cash, so a rental often shows a tax loss while cash-flowing — sheltering income. Rental losses are passive: they offset passive income freely, and up to $25,000/yr can offset ordinary (W-2) income if you actively participate and your MAGI is under $100k (phasing out to $0 by $150k); unused losses carry forward. On sale, claimed depreciation is recaptured at up to 25%, and gains may owe capital-gains tax (a 1031 exchange can defer both). Figures are a year-1 estimate at your 24.0% rate — not tax advice; consult a CPA.
Schools (NCES district)
- District
- Temecula Valley Unified
- NCES district ID
- 0600028
- Math proficiency
- 55% ▲ 1.00%
- Reading proficiency
- 69% ▲ 1.00%
- Median HH income
- $84,032
- Composite
- 57.48/100
- National rank
- #2264
- State rank
- #173 of 1400 in CA
Livability — French Valley
- Score
- 59/100
- State rank
- #655
- US rank
- #20351
Category grades
Schools grade is shown separately in the Schools card above.
Census & demographics
- Census place
- French Valley, CA
- County
- Riverside County · 2,287,001 people
- Metro
- Riverside-San Bernardino-Ontario, CA
- Population (ZIP)
- 38,981
- Household income
- $132,538
- Rent vs Own
- Severe rent burden
- 591.0
Population outlook (Riverside County) Hauer SSP2
- Today (2025)
- 2,664,475 people
- By 2030
- 2,802,692 · +5.2%
- By 2040
- 3,050,904 · +14.5%
- By 2050
- 3,256,783 · +22.2%
- By 2075
- 3,655,058 · +37.2%
- By 2100
- 3,766,594 · +41.4%
Race, ethnicity, and origin ACS 2023
- Neighborhood character
- Highly diverse neighborhood (Simpson 0.72)
- Race & ethnicity
- White 38% Hispanic / Latino 34% Two or more races 16% Asian 12% Black 6% Pacific Islander 2%
- Hispanic origin (detail)
- Mexican 29%
- Common ancestry
- Slovak 3% Italian 2% Portuguese 1%
- Foreign-born
- 14% · Canada, Vietnam
- Languages at home
- 76% English-only · Spanish 16% Tagalog/Filipino 4% Vietnamese 1%
Political lean MEDSL · Riverside
- 2024 margin
- Toss-up / Even · D 48.0% · R 49.3% · Other 2.6%
- 2008→2024 swing
- -3.6pp toward R · 2008: 2.3pp · 2024: -1.3pp
- All cycles
- 2024: R+1.3 2020: D+8.0 2016: D+4.3 2012: R+0.4 2008: D+2.3
Not yet ingested
- Civics
- —
Market trends
- HPI YoY
- ▲ 12.43%
- Current HPI
- 332.169
- Rent YoY
- ▼ -0.79%
- Metro
- Riverside-San Bernardino-Ontario, CA
- State GDP YoY
- ▲ 3.21%
- F500 in state
- 116
Industry mix (Fortune 500 HQ in CA)
| Industry | F500 HQs | Revenue |
|---|---|---|
| Technology | 27 | $1,492B |
|
||
| Financial Services | 3 | $174B |
|
||
| Retail | 3 | $44B |
|
||
| Insurance | 3 | $26B |
|
||
| Media / Entertainment | 2 | $115B |
|
||
| Pharmaceuticals / Biotech | 2 | $62B |
|
||
Price history
+258.4% since first listed11 events — show timeline
- 2026-06-10 Listed $619,999 CRMLS
- 2009-12-15 Sold (MLS) $200,000 CRMLS
- 2009-11-10 Pending — CRMLS
- 2009-09-02 Price Changed $209,900 CRMLS
- 2009-07-27 Listed $219,900 CRMLS
- 2006-05-02 Listing Removed — CRMLS
- 2006-04-24 Listing Removed — CRMLS
- 2005-11-02 Listed $439,500 CRMLS
- 2005-11-02 Listed $439,500 CRMLS
- 2001-06-26 Sold (Public Records) $209,000 Public Records
- 1999-04-27 Sold (Public Records) $173,000 Public Records
Property tax history
+0.7%/yrLatest (2025): $2,764 · +1.5% YoY. Source: county tax records.
Cash-flow waterfall
monthlySold comps — $/sqft
last 12 mo · ≤1 miLoading sold comps…