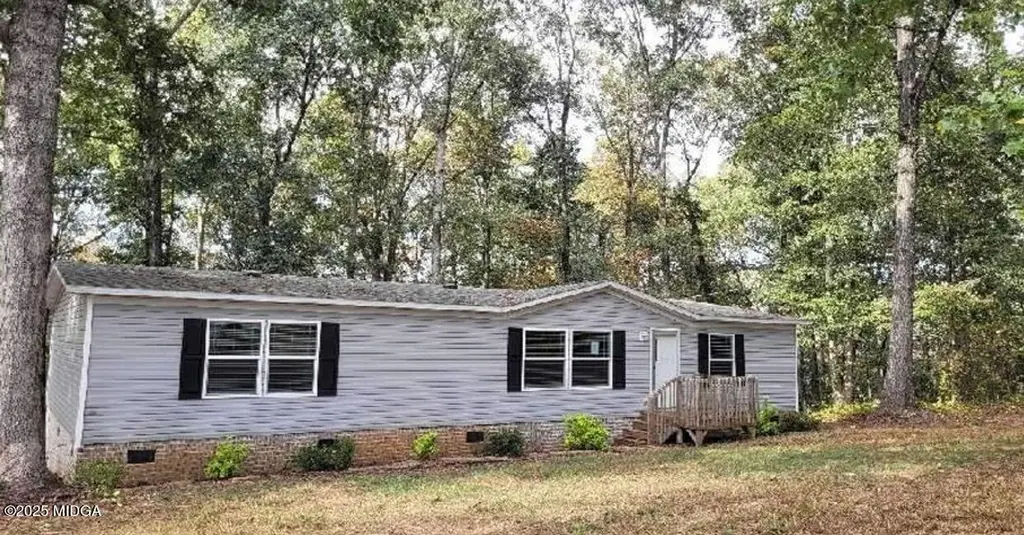
41 Manley Ter · Carnesville, GA
Flood risk 1/10 · Minimal
- FEMA flood zone
- X (unshaded)
- Chance of flooding over 30 yrs
- 0.0%
- Est. flood insurance / yr
- $507 – $1,088
Fire risk 4/10 · Minor
- Est. fire insurance / yr
- $963 – $1,789
Heat risk 5/10 · Moderate
- Hot days now (above 106°F)
- 7 days/yr
- Hot days in 30 yrs
- 16 days/yr
Wind risk 4/10 · Minor
- Chance of severe wind over 30 yrs
- 9.0%
Air-quality risk 4/10 · Minor
- Unhealthy air days now
- 4 days/yr
- Unhealthy air days in 30 yrs
- 5 days/yr
Risk factors via First Street. Map © Google.
Why this score? — see what drove the C grade
The composite is a weighted blend of 9 inputs, each scored 0–100. Each bar is that input's sub-score; the figure is the points it added to the 100-point composite (weight × sub-score).
- ARV discount +15.0/15.0
- Cash flow +12.6/30.0
- Appreciation +10.0/10.0
- DSCR +3.8/10.0
- Livability +3.2/5.0
- 1% rule +3.0/10.0
- Schools +3.0/10.0
- Rent growth +2.5/5.0
- Condition / age +2.5/5.0
$189,000
🖨 Deal sheet 📄 Offer letter ✓ Due diligence
Listing remarks MLS
Offers to be placed on Xome.com. Interior inspections are not available, do not trespass! Forward all inquiries and questions to Xome Customer Service . NO REPRESENTATION TO VALIDITY OF INFORMATION IS MADE, BUYER TO VERIFY ALL INFORMATION WHERIN.
Key facts
- 2.79 acre lot
- Built 2022
- Listed 217 days
Neighborhood map
What this means for you Summary
Snapshot
- This is a 3-bed/2.0-bath manufactured listed at $189k.
Deal economics
- At list price, monthly cash flow is $-24 ($-289/yr) — negative.
- To cash-flow at today's rent, offer at most $185k (2.3% below list).
- To meet the 1% rule (rent ≥ 1% of price), the offer needs to be $150k (20.5% below list).
- Recommended offer: $150k (20.5% below list) — sets the bar for 1% rule.
- Cap rate 6.1% vs local median 2.0% in Carnesville — top-decile yield for the area; either an underpriced asset or a hidden risk that comps aren't pricing in. Stress-test before assuming the spread holds.
Location & tenants
- Location reads 64/100 on livability (#269 in GA) — a middle-class / working-renter tenant base. Strengths: cost of living A+, housing A+; Watch: employment C-, crime D, schools F.
- Franklin County (rural): math 38% / reading 35% proficiency, ranked #61 of 174 in GA (top 35%) — families likely to look elsewhere, expect single-tenant / working-renter base with shorter leases.
- Market conditions: 95 active listings in the ZIP; 163 units permitted in Franklin County in 2024 (0 in 5+ unit buildings).
- This rent runs 34% of the median local income ($53k/yr) — at the standard rent-burdened threshold; future hikes will face affordability resistance.
Forward outlook
- In year one you build about $20k of equity ($1k loan paydown + $19k appreciation (10.0% local appreciation)).
- At projected returns (10.0% appreciation + 3.0% rent growth), your $53k cash investment doubles in ~3 years — after that, you're playing with house money.
- By year 2, paydown + projected appreciation supports a ~$32k cash-out refi (75% LTV) — recoverable capital for the next deal without selling this one.
Negotiation context
- It's been on market 218 days — a 12% lower offer ($166k) is reasonable based on typical stale-listing flexibility.
- 2 sale attempts with the ask held roughly flat each time — persistent listings suggest the price (not the market) is what's stuck; bring a comps-based counter.
Risks & watch-outs
- Climate carrying-cost: extreme-heat days projected 7→16/yr by 2055 (HVAC capex compounding) — expect insurance premiums to compound above CPI over the hold.
Questions for the listing agent
- What do current leases actually rent for vs. the listed asking? Can we see a recent rent roll and the last 12 months of T-12 income?
- It's been on market 218 days. Have you received any prior offers? Is the seller open to a 20% concession, seller financing, or rate buy-down credit?
- Why hasn't it sold? Are there any deal-killer items the seller is aware of (foundation, flood, title, zoning, code violations)?
- Is there a deadline driving the sale (1031 exchange, divorce, estate, relocation)? That informs how much negotiation room exists.
- Schools are F-rated, which usually means shorter tenancies and higher turnover. Who's the typical renter profile here, and what's been the actual vacancy rate?
- Crime grade is D in this area — have there been break-ins, vandalism, or insurance claims at this property in the last 3 years? What carrier currently insures it and at what premium?
- What's the average days-on-market for RENTAL listings here right now (not sales)? A rising rental-DOM trend means longer vacancies and softer asking-rent achievability than the comps imply.
- What's the recent tenant-quality profile in this submarket — average credit score on applications, eviction rate, late-payment / NSF rate, and stable-employment percentage? A property-management company in the area should have these aggregated.
- How much new for-sale + rental construction is in the pipeline within 1–3 miles? Heavy new supply typically softens prices + rents 12–24 months out; constrained supply supports both.
Investment metrics
- 1% rule
- 0.80% ✗
- Cap rate
- 6.14%
- Cash-on-cash
- -0.55%
- DSCR
- 0.98
- GRM
- 10.5
CMA / ARV
- ARV (median comp)
- $238,000
- List price
- $189,000
- Delta
- -20.59%
- Verdict
- UNDERPRICED
- Comps
- 1 within 2.0 mi
Show comp detail 2 sales within ~0.75 mi
| Address | Dist | Beds/Ba | Sqft | Sold | Price | $/sf | Match |
|---|---|---|---|---|---|---|---|
| 31 Dons Ct | 0.18mi | 3/2.0 | 1,560 (-0%) | 1mo | $238,000 | $153 | 90 |
| 734 Nails Creek Xing | 0.09mi | 3/2.0 | 1,568 (0%) | 19mo | $225,000 | $143 | 80 |
Match score weights: distance 35% · size 25% · config 20% · recency 20%. Top-matched comps best support the ARV.
Projected returns pro-forma
10.0% appreciation · 3.0% rent growth · sell at horizon
- IRR
- 23.9%
- Equity multiple
- 2.92×
- Total profit
- $101,365
- Equity at exit
- $170,266
- IRR
- 21.2%
- Equity multiple
- 6.66×
- Total profit
- $299,638
- Equity at exit
- $367,185
Cash invested: $52,920 (down + closing). Projections, not guarantees.
Landlord ↔ Tenant lean methodology
- Overall (STATE)
- 90 Strongly Landlord-Friendly
- State Georgia
- 90 Strongly Landlord-Friendly · R+3
- County
- — inherits STATE
- City
- — inherits STATE
ZIP-level market 30662
- Home prices YoY
- 17.9%
- Active inventory
- 95
- Price-to-rent
- 10.5×
Monthly cashflow live
- Estimated rent
- $1,503 medium interval (Pro) →
- Mortgage (P&I)
- −$991
- Tax from tax record
- −$141 /mo · $1,695/yr
- Insurance
- −$79
- HOA
- −$0
- Vacancy / Maint / Mgmt
- −$316
- Net cashflow
- $-24
Break-even live
UW: 25.0% down · 7.5% · 30yr · 1.5% tax · 5.0% vac · 8.0% maint · 8.0% mgmt
Financing live
Cash to close
- Down payment
- $47,250
- Closing costs
- $5,670
- Reserves months
- —
- Total cash needed
- —
Loan-product check · same deal, 3 products live
Conventional
25% down · 7.5% · 30yr
- Down + closing
- —
- Monthly P&I
- —
- Monthly cashflow
- —
- DSCR
- —
- Eligible?
- —
Personal DTI + credit; lowest rate.
DSCR
20% down · 8.5% · 30yr
- Down + closing
- —
- Monthly P&I
- —
- Monthly cashflow
- —
- DSCR
- —
- Eligible?
- —
No personal income docs; deal must DSCR.
Hard money
10% down · 12.0% · 12mo
- Down + closing
- —
- Monthly P&I
- —
- Monthly cashflow
- —
- DSCR
- —
- Eligible?
- —
Short-term bridge; refi at stabilization.
Listing history 24 events
-
2026-06-19days on market $189,000 Active 218 DOM
-
2026-06-18days on market $189,000 Active 217 DOM
-
2026-06-17days on market $189,000 Active 216 DOM
-
2026-06-16days on market $189,000 Active 215 DOM
-
2026-06-15days on market $189,000 Active 214 DOM
-
2026-06-14days on market $189,000 Active 212 DOM
-
2026-06-12days on market $189,000 Active 211 DOM
-
2026-06-09days on market $189,000 Active 208 DOM
-
2026-06-08days on market $189,000 Active 207 DOM
-
2026-06-07days on market $189,000 Active 206 DOM
-
2026-06-07days on market $189,000 Active 205 DOM
-
2026-06-03days on market $189,000 Active 202 DOM
-
2026-06-02days on market $189,000 Active 201 DOM
-
2026-06-01days on market $189,000 Active 200 DOM
-
2026-05-31days on market $189,000 Active 199 DOM
-
2026-05-31days on market $189,000 Active 198 DOM
-
2026-04-16price $189,000 246-char remark
Show marketing remark (246 chars)
Offers to be placed on Xome.com. Interior inspections are not available, do not trespass! Forward all inquiries and questions to Xome Customer Service . NO REPRESENTATION TO VALIDITY OF INFORMATION IS MADE, BUYER TO VERIFY ALL INFORMATION WHERIN.
-
2026-01-07price $193,500 246-char remark
Show marketing remark (246 chars)
Offers to be placed on Xome.com. Interior inspections are not available, do not trespass! Forward all inquiries and questions to Xome Customer Service . NO REPRESENTATION TO VALIDITY OF INFORMATION IS MADE, BUYER TO VERIFY ALL INFORMATION WHERIN.
-
2025-11-13$191,970 Active 246-char remark
Show marketing remark (246 chars)
Offers to be placed on Xome.com. Interior inspections are not available, do not trespass! Forward all inquiries and questions to Xome Customer Service . NO REPRESENTATION TO VALIDITY OF INFORMATION IS MADE, BUYER TO VERIFY ALL INFORMATION WHERIN.
-
2025-09-30historical
-
2025-04-25price $229,000
-
2025-03-04$239,900 New
-
2023-03-06soldstatus $229,000
-
2022-03-09soldstatus $63,000
ⓘ Source: listings_history table (triggers on properties + properties_extension) + one-shot
backfill from property_details.listing_events for pre-trigger history.
Tax reassessment forecast GA · Resets to sale price
- Current annual tax
- $1,695 · $141/mo
- Projected year-2 tax
- $1,739 · $145/mo
- Expected delta
- +$44/yr (+$4/mo · 2.6%)
ⓘ Screening estimate from a state-policy table — verify with the county assessor before closing.
Climate risk First Street
- Flood 1/10 Low FEMA zone X (unshaded) · 0% chance over 30 yrs
- Wildfire 4/10 Moderate
- Heat 5/10 Major 7 d/yr ≥106°F today · 16 d/yr by 30 yrs out
- Wind 4/10 Moderate 9% chance of damaging wind over 30 yrs
- Air quality 4/10 Moderate 4 unhealthy d/yr today · 5 by 30 yrs out
Nearby sold comps map
Loading sold comps map…
Walkable amenities ~0.75 mi
Loading nearby amenities…
Taxation est. · year 1
- Rental income
- $18,031
- − Mortgage interest
- −$10,587
- − Property taxes
- −$1,695
- − Insurance
- −$945
- − Repairs & maintenance
- −$1,442
- − Management
- −$1,442
- − Depreciation
- −$5,498
- Taxable loss
- −$3,579
- Est. tax savings @ 24.0%
- +$859
- After-tax cash flow
- $570/yr
For passive investors: Depreciation is non-cash, so a rental often shows a tax loss while cash-flowing — sheltering income. Rental losses are passive: they offset passive income freely, and up to $25,000/yr can offset ordinary (W-2) income if you actively participate and your MAGI is under $100k (phasing out to $0 by $150k); unused losses carry forward. On sale, claimed depreciation is recaptured at up to 25%, and gains may owe capital-gains tax (a 1031 exchange can defer both). Figures are a year-1 estimate at your 24.0% rate — not tax advice; consult a CPA.
Schools (NCES district)
- District
- Franklin County
- NCES district ID
- 1302250
- Math proficiency
- 38% ▼ -1.00%
- Reading proficiency
- 35% ▼ -3.00%
- Median HH income
- $35,985
- Composite
- 30.28/100
- National rank
- #6281
- State rank
- #61 of 174 in GA
Livability — Carnesville
- Score
- 64/100
- State rank
- #269
- US rank
- #14591
Category grades
Schools grade is shown separately in the Schools card above.
Census & demographics
- County
- Franklin County · 7,950 people
- Metro
- Athens-Clarke County, GA
- Population (ZIP)
- 7,950
- Household income
- $53,487
- Rent vs Own
- Severe rent burden
- 72.0
Population outlook (Franklin County) Hauer SSP2
- Today (2025)
- 22,625 people
- By 2030
- 22,725 · +0.4%
- By 2040
- 22,806 · +0.8%
- By 2050
- 22,713 · +0.4%
- By 2075
- 22,514 · -0.5%
- By 2100
- 20,768 · -8.2%
Race, ethnicity, and origin ACS 2023
- Neighborhood character
- Predominantly White (77%)
- Race & ethnicity
- White 77% Black 11% Two or more races 5% Hispanic / Latino 4% Asian 4%
- Common ancestry
- Slovak 2% Romanian 1% Lithuanian 1%
- Foreign-born
- 6% · Vietnam, Canada
- Languages at home
- 91% English-only · Vietnamese 4% Spanish 3% German/W. Germanic 1%
Political lean MEDSL · Franklin
- 2024 margin
- Solid R (+72.6) · D 13.6% · R 86.2%
- 2008→2024 swing
- -21.1pp toward R · 2008: -51.5pp · 2024: -72.6pp
- All cycles
- 2024: R+72.6 2020: R+69.5 2016: R+68.6 2012: R+59.5 2008: R+51.5
Not yet ingested
- Civics
- —
Market trends
- HPI YoY
- ▲ 62.43%
- Current HPI
- 410.693
- Rent YoY
- —
- Metro
- Athens-Clarke County, GA
- State GDP YoY
- ▲ 2.66%
- F500 in state
- 28
Industry mix (Fortune 500 HQ in GA)
| Industry | F500 HQs | Revenue |
|---|---|---|
| Paper / Packaging | 2 | $29B |
|
||
| Retail | 1 | $160B |
|
||
| Transportation / Logistics | 1 | $91B |
|
||
| Airlines | 1 | $62B |
|
||
| Consumer Goods | 1 | $47B |
|
||
| Utilities | 1 | $25B |
|
||
Price history
+200.0% since first listed8 events — show timeline
- 2026-04-16 Price Changed $189,000 MGMLS
- 2026-01-07 Price Changed $193,500 MGMLS
- 2025-11-13 Listed $191,970 MGMLS
- 2025-09-30 Listing Removed — GAMLS
- 2025-04-25 Price Changed $229,000 GAMLS
- 2025-03-04 Listed $239,900 GAMLS
- 2023-03-06 Sold (Public Records) $229,000 Public Records
- 2022-03-09 Sold (Public Records) $63,000 Public Records
Property tax history
+30.6%/yrLatest (2025): $1,695 · -4.3% YoY. Source: county tax records.
Cash-flow waterfall
monthlySold comps — $/sqft
last 12 mo · ≤1 miLoading sold comps…