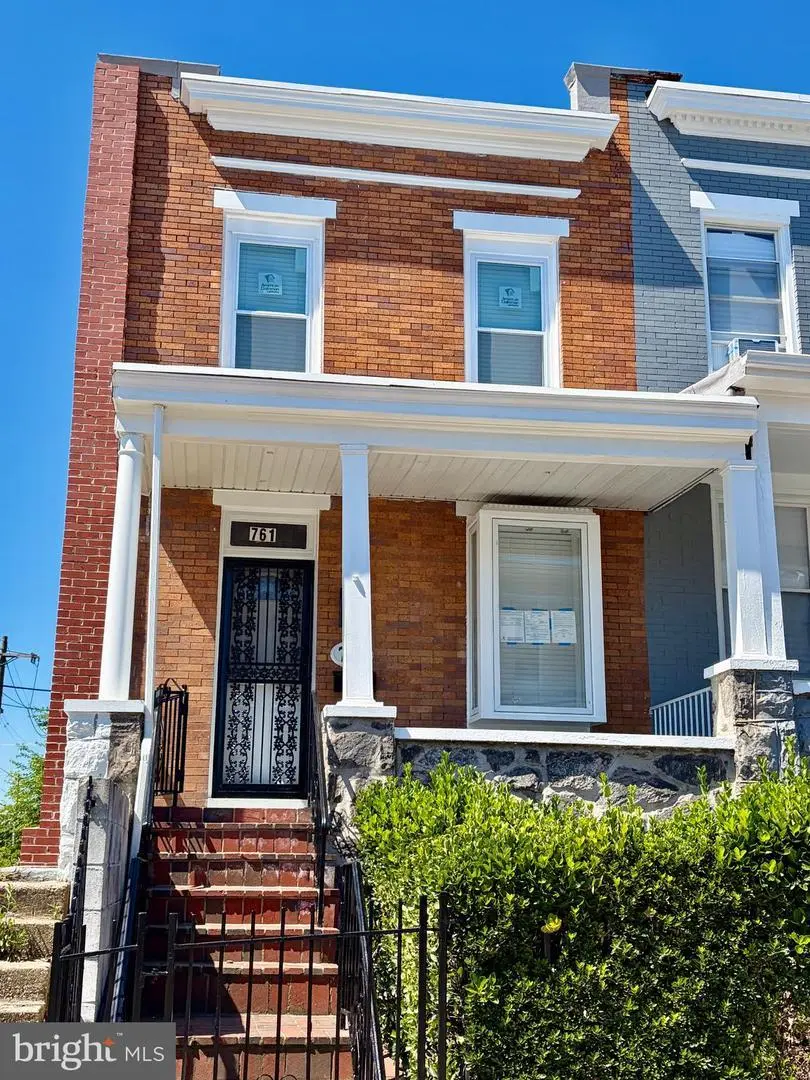
761 Bartlett Ave · Baltimore, MD
Flood risk 8/10 · Major
- FEMA flood zone
- X (unshaded)
- Chance of flooding over 30 yrs
- 0.99%
- Est. flood insurance / yr
- $473 – $860
Fire risk 1/10 · Minimal
- Est. fire insurance / yr
- $755 – $1,403
Heat risk 7/10 · Major
- Hot days now (above 103°F)
- 7 days/yr
- Hot days in 30 yrs
- 15 days/yr
Wind risk 6/10 · Moderate
- Chance of severe wind over 30 yrs
- 27.0%
Air-quality risk 4/10 · Minor
- Unhealthy air days now
- 6 days/yr
- Unhealthy air days in 30 yrs
- 7 days/yr
Risk factors via First Street. Map © Google.
Why this score? — see what drove the B grade
The composite is a weighted blend of 9 inputs, each scored 0–100. Each bar is that input's sub-score; the figure is the points it added to the 100-point composite (weight × sub-score).
- Cash flow +29.8/30.0
- ARV discount +14.3/15.0
- DSCR +10.0/10.0
- 1% rule +7.1/10.0
- Livability +3.8/5.0
- Rent growth +2.9/5.0
- Condition / age +2.5/5.0
- Schools +1.0/10.0
- Appreciation +0.0/10.0
$130,000
🖨 Deal sheet 📄 Offer letter ✓ Due diligence
Listing remarks
Step into this bright, airy end‑of‑group porch‑front home, beautifully remodeled and offered at an exceptionally affordable price. The main level welcomes you with new LVP flooring, a spacious living room, a dedicated dining area, and a stunning new kitchen featuring stainless steel appliances. A cozy family room leads directly to the rear deck, perfect for relaxing or entertaining. Upstairs, you’ll find two generous bedrooms, a hallway lined with ample closet space, and a large, fully renovated bathroom complete with the convenience of upper‑level laundry. The clean, unfinished basement provides abundant storage or the opportunity to create additional living space tailored to your ne
Key facts
- Stunning new kitchen
- Cozy family room
- New lvp flooring
Tags
Property features AI
Finance
- Other: Total below-grade area approximately 422 (estimated); Above-grade finished area approximately 1,000 (estimated)
Exterior
- Parking: On-street parking
- Utilities: Public water; Public sewer; Cable TV available; Electric service (100 Amp); Natural gas for heating and hot water
- Home design: End-of-row townhouse; Fee simple ownership; Property in excellent condition; Not in federal flood zone; Urban location in Baltimore City; Roads are city/county maintained with blacktop surface
- Construction: Brick construction; Composite roof; Other foundation; Double-pane windows with screens and skylights; Year built (assessor source)
- Exterior features: Sidewalks; Deck(s); Porch(es); Rear yard; Outside basement entrance; Connecting stairway to basement; Basement interior access; Basement improved but unfinished
Interior
- Kitchen: Built-in microwave; Oven/range - gas; Refrigerator; Dishwasher; Stainless steel appliances; Exhaust fan
- Bedrooms: Two bedrooms on the first upper level
- Flooring: Luxury vinyl plank; Concrete
- Bathrooms: One full bathroom (all upper levels); One full bathroom on the first upper level; One half bathroom on the main level
- Heating & cooling: Radiator/steam heating (natural gas fuel); Ceiling fans for cooling; 100 amp electric service; Natural gas hot water
- Interior features: Skylights; Walk-in shower in bathroom; Ceiling fans; Combination dining and living area; Dining area; Traditional floor plan; Eat-in kitchen; Master bath; Recessed lighting; Window treatments; Drywall walls and ceilings; Insulated doors
- Laundry & utility: Washer in unit; Dryer in unit; Upper floor laundry; Has laundry
Neighborhood map
What this means for you Summary
Snapshot
- This is a 2-bed/1.5-bath townhouse listed at $130k.
Deal economics
- At list price, monthly cash flow is $422 ($5k/yr) — positive.
- The deal already cash-flows at list — no discount required.
- Meets the 1% rule at list price ($2k rent vs $130k).
- Cap rate 10.7% vs local median 6.0% in Baltimore — top-decile yield for the area; either an underpriced asset or a hidden risk that comps aren't pricing in. Stress-test before assuming the spread holds.
Location & tenants
- Location reads 76/100 on livability (#90 in MD, #3,396 nationally) — a middle-class / working-renter tenant base. Strengths: amenities A+, commute A+, housing A+; Watch: schools D, crime F.
- Baltimore City Public Schools (urban): math 7% / reading 16% proficiency, ranked #24 of 24 in MD (top 100%) — low school quality limits family demand, transient renter base, plan for 1-2y turnover; 79% free/reduced lunch — lower-income household profile, screen leases tightly.
- Market conditions: Rents rising (+1.6%/yr); 325 active listings in the ZIP; 40 comparable units currently listed for rent nearby; rentals at typical pace (median 24d on market — plan ~3-4 weeks tenant-placement turnaround); 1,273 units permitted in Baltimore city in 2024 (1,104 in 5+ unit buildings).
- This rent runs 30% of the median local income ($62k/yr) — at the standard rent-burdened threshold; future hikes will face affordability resistance.
Forward outlook
- Local home prices are declining (-3.0%/yr); year-one equity from $899 of loan paydown is wiped out by about $4k of value loss. Plan a longer hold.
- Baltimore County population projected to shrink 4% by 2050 — rents likely to lag national; underwrite the cash flow, not the appreciation.
- At projected returns (-3.0% appreciation + 1.6% rent growth), your $36k cash investment doubles in ~10 years — after that, you're playing with house money.
Negotiation context
- Only 5 days on market — expect competitive offers; lowballing is unlikely to land.
- 2 sale attempts with the ask held roughly flat each time — persistent listings suggest the price (not the market) is what's stuck; bring a comps-based counter.
- Current owner paid $47k; list at $130k implies a 178% gain — meaningful room to come down on a strong offer.
Risks & watch-outs
- Watch-outs: flood insurance adds $56/mo; built in 1920 — expect roof / HVAC / electrical / plumbing capex.
- Climate carrying-cost: severe flood risk; major wind risk, 27% chance of damaging wind over 30y; extreme-heat days projected 7→15/yr by 2055 (HVAC capex compounding) — expect insurance premiums to compound above CPI over the hold.
Questions for the listing agent
- Built in 1920 — when were the roof, HVAC, electrical panel, plumbing, and water heater last replaced?
- What's the actual annual flood-insurance premium (NFIP or private), and is the property in a SFHA with mandatory coverage?
- Is there a deadline driving the sale (1031 exchange, divorce, estate, relocation)? That informs how much negotiation room exists.
- Schools are D-rated, which usually means shorter tenancies and higher turnover. Who's the typical renter profile here, and what's been the actual vacancy rate?
- Crime grade is F in this area — have there been break-ins, vandalism, or insurance claims at this property in the last 3 years? What carrier currently insures it and at what premium?
- What's the average days-on-market for RENTAL listings here right now (not sales)? A rising rental-DOM trend means longer vacancies and softer asking-rent achievability than the comps imply.
- What's the recent tenant-quality profile in this submarket — average credit score on applications, eviction rate, late-payment / NSF rate, and stable-employment percentage? A property-management company in the area should have these aggregated.
- How much new for-sale + rental construction is in the pipeline within 1–3 miles? Heavy new supply typically softens prices + rents 12–24 months out; constrained supply supports both.
Investment metrics
- 1% rule
- 1.21% ✓
- Cap rate
- 10.70%
- Cash-on-cash
- 15.75%
- DSCR
- 1.70
- GRM
- 6.9
CMA / ARV
- ARV (on-the-fly)
- $153,000
- Comps found
- 12
Show comp detail 12 sales within ~0.75 mi
| Address | Dist | Beds/Ba | Sqft | Sold | Price | $/sf | Match |
|---|---|---|---|---|---|---|---|
| 761 Bartlett Ave | 0.00mi | 2/2.0 | 1,100 (+10%) | 6mo | $46,800 | $43 | 76 |
| 728 Bartlett Ave | 0.05mi | 3/1.0 (+1) | 1,100 (+10%) | 2mo | $40,000 | $36 | 72 |
| 1822 Aiken St | 0.37mi | 3/1.0 (+1) | 1,050 (+5%) | 3mo | $49,000 | $47 | 65 |
| 412 E Federal St | 0.57mi | 2/2.5 | 960 (-4%) | 8mo | $215,000 | $224 | 56 |
| 1658 E 25th St | 0.62mi | 3/1.0 (+1) | 1,040 (+4%) | 4mo | $70,000 | $67 | 54 |
| 616 E 30th St | 0.64mi | 2/1.0 | 1,092 (+9%) | 1mo | $65,000 | $60 | 52 |
| 3103 Independence St | 0.69mi | 2/1.0 | 930 (-7%) | 5mo | $145,000 | $156 | 50 |
| 1652 Darley Ave | 0.56mi | 3/1.0 (+1) | 1,100 (+10%) | 0mo | $52,500 | $48 | 50 |
| 3045 Frisby St | 0.73mi | 3/1.5 (+1) | 1,056 (+6%) | 3mo | $162,000 | $153 | 49 |
| 1611 Latrobe St | 0.58mi | 1/1.0 (-1) | 900 (-10%) | 8mo | $195,000 | $217 | 43 |
| 2956 Greenmount Ave | 0.69mi | 3/2.0 (+1) | 1,130 (+13%) | 1mo | $209,395 | $185 | 39 |
| 3132 Ellerslie Ave | 0.74mi | 3/1.0 (+1) | 870 (-13%) | 0mo | $170,000 | $195 | 37 |
Match score weights: distance 35% · size 25% · config 20% · recency 20%. Top-matched comps best support the ARV.
Projected returns pro-forma
-3.0% appreciation · 1.63% rent growth · sell at horizon
- IRR
- 2.7%
- Equity multiple
- 1.10×
- Total profit
- $3,668
- Equity at exit
- $19,383
- IRR
- 10.9%
- Equity multiple
- 1.80×
- Total profit
- $29,199
- Equity at exit
- $11,240
Cash invested: $36,400 (down + closing). Projections, not guarantees.
Landlord ↔ Tenant lean methodology
- Overall (CITY)
- 12 Strongly Tenant-Friendly
- State Maryland
- 27 Tenant-Leaning · D+14
- County
- — inherits STATE
- City Baltimore
- 12 Strongly Tenant-Friendly · D+58
ZIP-level market 21218
- Rents YoY
- 1.6%
- Active inventory
- 325
- Price-to-rent
- 6.9×
Monthly cashflow live
- Estimated rent
- $1,569 high interval (Pro) →
- Mortgage (P&I)
- −$682
- Tax from tax record
- −$26 /mo · $314/yr
- Insurance
- −$54
- Flood insurance flood zone
- −$56 /mo · $666/yr
- HOA
- −$0
- Vacancy / Maint / Mgmt
- −$330
- Net cashflow
- $422
Break-even live
UW: 25.0% down · 7.5% · 30yr · 1.5% tax · 5.0% vac · 8.0% maint · 8.0% mgmt
Financing live
Cash to close
- Down payment
- $32,500
- Closing costs
- $3,900
- Reserves months
- —
- Total cash needed
- —
Loan-product check · same deal, 3 products live
Conventional
25% down · 7.5% · 30yr
- Down + closing
- —
- Monthly P&I
- —
- Monthly cashflow
- —
- DSCR
- —
- Eligible?
- —
Personal DTI + credit; lowest rate.
DSCR
20% down · 8.5% · 30yr
- Down + closing
- —
- Monthly P&I
- —
- Monthly cashflow
- —
- DSCR
- —
- Eligible?
- —
No personal income docs; deal must DSCR.
Hard money
10% down · 12.0% · 12mo
- Down + closing
- —
- Monthly P&I
- —
- Monthly cashflow
- —
- DSCR
- —
- Eligible?
- —
Short-term bridge; refi at stabilization.
Rent comps 40 comps
| Address | Beds | Baths | Sqft | Rent | $/sqft | DOM | Units | Dist |
|---|---|---|---|---|---|---|---|---|
| 646 Cokesbury Ave Baltimore, MD | 2.0 | 1.5 | 1200 | $1,299 | $1.08 | 43d | 1 | 0.15mi |
| 2535 Greenmount Ave Unit 2 Baltimore, MD | 2.0 | 1.0 | 800 | $1,195 | $1.49 | 43d | 1 | 0.36mi |
| 2400 Barclay St Unit A Baltimore, MD | 1.0 | 1.0 | 750 | $1,190 | $1.59 | 20d | 1 | 0.36mi |
| 2516 Barclay St Baltimore, MD | 3.0 | 1.0 | 992 | $1,375 | $1.39 | 16d | 1 | 0.43mi |
| 450 E Lorraine Ave Baltimore, MD | 3.0 | 1.0 | 1344 | $1,695 | $1.26 | 43d | 1 | 0.44mi |
| 1243 E Lanvale St Baltimore, MD | 3.0 | 1.5 | 1281 | $1,750 | $1.37 | 2d | 1 | 0.45mi |
| 1243 E Lanvale St Baltimore, MD | 3.0 | 1.5 | 1281 | $1,750 | $1.37 | 16d | 1 | 0.45mi |
| 428 E Lorraine Ave Baltimore, MD | 3.0 | 2.0 | 1344 | $1,875 | $1.40 | 23d | 1 | 0.46mi |
| 428 E Lorraine Ave Unit 1 Baltimore, MD | 3.0 | 1.5 | 1344 | $1,875 | $1.40 | 43d | 1 | 0.46mi |
| 411 E Lorraine Ave Baltimore, MD | 3.0 | 1.5 | 1344 | $2,200 | $1.64 | 23d | 1 | 0.46mi |
| 2314 Hunter St Unit 1 Baltimore, MD | 1.0 | 1.0 | 1000 | $1,185 | $1.19 | 43d | 1 | 0.46mi |
| 400 E Lorraine Ave Baltimore, MD | 3.0 | 1.0 | 1500 | $1,800 | $1.20 | 20d | 1 | 0.48mi |
| 1803 N Dallas St Baltimore, MD | 2.0 | 2.5 | 1250 | $2,100 | $1.68 | 23d | 1 | 0.49mi |
| 1512 E Lafayette Ave Baltimore, MD | 3.0 | 2.5 | 1476 | $1,950 | $1.32 | 43d | 1 | 0.50mi |
| 1514 E Lafayette Ave Baltimore, MD | 3.0 | 1.5 | 1215 | $2,000 | $1.65 | 23d | 1 | 0.50mi |
| 1607 Cliftview Ave Baltimore, MD | 3.0 | 1.0 | 1200 | $1,475 | $1.23 | 43d | 1 | 0.50mi |
| 448 Pitman Pl Baltimore, MD | 2.0 | 1.5 | 940 | $2,145 | $2.28 | 23d | 1 | 0.50mi |
| 519 E 28th St Baltimore, MD | 3.0 | 2.0 | 1500 | $2,000 | $1.33 | 4d | 1 | 0.50mi |
| 2300 N Calvert St Baltimore, MD | 1.0–2.0 | 1.0–2.0 | 1100 | $1,995 | $1.81 | 2d | 2 | 0.50mi |
| 2606 Cecil Ave Baltimore, MD | 2.0 | 1.5 | 1200 | $1,500 | $1.25 | 43d | 1 | 0.51mi |
| 1711 Latrobe St Baltimore, MD | 2.0 | 1.5 | 1000 | $1,700 | $1.70 | 23d | 1 | 0.51mi |
| 458 E Federal St Baltimore, MD | 2.0 | 2.5 | 1300 | $1,850 | $1.42 | 4d | 1 | 0.52mi |
| 456 E Federal St Baltimore, MD | 2.0 | 2.0 | 1450 | $1,850 | $1.28 | 43d | 1 | 0.53mi |
| 1708 Latrobe St Baltimore, MD | 2.0 | 1.0 | 750 | $2,250 | $3.00 | 23d | 1 | 0.53mi |
| 2821 Mathews St Unit 27-666 Baltimore, MD | 1.0 | 1.0 | 730 | $1,050 | $1.44 | 23d | 1 | 0.54mi |
| 2821 Mathews St Unit 27-668 Baltimore, MD | 2.0 | 1.0 | 730 | $1,050 | $1.44 | 23d | 1 | 0.54mi |
| 2315 St Paul St Baltimore, MD | 1.0–2.0 | 1.0 | 579 | $1,595 | $2.75 | 1d | 5 | 0.54mi |
| 2503 N Calvert St Unit 1 Baltimore, MD | 1.0 | 1.0 | 750 | $900 | $1.20 | 23d | 1 | 0.55mi |
| 412 E Federal St Baltimore, MD | 2.0 | 2.5 | 1100 | $1,700 | $1.55 | 23d | 1 | 0.56mi |
| 139 E North Ave Unit 3 Baltimore, MD | 1.0 | 1.0 | 1050 | $1,300 | $1.24 | 23d | 1 | 0.56mi |
| 1602 Latrobe St Baltimore, MD | 1.0 | 1.0 | 845 | $1,790 | $2.12 | 43d | 1 | 0.59mi |
| 2440 Saint Paul St Unit 4E Baltimore, MD | 2.0 | 2.0 | 891 | $1,625 | $1.82 | 43d | 1 | 0.59mi |
| 402 E 28th St Baltimore, MD | 3.0 | 1.0 | 1436 | $2,200 | $1.53 | 43d | 1 | 0.60mi |
| 436 Ilchester Ave Unit 1 Baltimore, MD | 2.0 | 2.0 | 1002 | $1,350 | $1.35 | 43d | 1 | 0.61mi |
| 436 Ilchester Ave Unit 2 Baltimore, MD | 1.0 | 1.0 | 985 | $1,195 | $1.21 | 43d | 1 | 0.62mi |
| 2105 N Charles St #1 Baltimore, MD | 1.0 | 1.0 | 1000 | $1,450 | $1.45 | 17d | 1 | 0.62mi |
| 1756 E North Ave Baltimore, MD | 1.0 | 1.0 | 800 | $1,000 | $1.25 | 43d | 1 | 0.64mi |
| 1726 Saint Paul St Baltimore, MD | 1.0 | 1.0 | 700 | $1,175 | $1.68 | 23d | 1 | 0.66mi |
| 210 Federal St Baltimore, MD | 3.0 | 1.0 | 900 | $1,350 | $1.50 | 20d | 1 | 0.66mi |
| 2637 Saint Paul St Unit 1A Baltimore, MD | 2.0 | 1.0 | 850 | $1,450 | $1.71 | 4d | 1 | 0.67mi |
Listing history 5 events
-
2026-06-10status $130,000 Pending 5 DOM
-
2026-06-09days on market $130,000 Active 5 DOM
-
2026-06-08days on market $130,000 Active 4 DOM
-
2026-06-07remarks 693-char remark
-
2026-06-07$130,000 Active 3 DOM
ⓘ Source: listings_history table (triggers on properties + properties_extension) + one-shot
backfill from property_details.listing_events for pre-trigger history.
Tax reassessment forecast MD · Partial reset (capped growth)
- Current annual tax
- $314 · $26/mo
- Projected year-2 tax
- $865 · $72/mo
- Expected delta
- +$552/yr (+$46/mo · 175.9%)
ⓘ Screening estimate from a state-policy table — verify with the county assessor before closing.
Climate risk First Street
- Flood 8/10 Severe FEMA zone X (unshaded) · 99% chance over 30 yrs
- Wildfire 1/10 Low
- Heat 7/10 Severe 7 d/yr ≥103°F today · 15 d/yr by 30 yrs out
- Wind 6/10 Major 27% chance of damaging wind over 30 yrs
- Air quality 4/10 Moderate 6 unhealthy d/yr today · 7 by 30 yrs out
Nearby sold comps map
Loading sold comps map…
Walkable amenities ~0.75 mi
Loading nearby amenities…
Taxation est. · year 1
- Rental income
- $18,833
- − Mortgage interest
- −$7,282
- − Property taxes
- −$314
- − Insurance
- −$1,316
- − Repairs & maintenance
- −$1,507
- − Management
- −$1,507
- − Depreciation
- −$3,782
- Taxable income
- $3,126
- Est. tax owed @ 24.0%
- −$750
- After-tax cash flow
- $4,317/yr
For passive investors: Depreciation is non-cash, so a rental often shows a tax loss while cash-flowing — sheltering income. Rental losses are passive: they offset passive income freely, and up to $25,000/yr can offset ordinary (W-2) income if you actively participate and your MAGI is under $100k (phasing out to $0 by $150k); unused losses carry forward. On sale, claimed depreciation is recaptured at up to 25%, and gains may owe capital-gains tax (a 1031 exchange can defer both). Figures are a year-1 estimate at your 24.0% rate — not tax advice; consult a CPA.
Schools (NCES district)
- District
- Baltimore City Public Schools
- NCES district ID
- 2400090
- Math proficiency
- 7% ▼ -9.00%
- Reading proficiency
- 16% ▼ -5.00%
- Median HH income
- $42,108
- Composite
- 10.08/100
- National rank
- #9805
- State rank
- #24 of 24 in MD
Livability — Baltimore
- Score
- 76/100
- State rank
- #90
- US rank
- #3396
Category grades
Schools grade is shown separately in the Schools card above.
Census & demographics
- Census place
- Baltimore, MD
- County
- Baltimore City · 558,601 people
- City population
- 588,727
- Metro
- Baltimore-Columbia-Towson, MD
- Population (ZIP)
- 44,014
- Household income
- $62,488
- Rent vs Own
- Severe rent burden
- 2564.0
Population outlook (Baltimore County) Hauer SSP2
- Today (2025)
- 624,249 people
- By 2030
- 621,541 · -0.4%
- By 2040
- 609,756 · -2.3%
- By 2050
- 597,249 · -4.3%
- By 2075
- 552,236 · -11.5%
- By 2100
- 513,934 · -17.7%
Race, ethnicity, and origin ACS 2023
- Neighborhood character
- Diverse neighborhood (Simpson 0.58)
- Race & ethnicity
- Black 60% White 26% Two or more races 6% Hispanic / Latino 5% Asian 5%
- Hispanic origin (detail)
- Common ancestry
- Romanian 2% Italian 1% Scotch-Irish 1%
- Foreign-born
- 10% · Canada, China, South Korea
- Languages at home
- 87% English-only · Spanish 4% French/Haitian/Cajun 2% Chinese 2%
Political lean MEDSL · Baltimore
- 2024 margin
- Solid D (+73.0) · D 85.2% · R 12.2% · Other 2.6%
- 2008→2024 swing
- -2.5pp toward R · 2008: 75.5pp · 2024: 73.0pp
- All cycles
- 2024: D+73.0 2020: D+76.6 2016: D+74.6 2012: D+76.4 2008: D+75.5
Not yet ingested
- Civics
- —
Market trends
- HPI YoY
- ▼ -463.14%
- Current HPI
- 292.3986
- Rent YoY
- ▲ 1.63%
- Metro
- Baltimore-Columbia-Towson, MD
- State GDP YoY
- ▲ 2.97%
- F500 in state
- 12
Industry mix (Fortune 500 HQ in MD)
| Industry | F500 HQs | Revenue |
|---|---|---|
| Aerospace / Defense | 1 | $71B |
|
||
| Utilities | 1 | $25B |
|
||
| Hotels | 1 | $24B |
|
||
| Consumer Goods | 1 | $7B |
|
||
| Real Estate | 1 | $6B |
|
||
| Chemicals | 1 | $2B |
|
||
Price history
+116.7% since first listed6 events — show timeline
- 2026-06-04 Listed $130,000 BRIGHT MLS
- 2026-06-04 Coming Soon $130,000 BRIGHT MLS
- 2025-12-18 Sold (Public Records) $46,800 Public Records
- 2025-12-11 Sold (MLS) $46,800 BRIGHT MLS
- 2025-11-21 Contingent — BRIGHT MLS
- 2025-11-07 Listed $60,000 BRIGHT MLS
Property tax history
-3.5%/yrLatest (2025): $314 · +8.8% YoY. Source: county tax records.
Cash-flow waterfall
monthlySold comps — $/sqft
last 12 mo · ≤1 miLoading sold comps…