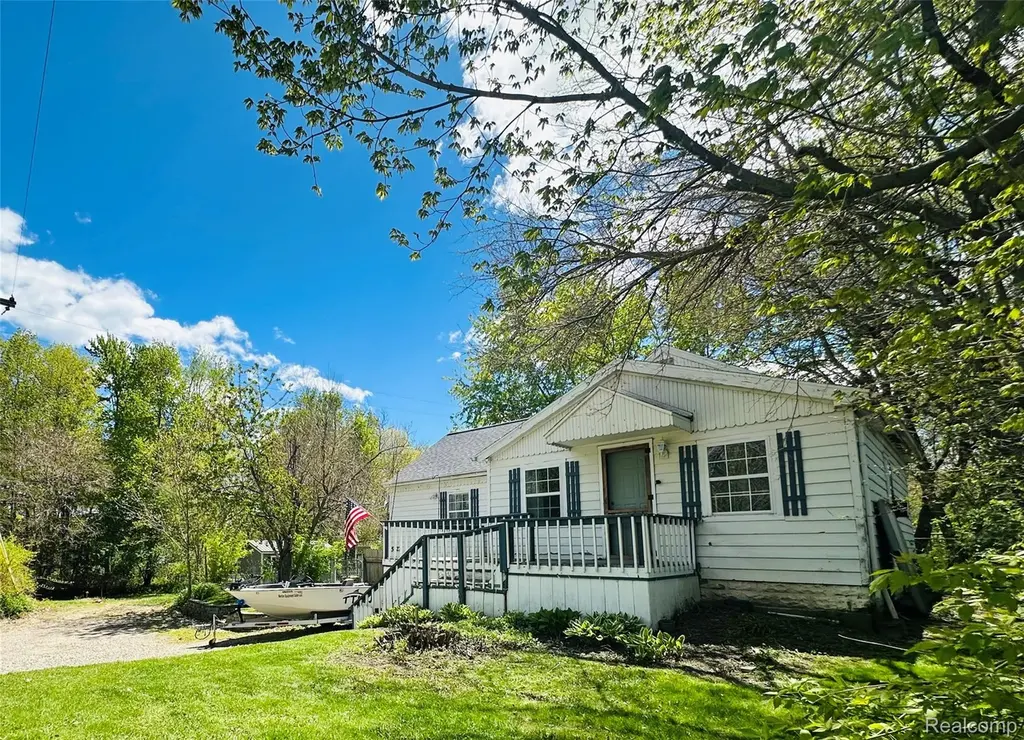
5827 Annibal Dr · Davison, MI
Flood risk 1/10 · Minimal
- FEMA flood zone
- X (unshaded)
- Chance of flooding over 30 yrs
- 0.0%
- Est. flood insurance / yr
- $507 – $1,088
Fire risk 1/10 · Minimal
- Est. fire insurance / yr
- $784 – $1,456
Heat risk 2/10 · Minimal
- Hot days now (above 97°F)
- 7 days/yr
- Hot days in 30 yrs
- 14 days/yr
Wind risk 1/10 · Minimal
- Chance of severe wind over 30 yrs
- —
Air-quality risk 3/10 · Minor
- Unhealthy air days now
- 2 days/yr
- Unhealthy air days in 30 yrs
- 3 days/yr
Risk factors via First Street. Map © Google.
Why this score? — see what drove the D grade
The composite is a weighted blend of 9 inputs, each scored 0–100. Each bar is that input's sub-score; the figure is the points it added to the 100-point composite (weight × sub-score).
- Cash flow +14.7/30.0
- ARV discount +7.5/15.0
- DSCR +4.5/10.0
- Livability +4.2/5.0
- 1% rule +4.1/10.0
- Schools +3.5/10.0
- Rent growth +2.5/5.0
- Condition / age +2.5/5.0
- Appreciation +0.0/10.0
$139,900
🖨 Deal sheet (PDF) 📄 Offer letter ✓ Due diligence
Listing remarks MLS
Please make sure all lights are off and doors are locked and key is back in the lockbox BATVAI
Key facts
- 7,405 sq ft lot
- Built 1930
- Listed 7 days
Property features AI
Exterior
- Parking: No garage
- Utilities: Private well water; Sewer available
- Home design: Single-family residence; One story; Ground-level entry
- Construction: Wood siding; Block foundation; Asphalt roof; Built area above grade: 960 square feet
- Exterior features: Fenced yard; Lake privileges (Potter Lake); Paved road access
Interior
- Bathrooms: 1 full bathroom
- Heating & cooling: Forced air heating (natural gas); No cooling
- Interior features: Sump pump in basement; Basement present
Neighborhood map
What this means for you Summary
Snapshot
- This is a 2-bed/1.0-bath land listed at $140k.
Deal economics
- At list price, monthly cash flow is $35 ($418/yr) — positive.
- The deal already cash-flows at list — no discount required.
- To meet the 1% rule (rent ≥ 1% of price), the offer needs to be $127k (9.4% below list).
- Recommended offer: $127k (9.4% below list) — sets the bar for 1% rule.
- Cap rate 6.6% vs local median 1.8% in Davison — top-decile yield for the area; either an underpriced asset or a hidden risk that comps aren't pricing in. Stress-test before assuming the spread holds.
Location & tenants
- Location reads 83/100 on livability (#45 in MI, #950 nationally) — a professional / high-income tenant draw. Strengths: amenities A+, cost of living A+, housing A+; Watch: employment D, commute F.
- Lapeer Community Schools (town): math 31% / reading 49% proficiency, ranked #202 of 540 in MI (top 37%) — families likely to look elsewhere, expect single-tenant / working-renter base with shorter leases.
- Market conditions: 186 active listings in the ZIP; 152 units permitted in Lapeer County in 2024 (0 in 5+ unit buildings).
Forward outlook
- Local home prices are declining (-3.0%/yr); year-one equity from $967 of loan paydown is wiped out by about $4k of value loss. Plan a longer hold.
- Lapeer County population projected at -10% by 2050 — secular population decline; favor cash flow + early exit over multi-decade hold.
Negotiation context
- Only 7 days on market — expect competitive offers; lowballing is unlikely to land.
- 6 sale attempts since 21y ago with the ask held roughly flat each time — persistent listings suggest the price (not the market) is what's stuck; bring a comps-based counter.
Risks & watch-outs
- Watch-outs: built in 1930 — expect roof / HVAC / electrical / plumbing capex.
Questions for the listing agent
- Built in 1930 — when were the roof, HVAC, electrical panel, plumbing, and water heater last replaced?
- Is there a deadline driving the sale (1031 exchange, divorce, estate, relocation)? That informs how much negotiation room exists.
- Schools are B-rated — typically a magnet for longer-tenancy family renters. What's the average tenant stay here, and is there a school-zone premium baked into asking?
- The area grade is low — what's the realistic commute time and amenity access for the typical tenant pool here? Any planned neighborhood developments (good or bad) we should know about?
- What's the average days-on-market for RENTAL listings here right now (not sales)? A rising rental-DOM trend means longer vacancies and softer asking-rent achievability than the comps imply.
- What's the recent tenant-quality profile in this submarket — average credit score on applications, eviction rate, late-payment / NSF rate, and stable-employment percentage? A property-management company in the area should have these aggregated.
- How much new for-sale + rental construction is in the pipeline within 1–3 miles? Heavy new supply typically softens prices + rents 12–24 months out; constrained supply supports both.
Investment metrics
- 1% rule
- 0.91% ✗
- Cap rate
- 6.59%
- Cash-on-cash
- 1.07%
- DSCR
- 1.05
- GRM
- 9.2
CMA / ARV
No comps found within radius.
Projected returns pro-forma
-3.0% appreciation · 3.0% rent growth · sell at horizon
- IRR
- -14.6%
- Equity multiple
- 0.48×
- Total profit
- $-20,433
- Equity at exit
- $20,860
- IRR
- -5.9%
- Equity multiple
- 0.62×
- Total profit
- $-14,859
- Equity at exit
- $12,096
Cash invested: $39,172 (down + closing). Projections, not guarantees.
Landlord ↔ Tenant lean methodology
- Overall (STATE)
- 62 Landlord-Friendly
- State Michigan
- 62 Landlord-Friendly · EVEN
- County
- — inherits STATE
- City
- — inherits STATE
ZIP-level market 48446
- Active inventory
- 186
- Price-to-rent
- 9.2×
Monthly cashflow live
- Estimated rent
- $1,268 medium interval (Pro) →
- Mortgage (P&I)
- −$734
- Tax est. 1.5%
- −$175 /mo · $2,098/yr
- Insurance
- −$58
- HOA
- −$0
- Vacancy / Maint / Mgmt
- −$266
- Net cashflow
- $35
Break-even live
Sensitivity live
| Price | -10% $132 | -5% $83 | +0% $35 | +5% $-14 | +10% $-62 |
|---|---|---|---|---|---|
| Rent | -10% $-65 | -5% $-15 | +0% $35 | +5% $85 | +10% $135 |
| Rate | -1.0pp $105 | -0.5pp $70 | base $35 | +0.5pp $-1 | +1.0pp $-38 |
UW: 25.0% down · 7.5% · 30yr · 1.5% tax · 5.0% vac · 8.0% maint · 8.0% mgmt
Financing live
Cash to close
- Down payment
- $34,975
- Closing costs
- $4,197
- Reserves months
- —
- Total cash needed
- —
Loan-product check · same deal, 3 products live
Conventional
25% down · 7.5% · 30yr
- Down + closing
- —
- Monthly P&I
- —
- Monthly cashflow
- —
- DSCR
- —
- Eligible?
- —
Personal DTI + credit; lowest rate.
DSCR
20% down · 8.5% · 30yr
- Down + closing
- —
- Monthly P&I
- —
- Monthly cashflow
- —
- DSCR
- —
- Eligible?
- —
No personal income docs; deal must DSCR.
Hard money
10% down · 12.0% · 12mo
- Down + closing
- —
- Monthly P&I
- —
- Monthly cashflow
- —
- DSCR
- —
- Eligible?
- —
Short-term bridge; refi at stabilization.
Listing history 10 events
-
2026-05-15$139,900 Active 95-char remark
-
2026-05-14$139,900 Active 94-char remark
Show marketing remark (94 chars)
Please make sure all lights are off and doors are locked and key is back in the lockbox BATVAI
-
2015-01-12historical
-
2015-01-11historical
-
2015-01-11historical
-
2014-07-11$85,000
-
2014-07-11$85,000
-
2014-07-11$85,000
-
2005-08-31soldstatus $72,900
-
2005-06-10$69,900
ⓘ Source: listings_history table (triggers on properties + properties_extension) + one-shot
backfill from property_details.listing_events for pre-trigger history.
Climate risk First Street
- Flood 1/10 Low FEMA zone X (unshaded) · 0% chance over 30 yrs
- Wildfire 1/10 Low
- Heat 2/10 Low 7 d/yr ≥97°F today · 14 d/yr by 30 yrs out
- Wind 1/10 Low
- Air quality 3/10 Moderate 2 unhealthy d/yr today · 3 by 30 yrs out
Nearby sold comps map
Loading sold comps map…
Walkable amenities ~0.75 mi
Loading nearby amenities…
Taxation est. · year 1
- Rental income
- $15,215
- − Mortgage interest
- −$7,837
- − Property taxes
- −$2,098
- − Insurance
- −$700
- − Repairs & maintenance
- −$1,217
- − Management
- −$1,217
- − Depreciation
- −$4,070
- Taxable loss
- −$1,924
- Est. tax savings @ 24.0%
- +$462
- After-tax cash flow
- $880/yr
For passive investors: Depreciation is non-cash, so a rental often shows a tax loss while cash-flowing — sheltering income. Rental losses are passive: they offset passive income freely, and up to $25,000/yr can offset ordinary (W-2) income if you actively participate and your MAGI is under $100k (phasing out to $0 by $150k); unused losses carry forward. On sale, claimed depreciation is recaptured at up to 25%, and gains may owe capital-gains tax (a 1031 exchange can defer both). Figures are a year-1 estimate at your 24.0% rate — not tax advice; consult a CPA.
Schools (NCES district)
- District
- Lapeer Community Schools
- NCES district ID
- 2621180
- Math proficiency
- 31% ▼ -9.00%
- Reading proficiency
- 49% ▼ -4.00%
- Median HH income
- $53,749
- Composite
- 34.79/100
- National rank
- #5113
- State rank
- #202 of 540 in MI
Livability — Davison
- Score
- 83/100
- State rank
- #45
- US rank
- #950
Category grades
Schools grade is shown separately in the Schools card above.
Census & demographics
- County
- Lapeer County · 30,581 people
- City population
- 33,757
- Metro
- Detroit-Warren-Dearborn, MI
- Population (ZIP)
- 30,581
- Household income
- $66,062
- Rent vs Own
- Severe rent burden
- 908.0
Population outlook (Lapeer County) Hauer SSP2
- Today (2025)
- 89,826 people
- By 2030
- 89,535 · -0.3%
- By 2040
- 86,695 · -3.5%
- By 2050
- 80,566 · -10.3%
- By 2075
- 65,783 · -26.8%
- By 2100
- 46,584 · -48.1%
Race, ethnicity, and origin ACS 2023
- Neighborhood character
- Predominantly White (89%)
- Race & ethnicity
- White 89% Two or more races 6% Hispanic / Latino 3% Black 3%
- Common ancestry
- Romanian 6% Lithuanian 4% Slovak 3%
- Foreign-born
- 1% · Canada
- Languages at home
- 98% English-only · Spanish 1%
Political lean MEDSL · Lapeer
- 2024 margin
- Solid R (+39.8) · D 29.5% · R 69.3% · Other 1.3%
- 2008→2024 swing
- -36.8pp toward R · 2008: -3.0pp · 2024: -39.8pp
- All cycles
- 2024: R+39.8 2020: R+36.3 2016: R+38.3 2012: R+11.5 2008: R+3.0
Not yet ingested
- Civics
- —
Market trends
- HPI YoY
- ▼ -243.58%
- Current HPI
- 212.3665
- Rent YoY
- —
- Metro
- Detroit-Warren-Dearborn, MI
- State GDP YoY
- ▲ 1.37%
- F500 in state
- 28
Industry mix (Fortune 500 HQ in MI)
| Industry | F500 HQs | Revenue |
|---|---|---|
| Automotive Parts | 3 | $48B |
|
||
| Automotive | 2 | $372B |
|
||
| Chemicals | 1 | $45B |
|
||
| Automotive Retail | 1 | $29B |
|
||
| Healthcare / Medical Devices | 1 | $23B |
|
||
| Automotive Technology | 1 | $20B |
|
||
Price history
+93.1% since first listed14 events — show timeline
- 2026-06-11 Sold (MLS) $135,000 REALCOMP
- 2026-06-11 Sold (MLS) $135,000 MiRealSource-MiMLS
- 2026-05-21 Pending — REALCOMP
- 2026-05-21 Pending — MiRealSource-MiMLS
- 2026-05-15 Listed $139,900 REALCOMP
- 2026-05-14 Listed $139,900 MiRealSource-MiMLS
- 2015-01-12 Listing Removed — MiRealSource-MiMLS
- 2015-01-11 Listing Removed — MiRealSource-MiMLS
- 2015-01-11 Listing Removed — REALCOMP
- 2014-07-11 Listed $85,000 MiRealSource-MiMLS
- 2014-07-11 Listed $85,000 REALCOMP
- 2014-07-11 Listed $85,000 MiRealSource-MiMLS
- 2005-08-31 Sold (MLS) $72,900 MiRealSource-MiMLS
- 2005-06-10 Listed $69,900 MiRealSource-MiMLS
Property tax history
+7.5%/yrLatest (2025): $159 · +2.3% YoY. Source: county tax records.
Cash-flow waterfall
monthlySold comps — $/sqft
last 12 mo · ≤1 miLoading sold comps…