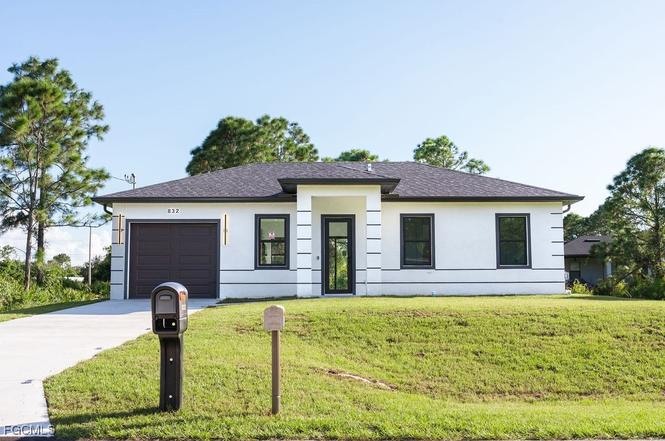
832 Carpenter St E · Lehigh Acres, FL
Flood risk 1/10 · Minimal
- FEMA flood zone
- X (unshaded)
- Chance of flooding over 30 yrs
- 0.0%
- Est. flood insurance / yr
- $507 – $1,088
Fire risk 4/10 · Minor
- Est. fire insurance / yr
- $947 – $1,759
Heat risk 9/10 · Severe
- Hot days now (above 108°F)
- 7 days/yr
- Hot days in 30 yrs
- 27 days/yr
Wind risk 10/10 · Severe
- Chance of severe wind over 30 yrs
- 99.0%
Air-quality risk 2/10 · Minimal
- Unhealthy air days now
- 1 days/yr
- Unhealthy air days in 30 yrs
- 2 days/yr
Risk factors via First Street. Map © Google.
Why this score? — see what drove the D- grade
The composite is a weighted blend of 9 inputs, each scored 0–100. Each bar is that input's sub-score; the figure is the points it added to the 100-point composite (weight × sub-score).
- Appreciation +10.0/10.0
- ARV discount +7.5/15.0
- Cash flow +6.6/30.0
- Schools +4.1/10.0
- Livability +3.0/5.0
- Condition / age +2.5/5.0
- 1% rule +1.7/10.0
- Rent growth +1.3/5.0
- DSCR +0.9/10.0
$280,000
🖨 Deal sheet 📄 Offer letter ✓ Due diligence
Listing remarks MLS
This prime lot is a beacon for single family residential development, ideally situated just off Bell Blvd. Embrace the perfect balance of convenience and tranquility, with proximity to schools and shopping centers while being tucked away from the hectic urban pace. Bring your vision to life without limitations. Don't miss this opportunity to make your real estate dreams a reality!
Key facts
- Custom bathrooms
- High-end appliances
- Led lighting
Tags
Property features AI
Finance
- Financial info: Pets allowed
- HOA & community: Non-gated community; Association fee includes trash (no fee listed)
Exterior
- Parking: Attached garage with garage door opener; Garage fits 1–2 vehicles (1 covered space listed, parking described as two spaces)
- Security: Smoke detectors
- Utilities: Cable available; Septic tank; Well water
- Home design: Single-story home; New construction; Faces west; RS-1 zoning
- Construction: Built with block, concrete and stucco; Shingle roof
- Exterior features: Security / high impact doors; None listed (additional exterior features not provided); Paved road access; Rectangular lot; East exposure
Interior
- Kitchen: Dishwasher; Microwave; Range; Refrigerator; Kitchen island; Pantry; Eat-in kitchen
- Bedrooms: Bedroom located on the main level
- Flooring: Tile flooring
- Bathrooms: 3 full bathrooms; Separate shower (no tub specified)
- Heating & cooling: Central electric heating; Central electric cooling (central air)
- Interior features: Bedroom on main level; Eat-in kitchen; Kitchen island; Custom mirrors; Pantry; Separate shower; Shower only; Split bedrooms; Single hung windows; Impact glass windows; Unfurnished
- Laundry & utility: Washer; Dryer; Laundry inside
Neighborhood map
What this means for you Summary
Snapshot
- This is a 3-bed/3.0-bath land listed at $280k.
Deal economics
- At list price, monthly cash flow is $-460 ($-6k/yr) — negative.
- To cash-flow at today's rent, offer at most $213k (23.8% below list).
- To meet the 1% rule (rent ≥ 1% of price), the offer needs to be $187k (33.3% below list).
- Recommended offer: $187k (33.3% below list) — sets the bar for 1% rule.
Location & tenants
- Location reads 59/100 on livability (#826 in FL) — a working-class tenant base; expect higher turnover. Strengths: cost of living A+, housing A+; Watch: crime C-, employment D+, schools D-.
- Lee (suburban): math 47% / reading 50% proficiency, ranked #42 of 73 in FL (top 58%) — families likely to look elsewhere, expect single-tenant / working-renter base with shorter leases.
- Market conditions: Rents falling (-4.7%/yr); 2460 active listings in the ZIP; 36 comparable units currently listed for rent nearby; rentals at typical pace (median 15d on market — plan ~3-4 weeks tenant-placement turnaround); 15,411 units permitted in Lee County in 2024 (4,686 in 5+ unit buildings).
- This rent runs 31% of the median local income ($72k/yr) — at the standard rent-burdened threshold; future hikes will face affordability resistance.
Forward outlook
- In year one you build about $30k of equity ($2k loan paydown + $28k appreciation (10.0% local appreciation)).
- Lee County population projected at +44% by 2050 — long-run rental-demand tailwind backs the buy-and-hold thesis.
- By year 2, paydown + projected appreciation supports a ~$48k cash-out refi (75% LTV) — recoverable capital for the next deal without selling this one.
Negotiation context
- It's been on market 237 days — a 12% lower offer ($246k) is reasonable based on typical stale-listing flexibility.
- 2 sale attempts since 2y ago; this cycle's ask has dropped $60k (18%) from the opening price — seller is motivated, your offer sets the floor, not the list.
- Current owner paid $18k; list at $280k implies a 1456% gain — meaningful room to come down on a strong offer.
Risks & watch-outs
- Climate carrying-cost: severe wind risk, 99% chance of damaging wind over 30y; extreme-heat days projected 7→27/yr by 2055 (HVAC capex compounding) — expect insurance premiums to compound above CPI over the hold.
Questions for the listing agent
- What do current leases actually rent for vs. the listed asking? Can we see a recent rent roll and the last 12 months of T-12 income?
- It's been on market 237 days. Have you received any prior offers? Is the seller open to a 33% concession, seller financing, or rate buy-down credit?
- Why hasn't it sold? Are there any deal-killer items the seller is aware of (foundation, flood, title, zoning, code violations)?
- Is there a deadline driving the sale (1031 exchange, divorce, estate, relocation)? That informs how much negotiation room exists.
- Schools are D-rated, which usually means shorter tenancies and higher turnover. Who's the typical renter profile here, and what's been the actual vacancy rate?
- The area grade is low — what's the realistic commute time and amenity access for the typical tenant pool here? Any planned neighborhood developments (good or bad) we should know about?
- What's the average days-on-market for RENTAL listings here right now (not sales)? A rising rental-DOM trend means longer vacancies and softer asking-rent achievability than the comps imply.
- What's the recent tenant-quality profile in this submarket — average credit score on applications, eviction rate, late-payment / NSF rate, and stable-employment percentage? A property-management company in the area should have these aggregated.
- How much new for-sale + rental construction is in the pipeline within 1–3 miles? Heavy new supply typically softens prices + rents 12–24 months out; constrained supply supports both.
Investment metrics
- 1% rule
- 0.67% ✗
- Cap rate
- 4.32%
- Cash-on-cash
- -7.05%
- DSCR
- 0.69
- GRM
- 12.5
CMA / ARV
No comps found within radius.
Projected returns pro-forma
10.0% appreciation · 0.0% rent growth · sell at horizon
- IRR
- 18.5%
- Equity multiple
- 2.50×
- Total profit
- $117,733
- Equity at exit
- $252,246
- IRR
- 16.7%
- Equity multiple
- 5.59×
- Total profit
- $360,022
- Equity at exit
- $543,978
Cash invested: $78,400 (down + closing). Projections, not guarantees.
Landlord ↔ Tenant lean methodology
- Overall (STATE)
- 87 Strongly Landlord-Friendly
- State Florida
- 87 Strongly Landlord-Friendly · R+3
- County
- — inherits STATE
- City
- — inherits STATE
ZIP-level market 33974
- Home prices YoY
- 5.8%
- Rents YoY
- -4.7%
- Active inventory
- 2460
- Price-to-rent
- 12.5×
Monthly cashflow live
- Estimated rent
- $1,867 high interval (Pro) →
- Mortgage (P&I)
- −$1,468
- Tax est. 1.5%
- −$350 /mo · $4,200/yr
- Insurance
- −$117
- HOA
- −$0
- Vacancy / Maint / Mgmt
- −$392
- Net cashflow
- $-460
Break-even live
UW: 25.0% down · 7.5% · 30yr · 1.5% tax · 5.0% vac · 8.0% maint · 8.0% mgmt
Financing live
Cash to close
- Down payment
- $70,000
- Closing costs
- $8,400
- Reserves months
- —
- Total cash needed
- —
Loan-product check · same deal, 3 products live
Conventional
25% down · 7.5% · 30yr
- Down + closing
- —
- Monthly P&I
- —
- Monthly cashflow
- —
- DSCR
- —
- Eligible?
- —
Personal DTI + credit; lowest rate.
DSCR
20% down · 8.5% · 30yr
- Down + closing
- —
- Monthly P&I
- —
- Monthly cashflow
- —
- DSCR
- —
- Eligible?
- —
No personal income docs; deal must DSCR.
Hard money
10% down · 12.0% · 12mo
- Down + closing
- —
- Monthly P&I
- —
- Monthly cashflow
- —
- DSCR
- —
- Eligible?
- —
Short-term bridge; refi at stabilization.
Rent comps 36 comps
| Address | Beds | Baths | Sqft | Rent | $/sqft | DOM | Units | Dist |
|---|---|---|---|---|---|---|---|---|
| 388 Bell Blvd S Lehigh Acres, FL | 3.0 | 2.0 | 1200 | $1,780 | $1.48 | 23d | 1 | 0.21mi |
| 350 Limerick Ave S Lehigh Acres, FL | 3.0 | 2.0 | 1199 | $1,800 | $1.50 | 3d | 1 | 0.23mi |
| 455 Bell Blvd Unit 1 Lehigh Acres, FL | 3.0 | 2.0 | 1142 | $1,600 | $1.40 | 23d | 1 | 0.27mi |
| 346 Bell Blvd S Lehigh Acres, FL | 3.0 | 2.0 | 1185 | $1,495 | $1.26 | 14d | 1 | 0.29mi |
| 346 Bell Blvd S Lehigh Acres, FL | 3.0 | 2.0 | 1185 | $1,495 | $1.26 | 3d | 1 | 0.29mi |
| 333 Bell Blvd S Lehigh Acres, FL | 3.0 | 2.0 | 1114 | $1,300 | $1.17 | 3d | 1 | 0.32mi |
| 759 Cane St E Lehigh Acres, FL | 3.0 | 2.0 | 1169 | $1,950 | $1.67 | 3d | 1 | 0.33mi |
| 382 McArthur Blvd Lehigh Acres, FL | 3.0 | 2.0 | 1055 | $2,200 | $2.09 | 23d | 1 | 0.48mi |
| 508 Bell Blvd S Lehigh Acres, FL | 3.0 | 2.0 | 1200 | $1,800 | $1.50 | 23d | 1 | 0.48mi |
| 713 Cardinal St E Lehigh Acres, FL | 3.0 | 2.0 | 1100 | $1,635 | $1.49 | 3d | 1 | 0.65mi |
| 573 Bell Blvd S Lehigh Acres, FL | 3.0 | 2.0 | 1218 | $1,900 | $1.56 | 14d | 1 | 0.77mi |
| 404 Chalet Ave S Lehigh Acres, FL | 3.0 | 2.0 | 1200 | $1,850 | $1.54 | 23d | 1 | 0.81mi |
| 406 Chalet Ave S Lehigh Acres, FL | 3.0 | 2.0 | 1200 | $1,850 | $1.54 | 23d | 1 | 0.82mi |
| 718 Sunrise Blvd Lehigh Acres, FL | 3.0 | 2.0 | 1100 | $1,610 | $1.46 | 23d | 1 | 0.89mi |
| 940 Sterling St E Lehigh Acres, FL | 4.0 | 2.0 | 1389 | $1,750 | $1.26 | 3d | 1 | 0.95mi |
| 604 Thomas Sherwin Ave S Lehigh Acres, FL | 4.0 | 2.0 | 1493 | $2,200 | $1.47 | 3d | 1 | 1.02mi |
| 397 Carrillon Ave S Lehigh Acres, FL | 3.0 | 2.0 | 1200 | $1,550 | $1.29 | 3d | 1 | 1.04mi |
| 970 Lakeside Dr Lehigh Acres, FL | 3.0 | 2.0 | 1325 | $1,800 | $1.36 | 19d | 1 | 1.06mi |
| 374 Compese Ave S Lehigh Acres, FL | 3.0 | 2.0 | 1200 | $1,750 | $1.46 | 16d | 1 | 1.11mi |
| 886 Milwaukee Blvd Lehigh Acres, FL | 3.0 | 2.0 | 1205 | $1,900 | $1.58 | 23d | 1 | 1.22mi |
| 684 Thomas Sherwin Ave S Lehigh Acres, FL | 3.0 | 2.0 | 1288 | $1,695 | $1.32 | 3d | 1 | 1.22mi |
| 538 Flamingo Ave S Lehigh Acres, FL | 3.0 | 2.0 | 1272 | $1,791 | $1.41 | 3d | 1 | 1.27mi |
| 515 Croydon Ave S Lehigh Acres, FL | 3.0 | 3.0 | 1253 | $2,200 | $1.76 | 3d | 1 | 1.28mi |
| 546 Whispering Wind Bnd Lehigh Acres, FL | 3.0 | 2.0 | 1437 | $1,950 | $1.36 | 2d | 1 | 1.28mi |
| 954 Pilgrim St E Lehigh Acres, FL | 3.0 | 2.0 | 1246 | $1,625 | $1.30 | 2d | 1 | 1.28mi |
| 635 Hawthorne Ave S Lehigh Acres, FL | 3.0 | 2.0 | 1029 | $1,300 | $1.26 | 21d | 1 | 1.35mi |
| 635 Hawthorne Ave S Lehigh Acres, FL | 3.0 | 2.0 | 1029 | $1,300 | $1.26 | 23d | 1 | 1.35mi |
| 874 Apartment St Lehigh Acres, FL | 3.0 | 2.0 | 1200 | $1,750 | $1.46 | 23d | 1 | 1.37mi |
| 538 Cypress Ave S Lehigh Acres, FL | 3.0 | 2.0 | 1055 | $1,699 | $1.61 | 3d | 1 | 1.37mi |
| 201 Fireside Ct Unit N/A Lehigh Acres, FL | 2.0 | 2.0 | 1370 | $1,675 | $1.22 | 3d | 1 | 1.39mi |
| 201 Fireside Ct Lehigh Acres, FL | 2.0 | 2.0 | 1370 | $1,550 | $1.13 | 3d | 1 | 1.39mi |
| 444 Genoa Ave S Lehigh Acres, FL | 4.0 | 2.0 | 1389 | $1,750 | $1.26 | 21d | 1 | 1.39mi |
| 202 Eaglesmere Dr Lehigh Acres, FL | 3.0 | 2.0 | 1443 | $1,695 | $1.17 | 23d | 1 | 1.39mi |
| 202 Eaglesmere Dr Lehigh Acres, FL | 3.0 | 2.0 | 1443 | $1,600 | $1.11 | 3d | 1 | 1.39mi |
| 217 Jayview Ave Lehigh Acres, FL | 3.0 | 2.0 | 1491 | $1,600 | $1.07 | 14d | 1 | 1.40mi |
| 442 Genoa Ave S Lehigh Acres, FL | 4.0 | 2.0 | 1365 | $1,750 | $1.28 | 3d | 1 | 1.40mi |
Listing history 20 events
-
2026-06-17days on market $280,000 Active 237 DOM
-
2026-06-16days on market $280,000 Active 236 DOM
-
2026-06-16days on market $280,000 Active 235 DOM
-
2026-06-13days on market $280,000 Active 233 DOM
-
2026-06-09days on market $280,000 Active 229 DOM
-
2026-06-07days on market $280,000 Active 227 DOM
-
2026-06-02days on market $280,000 Active 222 DOM
-
2026-06-01days on market $280,000 Active 221 DOM
-
2026-06-01days on market $280,000 Active 220 DOM
-
2026-04-28price $280,000
-
2026-03-24price $287,700
-
2026-02-20price $295,000
-
2025-12-07price $309,900
-
2025-11-04price $329,900
-
2025-10-23$340,000 Active
-
2024-05-24soldstatus $18,000
-
2024-05-09soldstatus $18,000 Closed 383-char remark
Show marketing remark (383 chars)
This prime lot is a beacon for single family residential development, ideally situated just off Bell Blvd. Embrace the perfect balance of convenience and tranquility, with proximity to schools and shopping centers while being tucked away from the hectic urban pace. Bring your vision to life without limitations. Don't miss this opportunity to make your real estate dreams a reality!
-
2024-04-12status Pending 383-char remark
Show marketing remark (383 chars)
This prime lot is a beacon for single family residential development, ideally situated just off Bell Blvd. Embrace the perfect balance of convenience and tranquility, with proximity to schools and shopping centers while being tucked away from the hectic urban pace. Bring your vision to life without limitations. Don't miss this opportunity to make your real estate dreams a reality!
-
2024-02-09$25,000 Active 383-char remark
Show marketing remark (383 chars)
This prime lot is a beacon for single family residential development, ideally situated just off Bell Blvd. Embrace the perfect balance of convenience and tranquility, with proximity to schools and shopping centers while being tucked away from the hectic urban pace. Bring your vision to life without limitations. Don't miss this opportunity to make your real estate dreams a reality!
-
2004-01-30soldstatus $12,000
ⓘ Source: listings_history table (triggers on properties + properties_extension) + one-shot
backfill from property_details.listing_events for pre-trigger history.
Climate risk First Street
- Flood 1/10 Low FEMA zone X (unshaded) · 0% chance over 30 yrs
- Wildfire 4/10 Moderate
- Heat 9/10 Extreme 7 d/yr ≥108°F today · 27 d/yr by 30 yrs out
- Wind 10/10 Extreme 99% chance of damaging wind over 30 yrs
- Air quality 2/10 Low 1 unhealthy d/yr today · 2 by 30 yrs out
Nearby sold comps map
Loading sold comps map…
Walkable amenities ~0.75 mi
Loading nearby amenities…
Taxation est. · year 1
- Rental income
- $22,400
- − Mortgage interest
- −$15,684
- − Property taxes
- −$4,200
- − Insurance
- −$1,400
- − Repairs & maintenance
- −$1,792
- − Management
- −$1,792
- − Depreciation
- −$8,145
- Taxable loss
- −$10,614
- Est. tax savings @ 24.0%
- +$2,547
- After-tax cash flow
- $-2,977/yr
For passive investors: Depreciation is non-cash, so a rental often shows a tax loss while cash-flowing — sheltering income. Rental losses are passive: they offset passive income freely, and up to $25,000/yr can offset ordinary (W-2) income if you actively participate and your MAGI is under $100k (phasing out to $0 by $150k); unused losses carry forward. On sale, claimed depreciation is recaptured at up to 25%, and gains may owe capital-gains tax (a 1031 exchange can defer both). Figures are a year-1 estimate at your 24.0% rate — not tax advice; consult a CPA.
Schools (NCES district)
- District
- Lee
- NCES district ID
- 1201080
- Math proficiency
- 47% ▼ -11.00%
- Reading proficiency
- 50% ▼ -4.00%
- Median HH income
- $49,518
- Composite
- 41.49/100
- National rank
- #3458
- State rank
- #42 of 73 in FL
Livability — Lehigh Acres
- Score
- 59/100
- State rank
- #826
- US rank
- #20055
Category grades
Schools grade is shown separately in the Schools card above.
Census & demographics
- Census place
- Lehigh Acres, FL
- County
- Lee County · 788,662 people
- City population
- 130,638
- Metro
- Cape Coral-Fort Myers, FL
- Population (ZIP)
- 19,927
- Household income
- $72,192
- Rent vs Own
- Severe rent burden
- 434.0
Population outlook (Lee County) Hauer SSP2
- Today (2025)
- 871,946 people
- By 2030
- 955,468 · +9.6%
- By 2040
- 1,113,587 · +27.7%
- By 2050
- 1,256,891 · +44.1%
- By 2075
- 1,560,270 · +78.9%
- By 2100
- 1,726,848 · +98.0%
Race, ethnicity, and origin ACS 2023
- Neighborhood character
- Diverse neighborhood (Simpson 0.64)
- Race & ethnicity
- Hispanic / Latino 52% Two or more races 31% White 26% Black 18%
- Hispanic origin (detail)
- Mexican 12% Puerto Rican 7% Cuban 20% Dominican 4%
- Common ancestry
- Hispanic 7% Italian 1% Portuguese 1%
- Foreign-born
- 32% · Canada, Jamaica
- Languages at home
- 48% English-only · Spanish 43% French/Haitian/Cajun 7% Other Indo-European 1%
Political lean MEDSL · Lee
- 2024 margin
- Strong R (+28.4) · D 35.5% · R 63.9%
- 2008→2024 swing
- -18.0pp toward R · 2008: -10.4pp · 2024: -28.4pp
- All cycles
- 2024: R+28.4 2020: R+19.2 2016: R+20.4 2012: R+16.6 2008: R+10.4
Not yet ingested
- Civics
- —
Market trends
- HPI YoY
- ▲ 16.53%
- Current HPI
- 303.3399
- Rent YoY
- ▼ -4.68%
- Metro
- Cape Coral-Fort Myers, FL
- State GDP YoY
- ▲ 3.28%
- F500 in state
- 36
Industry mix (Fortune 500 HQ in FL)
| Industry | F500 HQs | Revenue |
|---|---|---|
| Industrial Technology | 2 | $29B |
|
||
| Insurance | 2 | $17B |
|
||
| Retail | 1 | $60B |
|
||
| Technology Distribution | 1 | $58B |
|
||
| Homebuilding | 1 | $35B |
|
||
| Technology Manufacturing | 1 | $35B |
|
||
Price history
+2233.3% since first listed11 events — show timeline
- 2026-04-28 Price Changed $280,000 FORTMLS
- 2026-03-24 Price Changed $287,700 FORTMLS
- 2026-02-20 Price Changed $295,000 FORTMLS
- 2025-12-07 Price Changed $309,900 FORTMLS
- 2025-11-04 Price Changed $329,900 FORTMLS
- 2025-10-23 Listed $340,000 FORTMLS
- 2024-05-24 Sold (Public Records) $18,000 Public Records
- 2024-05-09 Sold (MLS) $18,000 FORTMLS
- 2024-04-12 Pending — FORTMLS
- 2024-02-09 Listed $25,000 FORTMLS
- 2004-01-30 Sold (Public Records) $12,000 Public Records
Property tax history
+18.1%/yrLatest (2025): $442 · +28.9% YoY. Source: county tax records.
Cash-flow waterfall
monthlySold comps — $/sqft
last 12 mo · ≤1 miLoading sold comps…