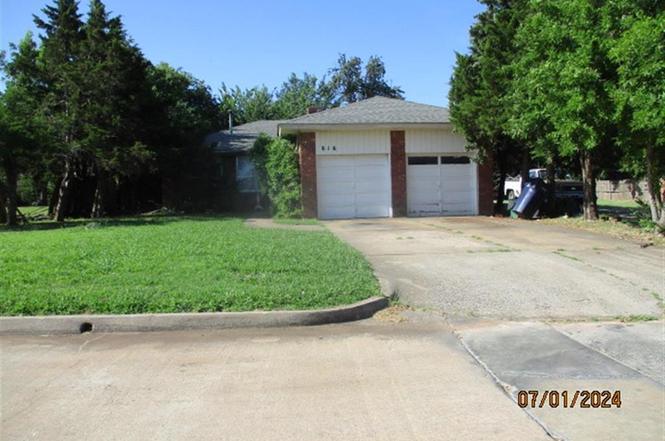
816 NE 25th St · Oklahoma City, OK
Flood risk 1/10 · Minimal
- FEMA flood zone
- X (unshaded)
- Chance of flooding over 30 yrs
- 0.0%
- Est. flood insurance / yr
- $507 – $1,088
Fire risk 1/10 · Minimal
- Est. fire insurance / yr
- $2,463 – $4,575
Heat risk 6/10 · Moderate
- Hot days now (above 107°F)
- 7 days/yr
- Hot days in 30 yrs
- 19 days/yr
Wind risk 2/10 · Minimal
- Chance of severe wind over 30 yrs
- 3.0%
Air-quality risk 2/10 · Minimal
- Unhealthy air days now
- 1 days/yr
- Unhealthy air days in 30 yrs
- 2 days/yr
Risk factors via First Street. Map © Google.
Why this score? — see what drove the C+ grade
The composite is a weighted blend of 9 inputs, each scored 0–100. Each bar is that input's sub-score; the figure is the points it added to the 100-point composite (weight × sub-score).
- Cash flow +25.1/30.0
- ARV discount +15.0/15.0
- DSCR +8.2/10.0
- 1% rule +6.1/10.0
- Livability +4.0/5.0
- Rent growth +3.1/5.0
- Condition / age +2.5/5.0
- Schools +0.7/10.0
- Appreciation +0.0/10.0
$100,000
🖨 Deal sheet (PDF) 📄 Offer letter ✓ Due diligence
Listing remarks MLS
A LITTLE TLC COULD MAKE THIS AN EXCELLENT HOME FOR A SMALL FAMILY, OR INVESTMENT FOR THE FUTURE. EASY TO SHOW. HARDWOOD FLOORS, CERAMIC TILE FLOORING IN THE KITCHEN. NICE NEIGHBORHOOD NEAR THE CAPITOL. CHECK IT OUT.
Key facts
- 7,945 sq ft lot
- Garage
- Built 1963
Property features AI
Finance
- Other: Homestead not claimed; Located in Neffs Capitol Add
- Financial info: Court approval required for sale; Loan qualification not indicated
- HOA & community: No mandatory association dues
Exterior
- Parking: 1-car garage
- Home design: Single family residence; One level; Residential property; Existing construction
- Construction: Frame and masonry veneer construction; Composition roof; Conventional foundation
- Exterior features: Interior lot
Interior
- Bedrooms: 2 bedrooms
- Bathrooms: 1 full bathroom
- Heating & cooling: Floor furnace heating; Window unit(s) for cooling
- Interior features: One living area; No fireplace
Neighborhood map
What this means for you Summary
Snapshot
- This is a 2-bed/1.0-bath single-family listed at $100k.
Deal economics
- At list price, monthly cash flow is $222 ($3k/yr) — positive.
- The deal already cash-flows at list — no discount required.
- Meets the 1% rule at list price ($1k rent vs $100k).
- Recommended offer: $88k (12.0% below list) — sets the bar for market timing.
- Cap rate 9.0% vs local median 3.7% in Oklahoma City — top-decile yield for the area; either an underpriced asset or a hidden risk that comps aren't pricing in. Stress-test before assuming the spread holds.
Location & tenants
- Location reads 80/100 on livability (#3 in OK, #1,635 nationally) — a professional / high-income tenant draw. Strengths: amenities A+, commute A+, cost of living A+; Watch: crime F.
- Oklahoma City (urban): math 7% / reading 10% proficiency, ranked #254 of 270 in OK (top 94%) — low school quality limits family demand, transient renter base, plan for 1-2y turnover; 82% free/reduced lunch — lower-income household profile, screen leases tightly.
- Zoned schools: M.L. King Jr. Es (math 12% / reading 8%, grade F, #711 of 845 statewide, top 87%, 450 students, 0% FRL); Classen Ms of Advanced Studies (math 35% / reading 46%, grade F, #6 of 345 statewide, top 1%, 855 students, 0% FRL); Douglass Hs (math 2% / reading 2%, grade F, #445 of 447 statewide, top 100%, 556 students, 0% FRL) — zoned schools average 0% FRL vs 82% district-wide (82 pts lower); this property's tenant base skews higher-income than the district average.
- Market conditions: Rents rising (+2.2%/yr); 45 active listings in the ZIP; 40 comparable units currently listed for rent nearby; rentals lingering (median 46d on market — plan ~5-8 weeks vacancy on turnover, expect pricing pressure); 52% of comp listings sitting > 30 days — soft ceiling on asking rent; 5,365 units permitted in Oklahoma County in 2024 (569 in 5+ unit buildings).
Forward outlook
- Local home prices are declining (-3.0%/yr); year-one equity from $691 of loan paydown is wiped out by about $3k of value loss. Plan a longer hold.
- Oklahoma County population projected at +41% by 2050 — long-run rental-demand tailwind backs the buy-and-hold thesis.
Negotiation context
- It's been on market 167 days — a 12% lower offer ($88k) is reasonable based on typical stale-listing flexibility.
- 2 sale attempts since 20y ago; this cycle's ask has dropped $75k (43%) from the opening price — seller is motivated, your offer sets the floor, not the list.
- Current owner paid $42k; list at $100k implies a 135% gain — meaningful room to come down on a strong offer.
Risks & watch-outs
- Climate carrying-cost: extreme-heat days projected 7→19/yr by 2055 (HVAC capex compounding) — expect insurance premiums to compound above CPI over the hold.
Questions for the listing agent
- It's been on market 167 days. Have you received any prior offers? Is the seller open to a 12% concession, seller financing, or rate buy-down credit?
- Built in 1963 — when were the roof, HVAC, electrical panel, plumbing, and water heater last replaced?
- Why hasn't it sold? Are there any deal-killer items the seller is aware of (foundation, flood, title, zoning, code violations)?
- Is there a deadline driving the sale (1031 exchange, divorce, estate, relocation)? That informs how much negotiation room exists.
- Schools are F-rated, which usually means shorter tenancies and higher turnover. Who's the typical renter profile here, and what's been the actual vacancy rate?
- Crime grade is F in this area — have there been break-ins, vandalism, or insurance claims at this property in the last 3 years? What carrier currently insures it and at what premium?
- What's the average days-on-market for RENTAL listings here right now (not sales)? A rising rental-DOM trend means longer vacancies and softer asking-rent achievability than the comps imply.
- What's the recent tenant-quality profile in this submarket — average credit score on applications, eviction rate, late-payment / NSF rate, and stable-employment percentage? A property-management company in the area should have these aggregated.
- How much new for-sale + rental construction is in the pipeline within 1–3 miles? Heavy new supply typically softens prices + rents 12–24 months out; constrained supply supports both.
Investment metrics
- 1% rule
- 1.11% ✓
- Cap rate
- 8.95%
- Cash-on-cash
- 9.50%
- DSCR
- 1.42
- GRM
- 7.5
CMA / ARV
- ARV (on-the-fly)
- $127,566
- Comps found
- 12
Show comp detail 12 sales within ~0.75 mi
| Address | Dist | Beds/Ba | Sqft | Sold | Price | $/sf | Match |
|---|---|---|---|---|---|---|---|
| 2139 N Stonewall Ave | 0.42mi | 2/1.0 | 1,134 (+1%) | 7mo | $205,000 | $181 | 72 |
| 913 NE 28th St | 0.24mi | 3/1.0 (+1) | 1,182 (+6%) | 8mo | $155,000 | $131 | 68 |
| 801 NE 32nd St | 0.48mi | 3/1.0 (+1) | 1,102 (-2%) | 4mo | $80,000 | $73 | 67 |
| 712 NE 29th St | 0.29mi | 2/2.0 | 1,006 (-10%) | 3mo | $180,000 | $179 | 63 |
| 2221 N Lottie Ave | 0.52mi | 2/1.0 | 1,024 (-8%) | 2mo | $45,000 | $44 | 60 |
| 301 NE 26th St | 0.50mi | 2/1.0 | 1,189 (+6%) | 8mo | $135,000 | $114 | 59 |
| 825 NE 30th St | 0.35mi | 3/1.0 (+1) | 1,002 (-10%) | 4mo | $108,000 | $108 | 58 |
| 733 NE 34th Ter | 0.63mi | 3/1.0 (+1) | 1,202 (+7%) | 1mo | $78,000 | $65 | 53 |
| 3600 Springlake Dr | 0.72mi | 3/1.5 (+1) | 1,090 (-3%) | 3mo | $83,000 | $76 | 52 |
| 2719 N Walnut St | 0.58mi | 2/2.0 | 980 (-12%) | 6mo | $175,000 | $179 | 43 |
| 846 Marilyn St | 0.71mi | 3/1.0 (+1) | 1,000 (-11%) | 5mo | $68,000 | $68 | 40 |
| 1435 NE 27th St | 0.69mi | 3/2.0 (+1) | 1,275 (+14%) | 6mo | $210,000 | $165 | 31 |
Match score weights: distance 35% · size 25% · config 20% · recency 20%. Top-matched comps best support the ARV.
Projected returns pro-forma
-3.0% appreciation · 2.21% rent growth · sell at horizon
- IRR
- -2.8%
- Equity multiple
- 0.89×
- Total profit
- $-2,962
- Equity at exit
- $14,910
- IRR
- 6.0%
- Equity multiple
- 1.43×
- Total profit
- $12,050
- Equity at exit
- $8,646
Cash invested: $28,000 (down + closing). Projections, not guarantees.
Landlord ↔ Tenant lean methodology
- Overall (STATE)
- 83 Strongly Landlord-Friendly
- State Oklahoma
- 83 Strongly Landlord-Friendly · R+20
- County
- — inherits STATE
- City
- — inherits STATE
ZIP-level market 73105
- Home prices YoY
- -11.3%
- Rents YoY
- 2.2%
- Active inventory
- 45
- Price-to-rent
- 7.5×
Monthly cashflow live
- Estimated rent
- $1,108 high interval (Pro) →
- Mortgage (P&I)
- −$524
- Tax from tax record
- −$88 /mo · $1,052/yr
- Insurance
- −$42
- HOA
- −$0
- Vacancy / Maint / Mgmt
- −$233
- Net cashflow
- $222
Break-even live
Sensitivity live
| Price | -10% $278 | -5% $250 | +0% $222 | +5% $193 | +10% $165 |
|---|---|---|---|---|---|
| Rent | -10% $134 | -5% $178 | +0% $222 | +5% $266 | +10% $309 |
| Rate | -1.0pp $272 | -0.5pp $247 | base $222 | +0.5pp $196 | +1.0pp $169 |
UW: 25.0% down · 7.5% · 30yr · 1.5% tax · 5.0% vac · 8.0% maint · 8.0% mgmt
Financing live
Cash to close
- Down payment
- $25,000
- Closing costs
- $3,000
- Reserves months
- —
- Total cash needed
- —
Loan-product check · same deal, 3 products live
Conventional
25% down · 7.5% · 30yr
- Down + closing
- —
- Monthly P&I
- —
- Monthly cashflow
- —
- DSCR
- —
- Eligible?
- —
Personal DTI + credit; lowest rate.
DSCR
20% down · 8.5% · 30yr
- Down + closing
- —
- Monthly P&I
- —
- Monthly cashflow
- —
- DSCR
- —
- Eligible?
- —
No personal income docs; deal must DSCR.
Hard money
10% down · 12.0% · 12mo
- Down + closing
- —
- Monthly P&I
- —
- Monthly cashflow
- —
- DSCR
- —
- Eligible?
- —
Short-term bridge; refi at stabilization.
Rent comps 40 comps
| Address | Beds | Baths | Sqft | Rent | $/sqft | DOM | Units | Dist |
|---|---|---|---|---|---|---|---|---|
| 736 NE 26th St Oklahoma City, OK | 2.0 | 1.0 | 927 | $1,050 | $1.13 | 4d | 1 | 0.09mi |
| 714 NE 27th St Unit 4 Oklahoma City, OK | 2.0 | 1.0 | 950 | $845 | $0.89 | 25d | 1 | 0.17mi |
| 704 NE 31st St Oklahoma City, OK | 3.0 | 1.0 | 952 | $1,300 | $1.37 | 45d | 1 | 0.39mi |
| 2225 Glen Ellyn St Oklahoma City, OK | 2.0 | 1.0 | 1095 | $925 | $0.84 | 45d | 1 | 0.43mi |
| 2148 N Stonewall Ave Oklahoma City, OK | 2.0 | 1.0 | 1055 | $875 | $0.83 | 6d | 1 | 0.44mi |
| 2128 N Stonewall Ave Unit 1 Oklahoma City, OK | 2.0 | 1.0 | 960 | $800 | $0.83 | 5d | 1 | 0.48mi |
| 2312 N Everest Ave Oklahoma City, OK | 3.0 | 1.0 | 1100 | $1,299 | $1.18 | 45d | 1 | 0.49mi |
| 215 NE 28th St Oklahoma City, OK | 2.0 | 1.0–2.0 | 694 | $1,289 | $1.86 | 4d | 10 | 0.56mi |
| 2709 N Fonshill Ave Oklahoma City, OK | 2.0 | 1.0 | 949 | $1,100 | $1.16 | 25d | 1 | 0.62mi |
| 1427 NE 28th St Oklahoma City, OK | 1.0 | 1.0 | 876 | $695 | $0.79 | 45d | 1 | 0.65mi |
| 701 Culbertson Dr Oklahoma City, OK | 1.0 | 1.0 | 700 | $825 | $1.18 | 4d | 1 | 0.65mi |
| 1401 NE 22nd St Oklahoma City, OK | 2.0 | 1.0 | 728 | $1,100 | $1.51 | 25d | 1 | 0.66mi |
| 2908 N Fonshill Ave Oklahoma City, OK | 3.0 | 2.0 | 1325 | $1,225 | $0.92 | 45d | 1 | 0.67mi |
| 943 East Dr Oklahoma City, OK | 1.0 | 1.0 | 900 | $995 | $1.11 | 6d | 1 | 0.67mi |
| 800 East Dr Unit 1 Oklahoma City, OK | 1.0 | 1.0 | 752 | $900 | $1.20 | 5d | 1 | 0.67mi |
| 939 East Dr Oklahoma City, OK | 2.0 | 1.0 | 1039 | $1,100 | $1.06 | 25d | 1 | 0.67mi |
| 1438 NE 27th St Oklahoma City, OK | 3.0 | 1.0 | 736 | $1,000 | $1.36 | 45d | 1 | 0.68mi |
| 846 Marilyn St Oklahoma City, OK | 3.0 | 1.0 | 1000 | $1,049 | $1.05 | 45d | 1 | 0.69mi |
| 1439 NE 24th St Oklahoma City, OK | 3.0 | 1.0 | 874 | $1,025 | $1.17 | 18d | 1 | 0.71mi |
| 935 NE 16th St Oklahoma City, OK | 1.0 | 1.0 | 727 | $795 | $1.09 | 45d | 1 | 0.73mi |
| 1200 NE 17th St Unit B Oklahoma City, OK | 2.0 | 1.0 | 1002 | $2,100 | $2.10 | 45d | 1 | 0.75mi |
| 1220 NE 17th St Oklahoma City, OK | 2.0 | 1.0 | 1100 | $1,195 | $1.09 | 45d | 1 | 0.77mi |
| 735 NE 14th St Oklahoma City, OK | 2.0 | 1.0 | 1216 | $1,299 | $1.07 | 6d | 1 | 0.84mi |
| 737 NE 14th St Oklahoma City, OK | 2.0 | 2.0 | 1216 | $1,299 | $1.07 | 45d | 1 | 0.84mi |
| 119 NW 27th St Oklahoma City, OK | 1.0 | 1.0 | 750 | $995 | $1.33 | 13d | 1 | 0.95mi |
| 119 NW 27th St Oklahoma City, OK | 1.0 | 1.0 | 750 | $995 | $1.33 | 45d | 1 | 0.95mi |
| 1812 NE 24th St Oklahoma City, OK | 3.0 | 1.0 | 1071 | $1,175 | $1.10 | 4d | 1 | 0.99mi |
| 1637 Bishop Bobby L Williams Dr Oklahoma City, OK | 2.0 | 1.0 | 820 | $1,150 | $1.40 | 45d | 1 | 0.99mi |
| 2420 N Robinson Ave Unit 1/2 Oklahoma City, OK | 1.0 | 2.0 | 900 | $975 | $1.08 | 45d | 1 | 1.00mi |
| 1450 NE 16th Ter Oklahoma City, OK | 3.0 | 1.0 | 1096 | $1,295 | $1.18 | 45d | 1 | 1.01mi |
| 3004 N Robinson Ave Oklahoma City, OK | 2.0 | 1.0 | 1166 | $1,500 | $1.29 | 45d | 1 | 1.02mi |
| 1609 NE 18th St Oklahoma City, OK | 2.0 | 1.0 | 899 | $900 | $1.00 | 6d | 1 | 1.02mi |
| 127 NW 30th St Oklahoma City, OK | 2.0 | 1.5 | 1200 | $995 | $0.83 | 6d | 1 | 1.02mi |
| 2813 N Robinson Ave Oklahoma City, OK | 2.0 | 1.0 | 1400 | $1,025 | $0.73 | 45d | 1 | 1.02mi |
| 2409 N Robinson Ave Unit D Oklahoma City, OK | 1.0 | 1.0 | 700 | $1,750 | $2.50 | 45d | 1 | 1.03mi |
| 1722 NE 20th St Oklahoma City, OK | 2.0 | 1.0 | 800 | $1,070 | $1.34 | 45d | 1 | 1.04mi |
| 1621 NE 33rd St Oklahoma City, OK | 3.0 | 2.0 | 1500 | $1,975 | $1.32 | 45d | 1 | 1.04mi |
| 1801 N Jordan Ave Oklahoma City, OK | 2.0 | 1.0 | 1080 | $1,000 | $0.93 | 16d | 1 | 1.05mi |
| 1727 NE 19th St Oklahoma City, OK | 3.0 | 1.0 | 892 | $995 | $1.12 | 45d | 1 | 1.08mi |
| 3400 N Robinson Ave #5 Oklahoma City, OK | 1.0 | 1.0 | 860 | $825 | $0.96 | 6d | 1 | 1.09mi |
Listing history 14 events
-
2026-06-13statusdays on market $100,000 Pending 167 DOM
-
2026-06-09days on market $100,000 Active 165 DOM
-
2026-06-08days on market $100,000 Active 164 DOM
-
2026-06-07days on market $100,000 Active 163 DOM
-
2026-06-05days on market $100,000 Active 160 DOM
-
2026-06-03days on market $100,000 Active 159 DOM
-
2026-06-02status $100,000 Active 158 DOM
-
2026-05-01status Pending
-
2026-04-04price $100,000
-
2026-02-25price $150,000
-
2025-11-21$175,000 Active
-
2007-01-09soldstatus $42,500 217-char remark
Show marketing remark (217 chars)
A LITTLE TLC COULD MAKE THIS AN EXCELLENT HOME FOR A SMALL FAMILY, OR INVESTMENT FOR THE FUTURE. EASY TO SHOW. HARDWOOD FLOORS, CERAMIC TILE FLOORING IN THE KITCHEN. NICE NEIGHBORHOOD NEAR THE CAPITOL. CHECK IT OUT.
-
2007-01-03soldstatus $35,833
-
2006-10-22$48,500 217-char remark
Show marketing remark (217 chars)
A LITTLE TLC COULD MAKE THIS AN EXCELLENT HOME FOR A SMALL FAMILY, OR INVESTMENT FOR THE FUTURE. EASY TO SHOW. HARDWOOD FLOORS, CERAMIC TILE FLOORING IN THE KITCHEN. NICE NEIGHBORHOOD NEAR THE CAPITOL. CHECK IT OUT.
ⓘ Source: listings_history table (triggers on properties + properties_extension) + one-shot
backfill from property_details.listing_events for pre-trigger history.
Tax reassessment forecast OK · Resets to sale price
- Current annual tax
- $1,052 · $88/mo
- Projected year-2 tax
- $1,052 · $88/mo
- Expected delta
- $0/yr ($0/mo · 0.0%)
ⓘ Screening estimate from a state-policy table — verify with the county assessor before closing.
Climate risk First Street
- Flood 1/10 Low FEMA zone X (unshaded) · 0% chance over 30 yrs
- Wildfire 1/10 Low
- Heat 6/10 Major 7 d/yr ≥107°F today · 19 d/yr by 30 yrs out
- Wind 2/10 Low 3% chance of damaging wind over 30 yrs
- Air quality 2/10 Low 1 unhealthy d/yr today · 2 by 30 yrs out
Nearby sold comps map
Loading sold comps map…
Walkable amenities ~0.75 mi
Loading nearby amenities…
Taxation est. · year 1
- Rental income
- $13,299
- − Mortgage interest
- −$5,602
- − Property taxes
- −$1,052
- − Insurance
- −$500
- − Repairs & maintenance
- −$1,064
- − Management
- −$1,064
- − Depreciation
- −$2,909
- Taxable income
- $1,108
- Est. tax owed @ 24.0%
- −$266
- After-tax cash flow
- $2,395/yr
For passive investors: Depreciation is non-cash, so a rental often shows a tax loss while cash-flowing — sheltering income. Rental losses are passive: they offset passive income freely, and up to $25,000/yr can offset ordinary (W-2) income if you actively participate and your MAGI is under $100k (phasing out to $0 by $150k); unused losses carry forward. On sale, claimed depreciation is recaptured at up to 25%, and gains may owe capital-gains tax (a 1031 exchange can defer both). Figures are a year-1 estimate at your 24.0% rate — not tax advice; consult a CPA.
Schools (NCES district)
- District
- Oklahoma City
- NCES district ID
- 4022770
- Math proficiency
- 7% ▼ -5.00%
- Reading proficiency
- 10% ▼ -6.00%
- Median HH income
- $35,606
- Composite
- 7.0/100
- National rank
- #9970
- State rank
- #254 of 270 in OK
Livability — Oklahoma City
- Score
- 80/100
- State rank
- #3
- US rank
- #1635
Category grades
Schools grade is shown separately in the Schools card above.
Census & demographics
- Census place
- Oklahoma City, OK
- County
- Oklahoma County · 771,644 people
- City population
- 498,656
- Metro
- Oklahoma City, OK
- Population (ZIP)
- 5,900
- Household income
- $50,102
- Rent vs Own
- Severe rent burden
- 557.0
Population outlook (Oklahoma County) Hauer SSP2
- Today (2025)
- 911,875 people
- By 2030
- 982,413 · +7.7%
- By 2040
- 1,130,468 · +24.0%
- By 2050
- 1,288,422 · +41.3%
- By 2075
- 1,711,482 · +87.7%
- By 2100
- 2,088,448 · +129.0%
Race, ethnicity, and origin ACS 2023
- Neighborhood character
- Diverse neighborhood (Simpson 0.64)
- Race & ethnicity
- Black 50% White 33% Two or more races 6% Asian 6% Hispanic / Latino 5%
- Common ancestry
- Swedish 3% Italian 2% Romanian 1%
- Foreign-born
- 8% · Canada
- Languages at home
- 87% English-only · Other Indo-European 3% Spanish 2% Other Asian/Pacific 1%
Political lean MEDSL · Oklahoma
- 2024 margin
- Toss-up / Even · D 48.0% · R 49.7% · Other 2.3%
- 2008→2024 swing
- +15.1pp toward D · 2008: -16.8pp · 2024: -1.7pp
- All cycles
- 2024: R+1.7 2020: R+1.1 2016: R+10.5 2012: R+16.7 2008: R+16.8
Not yet ingested
- Civics
- —
Market trends
- HPI YoY
- ▼ -39.42%
- Current HPI
- 309.7587
- Rent YoY
- ▲ 2.21%
- Metro
- Oklahoma City, OK
- State GDP YoY
- ▲ 1.55%
- F500 in state
- 6
Industry mix (Fortune 500 HQ in OK)
| Industry | F500 HQs | Revenue |
|---|---|---|
| Energy | 3 | $48B |
|
||
Price history
+106.2% since first listed7 events — show timeline
- 2026-05-01 Pending — MLSOK
- 2026-04-04 Price Changed $100,000 MLSOK
- 2026-02-25 Price Changed $150,000 MLSOK
- 2025-11-21 Listed $175,000 MLSOK
- 2007-01-09 Sold (MLS) $42,500 MLSOK
- 2007-01-03 Sold (Public Records) $35,833 Public Records
- 2006-10-22 Listed $48,500 MLSOK
Property tax history
+3.4%/yrLatest (2025): $1,052 · +4.2% YoY. Source: county tax records.
Cash-flow waterfall
monthlySold comps — $/sqft
last 12 mo · ≤1 miLoading sold comps…