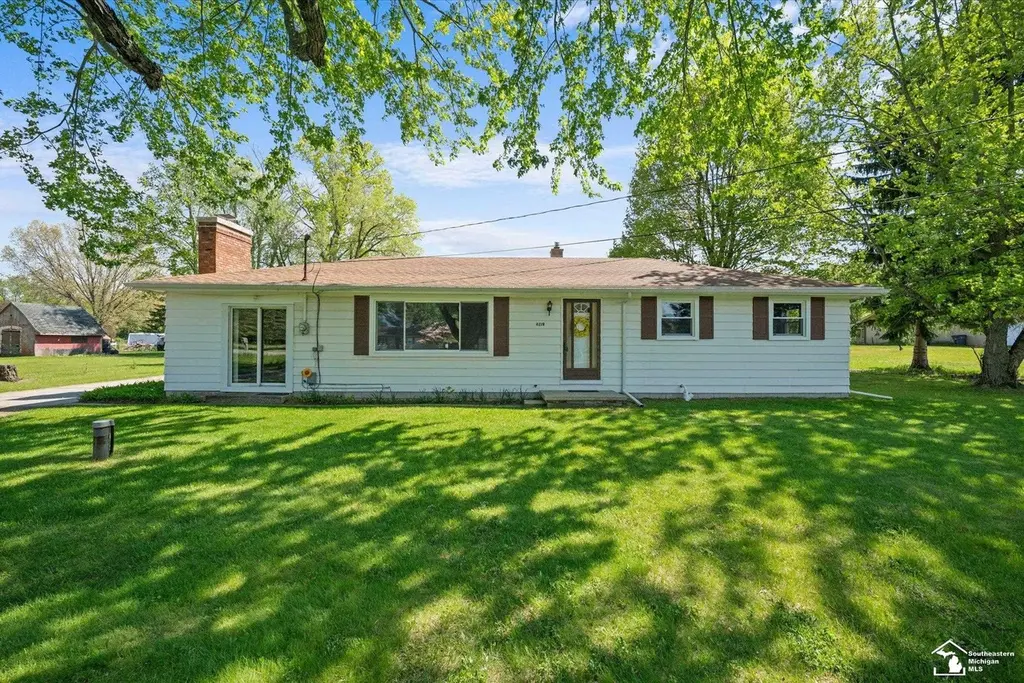
4219 Samaria Rd · Lambertville, MI
Flood risk 1/10 · Minimal
- FEMA flood zone
- X (unshaded)
- Chance of flooding over 30 yrs
- 0.0%
- Est. flood insurance / yr
- $507 – $1,088
Fire risk 2/10 · Minimal
- Est. fire insurance / yr
- $784 – $1,456
Heat risk 3/10 · Minor
- Hot days now (above 100°F)
- 7 days/yr
- Hot days in 30 yrs
- 16 days/yr
Wind risk 2/10 · Minimal
- Chance of severe wind over 30 yrs
- —
Air-quality risk 2/10 · Minimal
- Unhealthy air days now
- 1 days/yr
- Unhealthy air days in 30 yrs
- 3 days/yr
Risk factors via First Street. Map © Google.
Why this score? — see what drove the D+ grade
The composite is a weighted blend of 9 inputs, each scored 0–100. Each bar is that input's sub-score; the figure is the points it added to the 100-point composite (weight × sub-score).
- Cash flow +15.1/30.0
- ARV discount +14.4/15.0
- DSCR +4.6/10.0
- Livability +4.0/5.0
- Schools +3.8/10.0
- 1% rule +2.9/10.0
- Rent growth +2.5/5.0
- Condition / age +2.5/5.0
- Appreciation +0.0/10.0
$240,000
🖨 Deal sheet (PDF) 📄 Offer letter ✓ Due diligence
Listing remarks MLS
Move in Ready Bedford Twp Ranch Updates including- Kitchen 2026, Windows 2026, Bath 2026, HW Tank 2022, CA and Furnace 2016, Roof 2011, Fresh Paint and Carpet in addition to beautiful hardwood floors with 2 car detached garage on a beautiful half acre lot with mature trees. Family room with wood burning fireplace and blower. The best of both worlds with a rural setting yet minutes from US-23, shopping and dining. Appliances Stay!
Key facts
- 0.5 acre lot
- 2 garage spots
- Built 1962
Property features AI
Finance
- Other: Property listed as residential single family
- HOA & community: Homeowners association present
Exterior
- Parking: Detached 2-car garage
- Utilities: Private well water; Septic tank
- Home design: Single-family residence; One level
- Construction: Aluminum siding
- Exterior features: Lot approximately 0.5 acre (100 x 224)
Interior
- Kitchen: Oven; Range; Refrigerator
- Bedrooms: Total of 6 rooms (bedrooms included in room count)
- Bathrooms: 1 full bathroom; 1 half bathroom
- Heating & cooling: Forced air heating (natural gas); Central air conditioning
- Interior features: Wood-burning fireplace in the family room; Crawl space basement
- Laundry & utility: Gas water heater
Neighborhood map
What this means for you Summary
Snapshot
- This is a 3-bed/1.5-bath single-family listed at $240k.
Deal economics
- At list price, monthly cash flow is $77 ($923/yr) — positive.
- The deal already cash-flows at list — no discount required.
- To meet the 1% rule (rent ≥ 1% of price), the offer needs to be $189k (21.1% below list).
- Recommended offer: $189k (21.1% below list) — sets the bar for 1% rule.
- Cap rate 6.7% vs local median 5.1% in Lambertville — top-decile yield for the area; either an underpriced asset or a hidden risk that comps aren't pricing in. Stress-test before assuming the spread holds.
Location & tenants
- Location reads 80/100 on livability (#78 in MI, #1,689 nationally) — a professional / high-income tenant draw. Strengths: employment A+, cost of living A+, housing A+; Watch: amenities F, commute F.
- Bedford Public Schools (suburban): math 33% / reading 53% proficiency, ranked #150 of 540 in MI (top 28%) — families likely to look elsewhere, expect single-tenant / working-renter base with shorter leases; only 18% free/reduced lunch — higher-income household profile.
- Market conditions: 79 active listings in the ZIP; solid renter incomes; 264 units permitted in Monroe County in 2024 (40 in 5+ unit buildings).
Forward outlook
- Local home prices are declining (-3.0%/yr); year-one equity from $2k of loan paydown is wiped out by about $7k of value loss. Plan a longer hold.
- Monroe County population projected at -20% by 2050 — secular population decline; favor cash flow + early exit over multi-decade hold.
Negotiation context
- Only 3 days on market — expect competitive offers; lowballing is unlikely to land.
- 2 sale attempts with the ask held roughly flat each time — persistent listings suggest the price (not the market) is what's stuck; bring a comps-based counter.
Questions for the listing agent
- Built in 1962 — when were the roof, HVAC, electrical panel, plumbing, and water heater last replaced?
- Is there a deadline driving the sale (1031 exchange, divorce, estate, relocation)? That informs how much negotiation room exists.
- The area grade is low — what's the realistic commute time and amenity access for the typical tenant pool here? Any planned neighborhood developments (good or bad) we should know about?
- What's the average days-on-market for RENTAL listings here right now (not sales)? A rising rental-DOM trend means longer vacancies and softer asking-rent achievability than the comps imply.
- What's the recent tenant-quality profile in this submarket — average credit score on applications, eviction rate, late-payment / NSF rate, and stable-employment percentage? A property-management company in the area should have these aggregated.
- How much new for-sale + rental construction is in the pipeline within 1–3 miles? Heavy new supply typically softens prices + rents 12–24 months out; constrained supply supports both.
Investment metrics
- 1% rule
- 0.79% ✗
- Cap rate
- 6.68%
- Cash-on-cash
- 1.37%
- DSCR
- 1.06
- GRM
- 10.6
CMA / ARV
- ARV (median comp)
- $283,391
- List price
- $240,000
- Delta
- -15.31%
- Verdict
- UNDERPRICED
- Comps
- 20 within 1.0 mi
Show comp detail 9 sales within ~0.75 mi
| Address | Dist | Beds/Ba | Sqft | Sold | Price | $/sf | Match |
|---|---|---|---|---|---|---|---|
| 10200 Summerfield Rd | 0.43mi | 3/2.0 | 1,522 (-1%) | 1mo | $296,000 | $194 | 76 |
| 4230 Saint Anthony Rd | 0.43mi | 3/2.0 | 1,695 (+10%) | 1mo | $310,000 | $183 | 60 |
| 4210 St. Anthony Rd | 0.43mi | 2/1.0 (-1) | 1,484 (-4%) | 8mo | $290,000 | $195 | 60 |
| 4131 W Samaria Rd | 0.18mi | 2/1.0 (-1) | 1,456 (-5%) | 19mo | $268,000 | $184 | 60 |
| 10223 Summerfield Rd | 0.42mi | 3/2.5 | 1,420 (-8%) | 7mo | $243,000 | $171 | 58 |
| 10757 Summerfield Rd | 0.43mi | 3/1.0 | 1,348 (-12%) | 0mo | $315,000 | $234 | 57 |
| 4617 Saint Anthony St | 0.61mi | 3/2.0 | 1,450 (-6%) | 5mo | $234,900 | $162 | 56 |
| 4870 W Samaria Rd | 0.75mi | 2/1.5 (-1) | 1,613 (+5%) | 5mo | $285,000 | $177 | 48 |
| 10993 Summerfield Rd | 0.68mi | 2/1.5 (-1) | 1,452 (-6%) | 11mo | $265,000 | $183 | 44 |
Match score weights: distance 35% · size 25% · config 20% · recency 20%. Top-matched comps best support the ARV.
Projected returns pro-forma
-3.0% appreciation · 3.0% rent growth · sell at horizon
- IRR
- -14.2%
- Equity multiple
- 0.49×
- Total profit
- $-34,108
- Equity at exit
- $35,785
- IRR
- -5.5%
- Equity multiple
- 0.64×
- Total profit
- $-23,873
- Equity at exit
- $20,751
Cash invested: $67,200 (down + closing). Projections, not guarantees.
Landlord ↔ Tenant lean methodology
- Overall (STATE)
- 62 Landlord-Friendly
- State Michigan
- 62 Landlord-Friendly · EVEN
- County
- — inherits STATE
- City
- — inherits STATE
ZIP-level market 48182
- Active inventory
- 79
- Price-to-rent
- 10.6×
Monthly cashflow live
- Estimated rent
- $1,893 medium interval (Pro) →
- Mortgage (P&I)
- −$1,259
- Tax from tax record
- −$60 /mo · $716/yr
- Insurance
- −$100
- HOA
- −$0
- Vacancy / Maint / Mgmt
- −$397
- Net cashflow
- $77
Break-even live
Sensitivity live
| Price | -10% $213 | -5% $145 | +0% $77 | +5% $9 | +10% $-59 |
|---|---|---|---|---|---|
| Rent | -10% $-73 | -5% $2 | +0% $77 | +5% $152 | +10% $226 |
| Rate | -1.0pp $198 | -0.5pp $138 | base $77 | +0.5pp $15 | +1.0pp $-49 |
UW: 25.0% down · 7.5% · 30yr · 1.5% tax · 5.0% vac · 8.0% maint · 8.0% mgmt
Financing live
Cash to close
- Down payment
- $60,000
- Closing costs
- $7,200
- Reserves months
- —
- Total cash needed
- —
Loan-product check · same deal, 3 products live
Conventional
25% down · 7.5% · 30yr
- Down + closing
- —
- Monthly P&I
- —
- Monthly cashflow
- —
- DSCR
- —
- Eligible?
- —
Personal DTI + credit; lowest rate.
DSCR
20% down · 8.5% · 30yr
- Down + closing
- —
- Monthly P&I
- —
- Monthly cashflow
- —
- DSCR
- —
- Eligible?
- —
No personal income docs; deal must DSCR.
Hard money
10% down · 12.0% · 12mo
- Down + closing
- —
- Monthly P&I
- —
- Monthly cashflow
- —
- DSCR
- —
- Eligible?
- —
Short-term bridge; refi at stabilization.
Listing history 5 events
-
2026-05-19status Pending 433-char remark
Show marketing remark (433 chars)
Move in Ready Bedford Twp Ranch Updates including- Kitchen 2026, Windows 2026, Bath 2026, HW Tank 2022, CA and Furnace 2016, Roof 2011, Fresh Paint and Carpet in addition to beautiful hardwood floors with 2 car detached garage on a beautiful half acre lot with mature trees. Family room with wood burning fireplace and blower. The best of both worlds with a rural setting yet minutes from US-23, shopping and dining. Appliances Stay!
-
2026-05-15$240,000 Active 433-char remark
Show marketing remark (433 chars)
Move in Ready Bedford Twp Ranch Updates including- Kitchen 2026, Windows 2026, Bath 2026, HW Tank 2022, CA and Furnace 2016, Roof 2011, Fresh Paint and Carpet in addition to beautiful hardwood floors with 2 car detached garage on a beautiful half acre lot with mature trees. Family room with wood burning fireplace and blower. The best of both worlds with a rural setting yet minutes from US-23, shopping and dining. Appliances Stay!
-
2026-05-12historical $240,000 433-char remark
Show marketing remark (433 chars)
Move in Ready Bedford Twp Ranch Updates including- Kitchen 2026, Windows 2026, Bath 2026, HW Tank 2022, CA and Furnace 2016, Roof 2011, Fresh Paint and Carpet in addition to beautiful hardwood floors with 2 car detached garage on a beautiful half acre lot with mature trees. Family room with wood burning fireplace and blower. The best of both worlds with a rural setting yet minutes from US-23, shopping and dining. Appliances Stay!
ⓘ Source: listings_history table (triggers on properties + properties_extension) + one-shot
backfill from property_details.listing_events for pre-trigger history.
Tax reassessment forecast MI · Partial reset (capped growth)
- Current annual tax
- $716 · $60/mo
- Projected year-2 tax
- $2,206 · $184/mo
- Expected delta
- +$1,490/yr (+$124/mo · 208.0%)
ⓘ Screening estimate from a state-policy table — verify with the county assessor before closing.
Climate risk First Street
- Flood 1/10 Low FEMA zone X (unshaded) · 0% chance over 30 yrs
- Wildfire 2/10 Low
- Heat 3/10 Moderate 7 d/yr ≥100°F today · 16 d/yr by 30 yrs out
- Wind 2/10 Low
- Air quality 2/10 Low 1 unhealthy d/yr today · 3 by 30 yrs out
Nearby sold comps map
Loading sold comps map…
Walkable amenities ~0.75 mi
Loading nearby amenities…
Taxation est. · year 1
- Rental income
- $22,713
- − Mortgage interest
- −$13,444
- − Property taxes
- −$716
- − Insurance
- −$1,200
- − Repairs & maintenance
- −$1,817
- − Management
- −$1,817
- − Depreciation
- −$6,982
- Taxable loss
- −$3,263
- Est. tax savings @ 24.0%
- +$783
- After-tax cash flow
- $1,707/yr
For passive investors: Depreciation is non-cash, so a rental often shows a tax loss while cash-flowing — sheltering income. Rental losses are passive: they offset passive income freely, and up to $25,000/yr can offset ordinary (W-2) income if you actively participate and your MAGI is under $100k (phasing out to $0 by $150k); unused losses carry forward. On sale, claimed depreciation is recaptured at up to 25%, and gains may owe capital-gains tax (a 1031 exchange can defer both). Figures are a year-1 estimate at your 24.0% rate — not tax advice; consult a CPA.
Schools (NCES district)
- District
- Bedford Public Schools
- NCES district ID
- 2604470
- Math proficiency
- 33% ▼ -14.00%
- Reading proficiency
- 53% ▼ -3.00%
- Median HH income
- $63,784
- Composite
- 38.22/100
- National rank
- #4252
- State rank
- #150 of 540 in MI
Livability — Lambertville
- Score
- 80/100
- State rank
- #78
- US rank
- #1689
Category grades
Schools grade is shown separately in the Schools card above.
Census & demographics
- County
- Monroe · 31,363 people
- Metro
- Monroe, MI
- Population (ZIP)
- 20,705
- Household income
- $83,155
- Rent vs Own
- Severe rent burden
- 12.7
Population outlook (Monroe County) Hauer SSP2
- Today (2025)
- 144,439 people
- By 2030
- 140,033 · -3.1%
- By 2040
- 128,408 · -11.1%
- By 2050
- 115,024 · -20.4%
- By 2075
- 87,273 · -39.6%
- By 2100
- 63,110 · -56.3%
Race, ethnicity, and origin ACS 2023
- Neighborhood character
- Predominantly White (90%)
- Race & ethnicity
- White 90% Hispanic / Latino 6% Two or more races 5% Black 1%
- Hispanic origin (detail)
- Mexican 4%
- Common ancestry
- Romanian 14% Lithuanian 4% Italian 3%
- Foreign-born
- 2% · Canada
- Languages at home
- 97% English-only · Spanish 2% Other Indo-European 1%
Political lean MEDSL · Monroe
- 2024 margin
- Strong R (+27.1) · D 35.7% · R 62.9% · Other 1.4%
- 2008→2024 swing
- -31.5pp toward R · 2008: 4.3pp · 2024: -27.1pp
- All cycles
- 2024: R+27.1 2020: R+22.6 2016: R+22.1 2012: D+1.0 2008: D+4.3
Not yet ingested
- Civics
- —
Market trends
- HPI YoY
- ▼ -140.99%
- Current HPI
- 158.2484
- Rent YoY
- —
- Metro
- —
- State GDP YoY
- ▲ 1.37%
- F500 in state
- 28
Industry mix (Fortune 500 HQ in MI)
| Industry | F500 HQs | Revenue |
|---|---|---|
| Automotive Parts | 3 | $48B |
|
||
| Automotive | 2 | $372B |
|
||
| Chemicals | 1 | $45B |
|
||
| Automotive Retail | 1 | $29B |
|
||
| Healthcare / Medical Devices | 1 | $23B |
|
||
| Automotive Technology | 1 | $20B |
|
||
Price history
+8.3% since first listed7 events — show timeline
- 2026-06-12 Sold (MLS) $260,000 REALCOMP
- 2026-06-12 Sold (MLS) $260,000 MiRealSource-MiMLS
- 2026-05-19 Pending — REALCOMP
- 2026-05-19 Pending — MiRealSource-MiMLS
- 2026-05-15 Listed $240,000 REALCOMP
- 2026-05-15 Listed $240,000 MiRealSource-MiMLS
- 2026-05-12 Coming Soon $240,000 MiRealSource-MiMLS
Property tax history
-3.8%/yrLatest (2025): $716 · -57.2% YoY. Source: county tax records.
Cash-flow waterfall
monthlySold comps — $/sqft
last 12 mo · ≤1 miLoading sold comps…