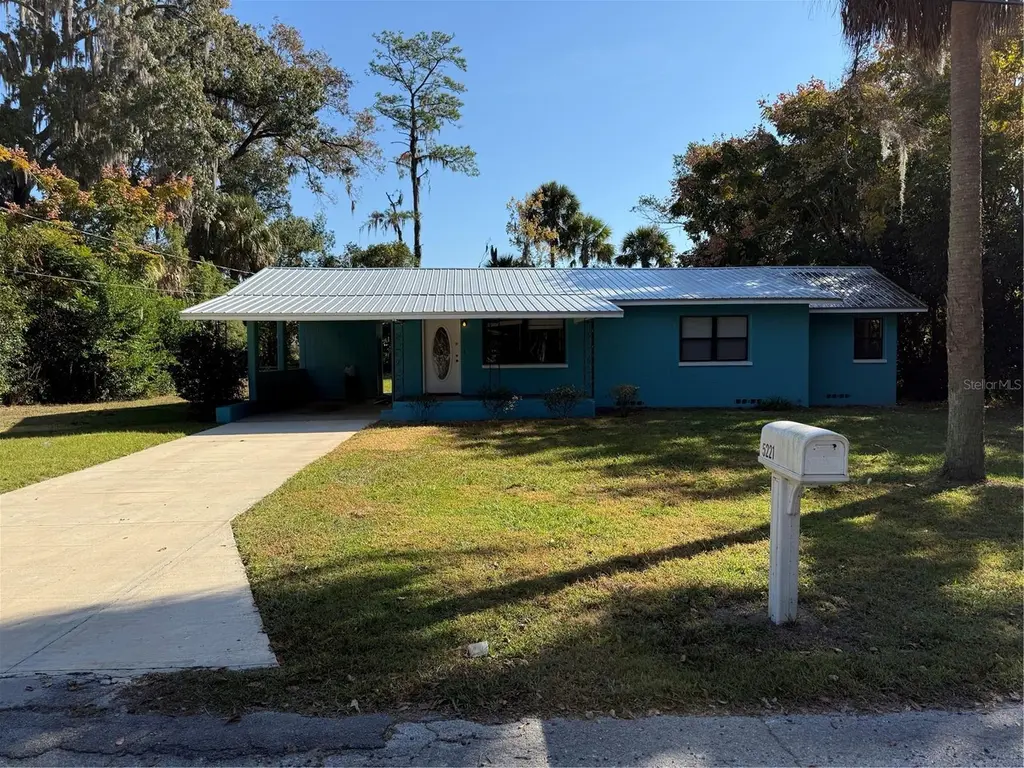
5221 SE 21st Ave · Ocala, FL
Flood risk 1/10 · Minimal
- FEMA flood zone
- X (unshaded)
- Chance of flooding over 30 yrs
- 0.0%
- Est. flood insurance / yr
- $507 – $1,088
Fire risk 5/10 · Moderate
- Est. fire insurance / yr
- $947 – $1,759
Heat risk 8/10 · Major
- Hot days now (above 108°F)
- 7 days/yr
- Hot days in 30 yrs
- 21 days/yr
Wind risk 9/10 · Severe
- Chance of severe wind over 30 yrs
- 99.0%
Air-quality risk 3/10 · Minor
- Unhealthy air days now
- 3 days/yr
- Unhealthy air days in 30 yrs
- 4 days/yr
Risk factors via First Street. Map © Google.
Why this score? — see what drove the D grade
The composite is a weighted blend of 9 inputs, each scored 0–100. Each bar is that input's sub-score; the figure is the points it added to the 100-point composite (weight × sub-score).
- Cash flow +14.8/30.0
- ARV discount +7.8/15.0
- DSCR +4.5/10.0
- Schools +3.6/10.0
- Livability +3.5/5.0
- Rent growth +3.2/5.0
- 1% rule +3.1/10.0
- Condition / age +2.5/5.0
- Appreciation +0.0/10.0
$179,900
🖨 Deal sheet (PDF) 📄 Offer letter ✓ Due diligence
Listing remarks MLS
Charming 2-bedroom, 1-bath home in a fantastic central location. This cozy property sits on a quiet street and features a peaceful front porch sitting area, a carport, and a spacious backyard perfect for relaxing or entertaining. The home offers fresh exterior paint, a durable metal roof installed three years ago, and a new well replaced just 1.5 years ago for added peace of mind. Conveniently located with easy access to major travel routes—and with a Wawa right next door—this home blends comfort, character, and everyday convenience.
Key facts
- Durable metal roof
- New well
- Spacious backyard
Tags
Neighborhood map
What this means for you Summary
Snapshot
- This is a 2-bed/1.0-bath single-family listed at $180k.
Deal economics
- At list price, monthly cash flow is $50 ($605/yr) — positive.
- The deal already cash-flows at list — no discount required.
- To meet the 1% rule (rent ≥ 1% of price), the offer needs to be $145k (19.4% below list).
- Recommended offer: $145k (19.4% below list) — sets the bar for 1% rule.
- Cap rate 6.6% vs local median 4.1% in Ocala — top-decile yield for the area; either an underpriced asset or a hidden risk that comps aren't pricing in. Stress-test before assuming the spread holds.
Location & tenants
- Location reads 69/100 on livability (#476 in FL) — a middle-class / working-renter tenant base. Strengths: cost of living A+, housing A+, health & safety A+; Watch: crime F, amenities F, commute F.
- Marion (rural): math 42% / reading 43% proficiency, ranked #61 of 73 in FL (top 84%) — families likely to look elsewhere, expect single-tenant / working-renter base with shorter leases; 61% free/reduced lunch — lower-income household profile, screen leases tightly.
- Zoned schools: Shady Hill Elementary School (math 69% / reading 53%, grade B, #653 of 2,144 statewide, top 31%, 643 students, 56% FRL); Belleview Middle School (math 49% / reading 50%, grade C, #259 of 571 statewide, top 46%, 1,573 students, 60% FRL); Belleview High School (math 31% / reading 46%, grade F, #321 of 667 statewide, top 49%, 1,783 students, 56% FRL) — zoned schools at 57% FRL track the district average.
- Market conditions: Rents rising (+2.8%/yr); 350 active listings in the ZIP; 5 comparable units currently listed for rent nearby; rentals at typical pace (median 23d on market — plan ~3-4 weeks tenant-placement turnaround); solid renter incomes; 7,071 units permitted in Marion County in 2024 (534 in 5+ unit buildings).
Forward outlook
- Local home prices are declining (-3.0%/yr); year-one equity from $1k of loan paydown is wiped out by about $5k of value loss. Plan a longer hold.
- Marion County population projected at +13% by 2050 — modest demand growth; plan on rents tracking national, not racing it.
Negotiation context
- It's been on market 172 days — a 12% lower offer ($158k) is reasonable based on typical stale-listing flexibility.
- 8 sale attempts since 18y ago; this cycle's ask has dropped $10k (5%) from the opening price — seller is motivated, your offer sets the floor, not the list.
- Current owner paid $77k; list at $180k implies a 134% gain — meaningful room to come down on a strong offer.
Risks & watch-outs
- Watch-outs: built in 1958 — expect roof / HVAC / electrical / plumbing capex.
- Climate carrying-cost: severe wind risk, 99% chance of damaging wind over 30y; moderate wildfire risk; extreme-heat days projected 7→21/yr by 2055 (HVAC capex compounding) — expect insurance premiums to compound above CPI over the hold.
Questions for the listing agent
- It's been on market 172 days. Have you received any prior offers? Is the seller open to a 19% concession, seller financing, or rate buy-down credit?
- Built in 1958 — when were the roof, HVAC, electrical panel, plumbing, and water heater last replaced?
- Why hasn't it sold? Are there any deal-killer items the seller is aware of (foundation, flood, title, zoning, code violations)?
- Is there a deadline driving the sale (1031 exchange, divorce, estate, relocation)? That informs how much negotiation room exists.
- Crime grade is F in this area — have there been break-ins, vandalism, or insurance claims at this property in the last 3 years? What carrier currently insures it and at what premium?
- The area grade is low — what's the realistic commute time and amenity access for the typical tenant pool here? Any planned neighborhood developments (good or bad) we should know about?
- What's the average days-on-market for RENTAL listings here right now (not sales)? A rising rental-DOM trend means longer vacancies and softer asking-rent achievability than the comps imply.
- What's the recent tenant-quality profile in this submarket — average credit score on applications, eviction rate, late-payment / NSF rate, and stable-employment percentage? A property-management company in the area should have these aggregated.
- How much new for-sale + rental construction is in the pipeline within 1–3 miles? Heavy new supply typically softens prices + rents 12–24 months out; constrained supply supports both.
Investment metrics
- 1% rule
- 0.81% ✗
- Cap rate
- 6.63%
- Cash-on-cash
- 1.20%
- DSCR
- 1.05
- GRM
- 10.3
CMA / ARV
- ARV (median comp)
- $181,297
- List price
- $179,900
- Delta
- -0.77%
- Verdict
- FAIR
- Comps
- 12 within 1.0 mi
Show comp detail 2 sales within ~0.75 mi
| Address | Dist | Beds/Ba | Sqft | Sold | Price | $/sf | Match |
|---|---|---|---|---|---|---|---|
| 6100 SE 22nd Ave | 0.57mi | 2/1.0 | 1,104 (+2%) | 18mo | $168,250 | $152 | 55 |
| 5431 SE 28th Ct | 0.74mi | 3/2.0 (+1) | 920 (-15%) | 15mo | $33,000 | $36 | 19 |
Match score weights: distance 35% · size 25% · config 20% · recency 20%. Top-matched comps best support the ARV.
Projected returns pro-forma
-3.0% appreciation · 2.84% rent growth · sell at horizon
- IRR
- -14.6%
- Equity multiple
- 0.48×
- Total profit
- $-26,244
- Equity at exit
- $26,824
- IRR
- -6.2%
- Equity multiple
- 0.60×
- Total profit
- $-19,953
- Equity at exit
- $15,554
Cash invested: $50,372 (down + closing). Projections, not guarantees.
Landlord ↔ Tenant lean methodology
- Overall (STATE)
- 87 Strongly Landlord-Friendly
- State Florida
- 87 Strongly Landlord-Friendly · R+3
- County
- — inherits STATE
- City
- — inherits STATE
ZIP-level market 34480
- Home prices YoY
- -28.7%
- Rents YoY
- 2.8%
- Active inventory
- 350
- Price-to-rent
- 10.3×
Monthly cashflow live
- Estimated rent
- $1,450 high interval (Pro) →
- Mortgage (P&I)
- −$943
- Tax from tax record
- −$77 /mo · $924/yr
- Insurance
- −$75
- HOA
- −$0
- Vacancy / Maint / Mgmt
- −$305
- Net cashflow
- $50
Break-even live
Sensitivity live
| Price | -10% $152 | -5% $101 | +0% $50 | +5% $-1 | +10% $-51 |
|---|---|---|---|---|---|
| Rent | -10% $-64 | -5% $-7 | +0% $50 | +5% $108 | +10% $165 |
| Rate | -1.0pp $141 | -0.5pp $96 | base $50 | +0.5pp $4 | +1.0pp $-44 |
UW: 25.0% down · 7.5% · 30yr · 1.5% tax · 5.0% vac · 8.0% maint · 8.0% mgmt
Financing live
Cash to close
- Down payment
- $44,975
- Closing costs
- $5,397
- Reserves months
- —
- Total cash needed
- —
Loan-product check · same deal, 3 products live
Conventional
25% down · 7.5% · 30yr
- Down + closing
- —
- Monthly P&I
- —
- Monthly cashflow
- —
- DSCR
- —
- Eligible?
- —
Personal DTI + credit; lowest rate.
DSCR
20% down · 8.5% · 30yr
- Down + closing
- —
- Monthly P&I
- —
- Monthly cashflow
- —
- DSCR
- —
- Eligible?
- —
No personal income docs; deal must DSCR.
Hard money
10% down · 12.0% · 12mo
- Down + closing
- —
- Monthly P&I
- —
- Monthly cashflow
- —
- DSCR
- —
- Eligible?
- —
Short-term bridge; refi at stabilization.
Rent comps 5 comps
| Address | Beds | Baths | Sqft | Rent | $/sqft | DOM | Units | Dist |
|---|---|---|---|---|---|---|---|---|
| 3950 SE 19th Ave Unit D Ocala, FL | 2.0 | 1.0 | 808 | $1,250 | $1.55 | 23d | 1 | 1.03mi |
| 4861 SE 31st Ter Ocala, FL | 3.0 | 2.0 | 1482 | $1,700 | $1.15 | 23d | 1 | 1.07mi |
| 3800 SE 17th Ct Unit B Ocala, FL | 2.0 | 1.0 | 808 | $1,199 | $1.48 | 23d | 1 | 1.11mi |
| 6851 SE 23rd Ave Ocala, FL | 3.0 | 2.0 | 1200 | $1,550 | $1.29 | 23d | 1 | 1.12mi |
| 2270 SE 34th St Ocala, FL | 2.0 | 1.5 | 1022 | $1,500 | $1.47 | 15d | 1 | 1.32mi |
Listing history 19 events
-
2026-04-16status Active 551-char remark
Show marketing remark (551 chars)
Charming 2-bedroom, 1-bath home in a fantastic central location. This cozy property sits on a quiet street and features a peaceful front porch sitting area, a carport, and a spacious backyard perfect for relaxing or entertaining. The home offers fresh exterior paint, a durable metal roof installed three years ago, and a new well replaced just 1.5 years ago for added peace of mind. Conveniently located with easy access to major travel routes—and with a Wawa right next door—this home blends comfort, character, and everyday convenience.
-
2026-04-08status Pending 551-char remark
Show marketing remark (551 chars)
Charming 2-bedroom, 1-bath home in a fantastic central location. This cozy property sits on a quiet street and features a peaceful front porch sitting area, a carport, and a spacious backyard perfect for relaxing or entertaining. The home offers fresh exterior paint, a durable metal roof installed three years ago, and a new well replaced just 1.5 years ago for added peace of mind. Conveniently located with easy access to major travel routes—and with a Wawa right next door—this home blends comfort, character, and everyday convenience.
-
2025-12-18price $179,900 551-char remark
Show marketing remark (551 chars)
Charming 2-bedroom, 1-bath home in a fantastic central location. This cozy property sits on a quiet street and features a peaceful front porch sitting area, a carport, and a spacious backyard perfect for relaxing or entertaining. The home offers fresh exterior paint, a durable metal roof installed three years ago, and a new well replaced just 1.5 years ago for added peace of mind. Conveniently located with easy access to major travel routes—and with a Wawa right next door—this home blends comfort, character, and everyday convenience.
-
2025-11-21$189,900 Active 551-char remark
Show marketing remark (551 chars)
Charming 2-bedroom, 1-bath home in a fantastic central location. This cozy property sits on a quiet street and features a peaceful front porch sitting area, a carport, and a spacious backyard perfect for relaxing or entertaining. The home offers fresh exterior paint, a durable metal roof installed three years ago, and a new well replaced just 1.5 years ago for added peace of mind. Conveniently located with easy access to major travel routes—and with a Wawa right next door—this home blends comfort, character, and everyday convenience.
-
2021-04-30historical 183-char remark
Show marketing remark (183 chars)
Great home to get started; No repairs or deferred maintenance; Restored house on quite cul-de-sac street; 2010 replaced roof; 2010 replaced HVAC; nice lot with privacyOwner is Realtor
-
2018-10-24soldstatus $77,000
-
2018-10-24soldstatus $77,000
-
2018-08-16$79,900
-
2018-08-16historical
-
2018-08-13$84,500
-
2018-07-17historical
-
2018-01-17$89,000
-
2011-05-09$55,000 183-char remark
Show marketing remark (183 chars)
Great home to get started; No repairs or deferred maintenance; Restored house on quite cul-de-sac street; 2010 replaced roof; 2010 replaced HVAC; nice lot with privacyOwner is Realtor
-
2008-09-15$93,500
-
2008-08-13soldstatus $53,000
-
2008-08-12soldstatus $53,000
-
2008-06-16$53,500
-
2003-01-24soldstatus $51,900
-
1992-07-01soldstatus $35,000
ⓘ Source: listings_history table (triggers on properties + properties_extension) + one-shot
backfill from property_details.listing_events for pre-trigger history.
Tax reassessment forecast FL · Resets to sale price
- Current annual tax
- $924 · $77/mo
- Projected year-2 tax
- $1,493 · $124/mo
- Expected delta
- +$570/yr (+$47/mo · 61.7%)
ⓘ Screening estimate from a state-policy table — verify with the county assessor before closing.
Climate risk First Street
- Flood 1/10 Low FEMA zone X (unshaded) · 0% chance over 30 yrs
- Wildfire 5/10 Major
- Heat 8/10 Severe 7 d/yr ≥108°F today · 21 d/yr by 30 yrs out
- Wind 9/10 Extreme 99% chance of damaging wind over 30 yrs
- Air quality 3/10 Moderate 3 unhealthy d/yr today · 4 by 30 yrs out
Nearby sold comps map
Loading sold comps map…
Walkable amenities ~0.75 mi
Loading nearby amenities…
Taxation est. · year 1
- Rental income
- $17,404
- − Mortgage interest
- −$10,077
- − Property taxes
- −$924
- − Insurance
- −$900
- − Repairs & maintenance
- −$1,392
- − Management
- −$1,392
- − Depreciation
- −$5,233
- Taxable loss
- −$2,515
- Est. tax savings @ 24.0%
- +$604
- After-tax cash flow
- $1,208/yr
For passive investors: Depreciation is non-cash, so a rental often shows a tax loss while cash-flowing — sheltering income. Rental losses are passive: they offset passive income freely, and up to $25,000/yr can offset ordinary (W-2) income if you actively participate and your MAGI is under $100k (phasing out to $0 by $150k); unused losses carry forward. On sale, claimed depreciation is recaptured at up to 25%, and gains may owe capital-gains tax (a 1031 exchange can defer both). Figures are a year-1 estimate at your 24.0% rate — not tax advice; consult a CPA.
Schools (NCES district)
- District
- Marion
- NCES district ID
- 1201260
- Math proficiency
- 42% ▼ -7.00%
- Reading proficiency
- 43% ▼ -4.00%
- Median HH income
- $40,015
- Composite
- 35.61/100
- National rank
- #4890
- State rank
- #61 of 73 in FL
Livability — Ocala
- Score
- 69/100
- State rank
- #476
- US rank
- #8461
Category grades
Schools grade is shown separately in the Schools card above.
Census & demographics
- County
- Marion County · 315,796 people
- City population
- 263,375
- Metro
- Ocala, FL
- Population (ZIP)
- 23,517
- Household income
- $77,557
- Rent vs Own
- Severe rent burden
- 169.0
Population outlook (Marion County) Hauer SSP2
- Today (2025)
- 365,905 people
- By 2030
- 376,768 · +3.0%
- By 2040
- 396,555 · +8.4%
- By 2050
- 412,723 · +12.8%
- By 2075
- 446,090 · +21.9%
- By 2100
- 436,193 · +19.2%
Race, ethnicity, and origin ACS 2023
- Neighborhood character
- Predominantly White (73%)
- Race & ethnicity
- White 73% Hispanic / Latino 15% Two or more races 11% Black 6% Asian 2%
- Hispanic origin (detail)
- Mexican 3% Puerto Rican 5% Cuban 2% Dominican 2%
- Common ancestry
- Italian 3% Slovak 3% Lithuanian 2%
- Foreign-born
- 6% · Canada
- Languages at home
- 89% English-only · Spanish 9% Other Asian/Pacific 1%
Political lean MEDSL · Marion
- 2024 margin
- Solid R (+31.6) · D 33.8% · R 65.5%
- 2008→2024 swing
- -20.0pp toward R · 2008: -11.6pp · 2024: -31.6pp
- All cycles
- 2024: R+31.6 2020: R+25.9 2016: R+26.2 2012: R+16.2 2008: R+11.6
Not yet ingested
- Civics
- —
Market trends
- HPI YoY
- ▼ -85.60%
- Current HPI
- 212.4262
- Rent YoY
- ▲ 2.84%
- Metro
- Ocala, FL
- State GDP YoY
- ▲ 3.28%
- F500 in state
- 36
Industry mix (Fortune 500 HQ in FL)
| Industry | F500 HQs | Revenue |
|---|---|---|
| Industrial Technology | 2 | $29B |
|
||
| Insurance | 2 | $17B |
|
||
| Retail | 1 | $60B |
|
||
| Technology Distribution | 1 | $58B |
|
||
| Homebuilding | 1 | $35B |
|
||
| Technology Manufacturing | 1 | $35B |
|
||
Price history
+414.0% since first listed19 events — show timeline
- 2026-04-16 Relisted — Stellar MLS as Distributed by MLS Grid
- 2026-04-08 Pending — Stellar MLS as Distributed by MLS Grid
- 2025-12-18 Price Changed $179,900 Stellar MLS as Distributed by MLS Grid
- 2025-11-21 Listed $189,900 Stellar MLS as Distributed by MLS Grid
- 2021-04-30 Listing Removed — Stellar MLS as Distributed by MLS Grid
- 2018-10-24 Sold (Public Records) $77,000 Public Records
- 2018-10-24 Sold (MLS) $77,000 Stellar MLS as Distributed by MLS Grid
- 2018-08-16 Listing Removed — Stellar MLS as Distributed by MLS Grid
- 2018-08-16 Listed $79,900 Stellar MLS as Distributed by MLS Grid
- 2018-08-13 Listed $84,500 Stellar MLS as Distributed by MLS Grid
- 2018-07-17 Listing Removed — Stellar MLS as Distributed by MLS Grid
- 2018-01-17 Listed $89,000 Stellar MLS as Distributed by MLS Grid
- 2011-05-09 Listed $55,000 Stellar MLS as Distributed by MLS Grid
- 2008-09-15 Listed $93,500 Stellar MLS as Distributed by MLS Grid
- 2008-08-13 Sold (Public Records) $53,000 Public Records
- 2008-08-12 Sold (MLS) $53,000 Stellar MLS as Distributed by MLS Grid
- 2008-06-16 Listed $53,500 Stellar MLS as Distributed by MLS Grid
- 2003-01-24 Sold (Public Records) $51,900 Public Records
- 1992-07-01 Sold (Public Records) $35,000 Public Records
Property tax history
+0.1%/yrLatest (2025): $924 · +30.3% YoY. Source: county tax records.
Cash-flow waterfall
monthlySold comps — $/sqft
last 12 mo · ≤1 miLoading sold comps…