4404 Platt Rd · Plant City, FL
Flood risk 1/10 · Minimal
- FEMA flood zone
- X (unshaded)
- Chance of flooding over 30 yrs
- 0.0%
- Est. flood insurance / yr
- $507 – $1,088
Fire risk 4/10 · Minor
- Est. fire insurance / yr
- $947 – $1,759
Heat risk 9/10 · Severe
- Hot days now (above 108°F)
- 7 days/yr
- Hot days in 30 yrs
- 24 days/yr
Wind risk 10/10 · Severe
- Chance of severe wind over 30 yrs
- 99.0%
Air-quality risk 2/10 · Minimal
- Unhealthy air days now
- 2 days/yr
- Unhealthy air days in 30 yrs
- 2 days/yr
Risk factors via First Street. Map © Google.
Why this score? — see what drove the D grade
The composite is a weighted blend of 9 inputs, each scored 0–100. Each bar is that input's sub-score; the figure is the points it added to the 100-point composite (weight × sub-score).
- Cash flow +13.8/30.0
- ARV discount +7.5/15.0
- DSCR +4.2/10.0
- Schools +4.2/10.0
- Livability +3.8/5.0
- 1% rule +3.0/10.0
- Rent growth +2.5/5.0
- Condition / age +2.5/5.0
- Appreciation +0.0/10.0
$285,000
🖨 Deal sheet (PDF) 📄 Offer letter ✓ Due diligence
Listing remarks MLS
Oak trees, remodeled home country-style entertainment cntr in LR, corner cabinet in M Bd. Over metal roof extends to a 52x10 front porch(est) and 52x10 porch on back (est). Above ground pool w/ chain like fence. Back fenced for horse, etc. Utility shed. Also on side is a carport. Must see to appreciate.
Key facts
- Metal roof
- Central heat and air
- Spacious kitchen
Tags
Property features AI
Exterior
- Home design: Built in 1990
- Exterior features: Located in the Knights Community Club subdivision
Interior
- Interior features: Living area of 1404
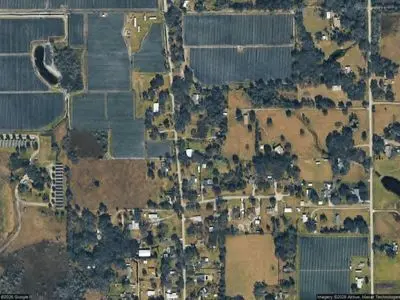
Neighborhood map
What this means for you Summary
Snapshot
- This is a 3-bed/2.0-bath manufactured listed at $285k.
Deal economics
- At list price, monthly cash flow is $26 ($315/yr) — positive.
- The deal already cash-flows at list — no discount required.
- To meet the 1% rule (rent ≥ 1% of price), the offer needs to be $229k (19.6% below list).
- Recommended offer: $229k (19.6% below list) — sets the bar for 1% rule.
Location & tenants
- Location reads 76/100 on livability (#227 in FL, #3,587 nationally) — a middle-class / working-renter tenant base. Strengths: amenities A+, cost of living A+, housing A+; Watch: employment C-, commute F.
- Hillsborough (suburban): math 47% / reading 50% proficiency, ranked #41 of 73 in FL (top 56%) — families likely to look elsewhere, expect single-tenant / working-renter base with shorter leases.
- Zoned schools: Cork Elementary School (math 38% / reading 44%, grade F, #1,454 of 2,144 statewide, top 69%, 690 students, 64% FRL); Tomlin Middle School (math 45% / reading 39%, grade D-, #340 of 571 statewide, top 61%, 1,499 students, 64% FRL); Strawberry Crest High School (math 49% / reading 55%, grade D+, #160 of 667 statewide, top 25%, 2,558 students, 44% FRL).
- Market conditions: 323 active listings in the ZIP; 9,053 units permitted in Hillsborough County in 2024 (4,555 in 5+ unit buildings).
- This rent runs 37% of the median local income ($73k/yr) — at the standard rent-burdened threshold; future hikes will face affordability resistance.
Forward outlook
- Local home prices are declining (-3.0%/yr); year-one equity from $2k of loan paydown is wiped out by about $9k of value loss. Plan a longer hold.
- Hillsborough County population projected at +37% by 2050 — long-run rental-demand tailwind backs the buy-and-hold thesis.
Negotiation context
- It's been on market 26 days — a 2% lower offer ($281k) is reasonable based on typical stale-listing flexibility.
- 3 sale attempts since 21y ago with the ask held roughly flat each time — persistent listings suggest the price (not the market) is what's stuck; bring a comps-based counter.
- Current owner paid $147k; list at $285k implies a 94% gain — meaningful room to come down on a strong offer.
Risks & watch-outs
- Climate carrying-cost: severe wind risk, 99% chance of damaging wind over 30y; extreme-heat days projected 7→24/yr by 2055 (HVAC capex compounding) — expect insurance premiums to compound above CPI over the hold.
Questions for the listing agent
- Is there a deadline driving the sale (1031 exchange, divorce, estate, relocation)? That informs how much negotiation room exists.
- Schools are D-rated, which usually means shorter tenancies and higher turnover. Who's the typical renter profile here, and what's been the actual vacancy rate?
- The area grade is low — what's the realistic commute time and amenity access for the typical tenant pool here? Any planned neighborhood developments (good or bad) we should know about?
- What's the average days-on-market for RENTAL listings here right now (not sales)? A rising rental-DOM trend means longer vacancies and softer asking-rent achievability than the comps imply.
- What's the recent tenant-quality profile in this submarket — average credit score on applications, eviction rate, late-payment / NSF rate, and stable-employment percentage? A property-management company in the area should have these aggregated.
- How much new for-sale + rental construction is in the pipeline within 1–3 miles? Heavy new supply typically softens prices + rents 12–24 months out; constrained supply supports both.
Investment metrics
- 1% rule
- 0.80% ✗
- Cap rate
- 6.40%
- Cash-on-cash
- 0.40%
- DSCR
- 1.02
- GRM
- 10.4
CMA / ARV
No comps found within radius.
Projected returns pro-forma
-3.0% appreciation · 3.0% rent growth · sell at horizon
- IRR
- -15.7%
- Equity multiple
- 0.44×
- Total profit
- $-44,588
- Equity at exit
- $42,494
- IRR
- -7.3%
- Equity multiple
- 0.54×
- Total profit
- $-36,994
- Equity at exit
- $24,642
Cash invested: $79,800 (down + closing). Projections, not guarantees.
Landlord ↔ Tenant lean methodology
- Overall (STATE)
- 87 Strongly Landlord-Friendly
- State Florida
- 87 Strongly Landlord-Friendly · R+3
- County
- — inherits STATE
- City
- — inherits STATE
ZIP-level market 33565
- Home prices YoY
- -24.7%
- Active inventory
- 323
- Price-to-rent
- 10.4×
Monthly cashflow live
- Estimated rent
- $2,292 medium interval (Pro) →
- Mortgage (P&I)
- −$1,495
- Tax from tax record
- −$171 /mo · $2,053/yr
- Insurance
- −$119
- HOA
- −$0
- Vacancy / Maint / Mgmt
- −$481
- Net cashflow
- $26
Break-even live
Sensitivity live
| Price | -10% $188 | -5% $107 | +0% $26 | +5% $-54 | +10% $-135 |
|---|---|---|---|---|---|
| Rent | -10% $-155 | -5% $-64 | +0% $26 | +5% $117 | +10% $207 |
| Rate | -1.0pp $170 | -0.5pp $99 | base $26 | +0.5pp $-48 | +1.0pp $-123 |
UW: 25.0% down · 7.5% · 30yr · 1.5% tax · 5.0% vac · 8.0% maint · 8.0% mgmt
Financing live
Cash to close
- Down payment
- $71,250
- Closing costs
- $8,550
- Reserves months
- —
- Total cash needed
- —
Loan-product check · same deal, 3 products live
Conventional
25% down · 7.5% · 30yr
- Down + closing
- —
- Monthly P&I
- —
- Monthly cashflow
- —
- DSCR
- —
- Eligible?
- —
Personal DTI + credit; lowest rate.
DSCR
20% down · 8.5% · 30yr
- Down + closing
- —
- Monthly P&I
- —
- Monthly cashflow
- —
- DSCR
- —
- Eligible?
- —
No personal income docs; deal must DSCR.
Hard money
10% down · 12.0% · 12mo
- Down + closing
- —
- Monthly P&I
- —
- Monthly cashflow
- —
- DSCR
- —
- Eligible?
- —
Short-term bridge; refi at stabilization.
Listing history 24 events
-
2026-06-21days on market $285,000 Active 26 DOM
-
2026-06-18days on market $285,000 Active 23 DOM
-
2026-06-17days on market $285,000 Active 22 DOM
-
2026-06-16days on market $285,000 Active 21 DOM
-
2026-06-15days on market $285,000 Active 20 DOM
-
2026-06-13days on market $285,000 Active 18 DOM
-
2026-06-13days on market $285,000 Active 17 DOM
-
2026-06-09days on market $285,000 Active 14 DOM
-
2026-06-08days on market $285,000 Active 13 DOM
-
2026-06-07days on market $285,000 Active 12 DOM
-
2026-06-04days on market $285,000 Active 9 DOM
-
2026-06-03days on market $285,000 Active 8 DOM
-
2026-06-02days on market $285,000 Active 7 DOM
-
2026-06-01days on market $285,000 Active 6 DOM
-
2026-05-31days on market $285,000 Active 5 DOM
-
2026-05-27$285,000 Active
-
2026-02-07historical
-
2026-01-16price $299,000
-
2025-12-02price $310,000
-
2025-11-07$319,900 Active
-
2005-11-04soldstatus $147,000
-
2005-10-03soldstatus $147,000 305-char remark
Show marketing remark (305 chars)
Oak trees, remodeled home country-style entertainment cntr in LR, corner cabinet in M Bd. Over metal roof extends to a 52x10 front porch(est) and 52x10 porch on back (est). Above ground pool w/ chain like fence. Back fenced for horse, etc. Utility shed. Also on side is a carport. Must see to appreciate.
-
2005-08-30$152,000 305-char remark
Show marketing remark (305 chars)
Oak trees, remodeled home country-style entertainment cntr in LR, corner cabinet in M Bd. Over metal roof extends to a 52x10 front porch(est) and 52x10 porch on back (est). Above ground pool w/ chain like fence. Back fenced for horse, etc. Utility shed. Also on side is a carport. Must see to appreciate.
-
2001-07-06soldstatus $66,000
ⓘ Source: listings_history table (triggers on properties + properties_extension) + one-shot
backfill from property_details.listing_events for pre-trigger history.
Tax reassessment forecast FL · Resets to sale price
- Current annual tax
- $2,053 · $171/mo
- Projected year-2 tax
- $2,366 · $197/mo
- Expected delta
- +$313/yr (+$26/mo · 15.2%)
ⓘ Screening estimate from a state-policy table — verify with the county assessor before closing.
Climate risk First Street
- Flood 1/10 Low FEMA zone X (unshaded) · 0% chance over 30 yrs
- Wildfire 4/10 Moderate
- Heat 9/10 Extreme 7 d/yr ≥108°F today · 24 d/yr by 30 yrs out
- Wind 10/10 Extreme 99% chance of damaging wind over 30 yrs
- Air quality 2/10 Low 2 unhealthy d/yr today · 2 by 30 yrs out
Nearby sold comps map
Loading sold comps map…
Walkable amenities ~0.75 mi
Loading nearby amenities…
Taxation est. · year 1
- Rental income
- $27,503
- − Mortgage interest
- −$15,964
- − Property taxes
- −$2,053
- − Insurance
- −$1,425
- − Repairs & maintenance
- −$2,200
- − Management
- −$2,200
- − Depreciation
- −$8,291
- Taxable loss
- −$4,630
- Est. tax savings @ 24.0%
- +$1,111
- After-tax cash flow
- $1,426/yr
For passive investors: Depreciation is non-cash, so a rental often shows a tax loss while cash-flowing — sheltering income. Rental losses are passive: they offset passive income freely, and up to $25,000/yr can offset ordinary (W-2) income if you actively participate and your MAGI is under $100k (phasing out to $0 by $150k); unused losses carry forward. On sale, claimed depreciation is recaptured at up to 25%, and gains may owe capital-gains tax (a 1031 exchange can defer both). Figures are a year-1 estimate at your 24.0% rate — not tax advice; consult a CPA.
Schools (NCES district)
- District
- Hillsborough
- NCES district ID
- 1200870
- Math proficiency
- 47% ▼ -8.00%
- Reading proficiency
- 50% ▼ -4.00%
- Median HH income
- $50,622
- Composite
- 41.6/100
- National rank
- #3435
- State rank
- #41 of 73 in FL
Livability — Plant City
- Score
- 76/100
- State rank
- #227
- US rank
- #3587
Category grades
Schools grade is shown separately in the Schools card above.
Census & demographics
- County
- Hillsborough County · 1,540,968 people
- City population
- 68,525
- Metro
- Tampa-St. Petersburg-Clearwater, FL
- Population (ZIP)
- 18,108
- Household income
- $73,414
- Rent vs Own
- Severe rent burden
- 152.0
Population outlook (Hillsborough County) Hauer SSP2
- Today (2025)
- 1,607,022 people
- By 2030
- 1,733,968 · +7.9%
- By 2040
- 1,979,565 · +23.2%
- By 2050
- 2,203,427 · +37.1%
- By 2075
- 2,667,893 · +66.0%
- By 2100
- 2,891,558 · +79.9%
Race, ethnicity, and origin ACS 2023
- Neighborhood character
- Predominantly White (71%)
- Race & ethnicity
- White 71% Hispanic / Latino 23% Two or more races 14% Black 2% Native American 1%
- Hispanic origin (detail)
- Mexican 16% Puerto Rican 2% Cuban 1%
- Common ancestry
- Romanian 2% Slovak 1% Iranian 1%
- Foreign-born
- 10% · Canada, Jamaica
- Languages at home
- 80% English-only · Spanish 19%
Political lean MEDSL · Hillsborough
- 2024 margin
- Toss-up / Even · D 47.8% · R 50.9% · Other 1.3%
- 2008→2024 swing
- -10.2pp toward R · 2008: 7.1pp · 2024: -3.1pp
- All cycles
- 2024: R+3.1 2020: D+6.9 2016: D+6.8 2012: D+6.7 2008: D+7.1
Not yet ingested
- Civics
- —
Market trends
- HPI YoY
- ▼ -114.17%
- Current HPI
- 347.2475
- Rent YoY
- —
- Metro
- Tampa-St. Petersburg-Clearwater, FL
- State GDP YoY
- ▲ 3.28%
- F500 in state
- 36
Industry mix (Fortune 500 HQ in FL)
| Industry | F500 HQs | Revenue |
|---|---|---|
| Industrial Technology | 2 | $29B |
|
||
| Insurance | 2 | $17B |
|
||
| Retail | 1 | $60B |
|
||
| Technology Distribution | 1 | $58B |
|
||
| Homebuilding | 1 | $35B |
|
||
| Technology Manufacturing | 1 | $35B |
|
||
Price history
+331.8% since first listed9 events — show timeline
- 2026-05-27 Listed $285,000 FSBO.com
- 2026-02-07 Listing Removed — Stellar MLS as Distributed by MLS Grid
- 2026-01-16 Price Changed $299,000 Stellar MLS as Distributed by MLS Grid
- 2025-12-02 Price Changed $310,000 Stellar MLS as Distributed by MLS Grid
- 2025-11-07 Listed $319,900 Stellar MLS as Distributed by MLS Grid
- 2005-11-04 Sold (Public Records) $147,000 Public Records
- 2005-10-03 Sold (MLS) $147,000 Stellar MLS as Distributed by MLS Grid
- 2005-08-30 Listed $152,000 Stellar MLS as Distributed by MLS Grid
- 2001-07-06 Sold (Public Records) $66,000 Public Records
Property tax history
+7.3%/yrLatest (2025): $2,053 · +4.4% YoY. Source: county tax records.
Cash-flow waterfall
monthlySold comps — $/sqft
last 12 mo · ≤1 miLoading sold comps…