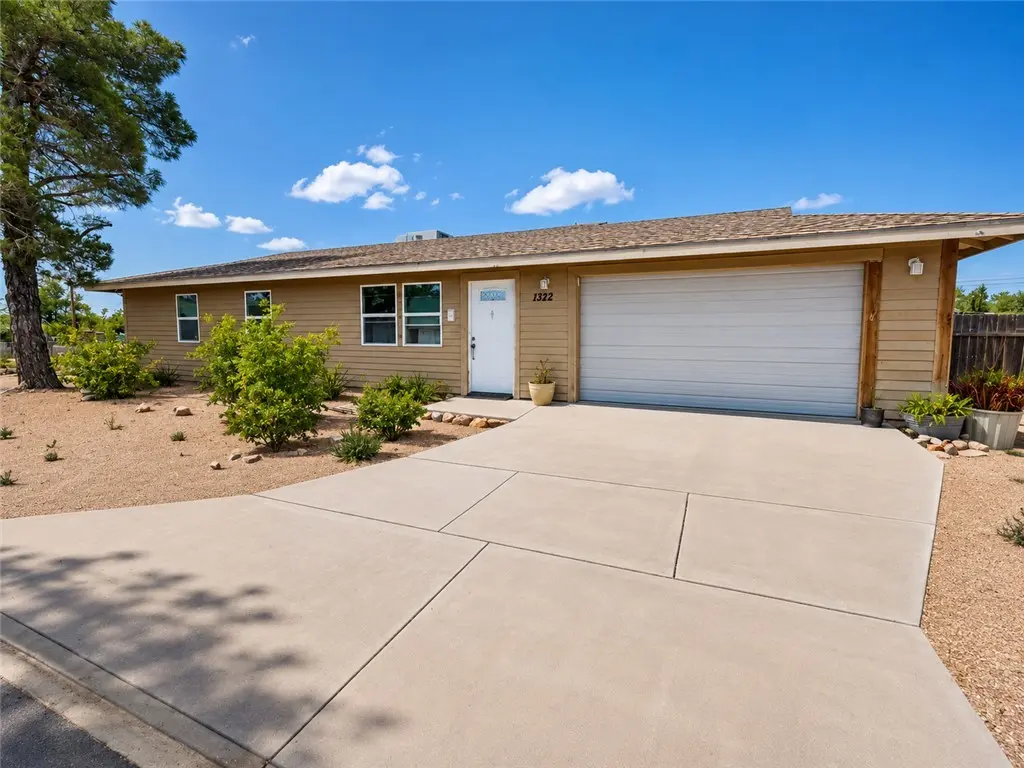
1322 Fairgrounds Blvd · Kingman, AZ
Flood risk 1/10 · Minimal
- FEMA flood zone
- X (unshaded)
- Chance of flooding over 30 yrs
- 0.0%
- Est. flood insurance / yr
- $507 – $1,088
Fire risk 7/10 · Major
- Est. fire insurance / yr
- $610 – $1,132
Heat risk 6/10 · Moderate
- Hot days now (above 100°F)
- 7 days/yr
- Hot days in 30 yrs
- 17 days/yr
Wind risk 1/10 · Minimal
- Chance of severe wind over 30 yrs
- —
Air-quality risk 1/10 · Minimal
- Unhealthy air days now
- 0 days/yr
- Unhealthy air days in 30 yrs
- 0 days/yr
Risk factors via First Street. Map © Google.
Why this score? — see what drove the D+ grade
The composite is a weighted blend of 9 inputs, each scored 0–100. Each bar is that input's sub-score; the figure is the points it added to the 100-point composite (weight × sub-score).
- Cash flow +15.8/30.0
- ARV discount +12.5/15.0
- DSCR +4.9/10.0
- Livability +4.0/5.0
- 1% rule +3.0/10.0
- Condition / age +2.5/5.0
- Rent growth +2.4/5.0
- Schools +1.8/10.0
- Appreciation +0.0/10.0
$189,900
🖨 Deal sheet (PDF) 📄 Offer letter ✓ Due diligence
Listing remarks
Opportunity in the desirable Golden Gate Addition! This 3 bedroom, 2 bathroom home offers a central location, mountain views, tile flooring throughout, covered patio, oversized driveway, attached 2-car garage, and block fenced backyard with mature trees. Spacious layout with great potential to make it your own. Conveniently located near shopping, schools, and Route 66. Property being sold as-is.
Key facts
- Covered patio
- Tile flooring
- Oversized driveway
Tags
Property features AI
Finance
- Other: Lot roughly 0.14 acres (dimensions approx. 155 x 118 x 110); Zoning: K- R1-6 Res (Single Family, 6000 sqft); Subdivision: Golden Gate Addition
Exterior
- Parking: Attached 2-car garage
- Utilities: Public water; Public sewer; Electricity available; Natural gas available
- Home design: Single-family residence; Residential property
- Construction: Shingle roof
- Exterior features: Block and chain link fencing; Paved road access
Interior
- Kitchen: Refrigerator included
- Bathrooms: Two full bathrooms
- Heating & cooling: Central heating (natural gas); Central electric cooling
- Interior features: Washer and dryer included; Refrigerator included; Water heater
- Laundry & utility: Washer and dryer; Water heater
Neighborhood map
What this means for you Summary
Snapshot
- This is a 3-bed/2.0-bath single-family listed at $190k.
Deal economics
- At list price, monthly cash flow is $88 ($1k/yr) — positive.
- The deal already cash-flows at list — no discount required.
- To meet the 1% rule (rent ≥ 1% of price), the offer needs to be $152k (19.8% below list).
- Recommended offer: $152k (19.8% below list) — sets the bar for 1% rule.
- Cap rate 6.9% vs local median 3.5% in Kingman — top-decile yield for the area; either an underpriced asset or a hidden risk that comps aren't pricing in. Stress-test before assuming the spread holds.
Location & tenants
- Location reads 79/100 on livability (#5 in AZ, #2,014 nationally) — a middle-class / working-renter tenant base. Strengths: commute A+, cost of living A+, housing A+; Watch: crime C-, employment C-, amenities F.
- Kingman Unified School District (79598) (town): math 19% / reading 24% proficiency, ranked #179 of 249 in AZ (top 72%) — low school quality limits family demand, transient renter base, plan for 1-2y turnover.
- Zoned schools: Desert Willow Elementary School (math 27% / reading 32%, grade F, #548 of 1,109 statewide, top 51%, 467 students, 75% FRL); Kingman Middle School (math 10% / reading 13%, grade F, #180 of 218 statewide, top 83%, 737 students, 74% FRL); Kingman High School (math 4% / reading 6%, grade F, #364 of 381 statewide, top 100%, 905 students, 50% FRL).
- Market conditions: Rents soft (-0.3%/yr); 969 active listings in the ZIP; 12 comparable units currently listed for rent nearby; rentals lingering (median 46d on market — plan ~5-8 weeks vacancy on turnover, expect pricing pressure); 58% of comp listings sitting > 30 days — soft ceiling on asking rent; 2,543 units permitted in Mohave County in 2024 (33 in 5+ unit buildings).
Forward outlook
- Local home prices are declining (-3.0%/yr); year-one equity from $1k of loan paydown is wiped out by about $6k of value loss. Plan a longer hold.
- Mohave County population projected to shrink 6% by 2050 — rents likely to lag national; underwrite the cash flow, not the appreciation.
Negotiation context
- It's been on market 16 days — a 2% lower offer ($187k) is reasonable based on typical stale-listing flexibility.
- 2 sale attempts since 5y ago; this cycle's ask has dropped $10k (5%) from the opening price — seller is motivated, your offer sets the floor, not the list.
- Current owner paid $120k; list at $190k implies a 58% gain — meaningful room to come down on a strong offer.
Risks & watch-outs
- Climate carrying-cost: major wildfire risk; extreme-heat days projected 7→17/yr by 2055 (HVAC capex compounding) — expect insurance premiums to compound above CPI over the hold.
Questions for the listing agent
- Is there a deadline driving the sale (1031 exchange, divorce, estate, relocation)? That informs how much negotiation room exists.
- Schools are D-rated, which usually means shorter tenancies and higher turnover. Who's the typical renter profile here, and what's been the actual vacancy rate?
- The area grade is low — what's the realistic commute time and amenity access for the typical tenant pool here? Any planned neighborhood developments (good or bad) we should know about?
- What's the average days-on-market for RENTAL listings here right now (not sales)? A rising rental-DOM trend means longer vacancies and softer asking-rent achievability than the comps imply.
- What's the recent tenant-quality profile in this submarket — average credit score on applications, eviction rate, late-payment / NSF rate, and stable-employment percentage? A property-management company in the area should have these aggregated.
- How much new for-sale + rental construction is in the pipeline within 1–3 miles? Heavy new supply typically softens prices + rents 12–24 months out; constrained supply supports both.
Investment metrics
- 1% rule
- 0.80% ✗
- Cap rate
- 6.85%
- Cash-on-cash
- 2.00%
- DSCR
- 1.09
- GRM
- 10.4
CMA / ARV
- ARV (on-the-fly)
- $213,444
- Comps found
- 12
Show comp detail 12 sales within ~0.75 mi
| Address | Dist | Beds/Ba | Sqft | Sold | Price | $/sf | Match |
|---|---|---|---|---|---|---|---|
| 1935 Lucille Ave | 0.29mi | 3/2.0 | 1,146 (+5%) | 3mo | $199,000 | $174 | 76 |
| 2524 Chambers Ave | 0.55mi | 3/2.0 | 1,066 (-2%) | 1mo | $220,000 | $206 | 70 |
| 1844 Golden Gate Ave | 0.55mi | 3/2.0 | 1,125 (+3%) | 0mo | $220,000 | $196 | 68 |
| 1965 Motor Ave | 0.58mi | 2/2.0 (-1) | 1,084 (-0%) | 0mo | $199,000 | $184 | 67 |
| 2617 Wickieup Ave | 0.66mi | 3/2.0 | 1,109 (+2%) | 2mo | $195,000 | $176 | 65 |
| 2640 Chambers Ave | 0.71mi | 3/2.0 | 1,077 (-1%) | 3mo | $210,000 | $195 | 62 |
| 1953 Club Ave | 0.50mi | 3/2.0 | 1,199 (+10%) | 2mo | $254,900 | $213 | 58 |
| 1927 Lucille Ave | 0.30mi | 2/2.0 (-1) | 1,236 (+14%) | 0mo | $225,000 | $182 | 58 |
| 1951 Motor Ave | 0.59mi | 2/2.0 (-1) | 1,027 (-6%) | 2mo | $210,000 | $204 | 56 |
| 2601 Chambers Ave | 0.62mi | 3/2.0 | 1,175 (+8%) | 2mo | $246,200 | $210 | 56 |
| 1741 Lucille Ave | 0.61mi | 3/2.0 | 1,187 (+9%) | 2mo | $253,900 | $214 | 55 |
| 1943 Hope Ave | 0.64mi | 3/1.0 | 1,004 (-8%) | 3mo | $190,000 | $189 | 51 |
Match score weights: distance 35% · size 25% · config 20% · recency 20%. Top-matched comps best support the ARV.
Projected returns pro-forma
-3.0% appreciation · 0.0% rent growth · sell at horizon
- IRR
- -16.1%
- Equity multiple
- 0.44×
- Total profit
- $-29,701
- Equity at exit
- $28,315
- IRR
- -13.2%
- Equity multiple
- 0.32×
- Total profit
- $-36,256
- Equity at exit
- $16,419
Cash invested: $53,172 (down + closing). Projections, not guarantees.
Landlord ↔ Tenant lean methodology
- Overall (STATE)
- 87 Strongly Landlord-Friendly
- State Arizona
- 87 Strongly Landlord-Friendly · R+3
- County
- — inherits STATE
- City
- — inherits STATE
ZIP-level market 86401
- Home prices YoY
- -33.8%
- Rents YoY
- -0.3%
- Active inventory
- 969
- Price-to-rent
- 10.4×
Monthly cashflow live
- Estimated rent
- $1,522 high interval (Pro) →
- Mortgage (P&I)
- −$996
- Tax from tax record
- −$39 /mo · $471/yr
- Insurance
- −$79
- HOA
- −$0
- Vacancy / Maint / Mgmt
- −$320
- Net cashflow
- $88
Break-even live
Sensitivity live
| Price | -10% $196 | -5% $142 | +0% $88 | +5% $35 | +10% $-19 |
|---|---|---|---|---|---|
| Rent | -10% $-32 | -5% $28 | +0% $88 | +5% $149 | +10% $209 |
| Rate | -1.0pp $184 | -0.5pp $137 | base $88 | +0.5pp $39 | +1.0pp $-11 |
UW: 25.0% down · 7.5% · 30yr · 1.5% tax · 5.0% vac · 8.0% maint · 8.0% mgmt
Financing live
Cash to close
- Down payment
- $47,475
- Closing costs
- $5,697
- Reserves months
- —
- Total cash needed
- —
Loan-product check · same deal, 3 products live
Conventional
25% down · 7.5% · 30yr
- Down + closing
- —
- Monthly P&I
- —
- Monthly cashflow
- —
- DSCR
- —
- Eligible?
- —
Personal DTI + credit; lowest rate.
DSCR
20% down · 8.5% · 30yr
- Down + closing
- —
- Monthly P&I
- —
- Monthly cashflow
- —
- DSCR
- —
- Eligible?
- —
No personal income docs; deal must DSCR.
Hard money
10% down · 12.0% · 12mo
- Down + closing
- —
- Monthly P&I
- —
- Monthly cashflow
- —
- DSCR
- —
- Eligible?
- —
Short-term bridge; refi at stabilization.
Rent comps 12 comps
| Address | Beds | Baths | Sqft | Rent | $/sqft | DOM | Units | Dist |
|---|---|---|---|---|---|---|---|---|
| 2021 Chambers Ave Kingman, AZ | 3.0 | 2.0 | 1454 | $1,500 | $1.03 | 45d | 1 | 0.08mi |
| 2201 Davis Ave Kingman, AZ | 3.0 | 1.0 | 1164 | $1,228 | $1.05 | 45d | 1 | 0.53mi |
| 2545 Kemp Ave Kingman, AZ | 3.0 | 2.0 | 1481 | $1,750 | $1.18 | 45d | 1 | 0.70mi |
| 2807 Louise Ave Kingman, AZ | 3.0 | 2.0 | 1140 | $1,275 | $1.12 | 15d | 1 | 0.89mi |
| 2820 Wikieup Ave Kingman, AZ | 3.0 | 2.0 | 1196 | $1,325 | $1.11 | 45d | 1 | 0.92mi |
| 1212 E Andy Devine Ave Kingman, AZ | 1.0–2.0 | 1.0–2.0 | 533 | $1,334 | $2.50 | 15d | 11 | 1.02mi |
| 1495 Franklin Dr Kingman, AZ | 3.0 | 2.0 | 1422 | $1,650 | $1.16 | 15d | 1 | 1.07mi |
| 1495 Franklin Dr Kingman, AZ | 3.0 | 2.0 | 1422 | $1,650 | $1.16 | 45d | 1 | 1.07mi |
| 915 E Berk Ave Kingman, AZ | 3.0 | 2.0 | 1175 | $1,495 | $1.27 | 45d | 1 | 1.41mi |
| 3050 Hualapai Mountain Rd Kingman, AZ | 2.0–3.0 | 1.0–2.0 | 873 | $1,550 | $1.78 | 15d | 17 | 1.42mi |
| 3097 Cherri Cir Kingman, AZ | 3.0 | 2.0 | 1446 | $1,498 | $1.04 | 45d | 1 | 1.42mi |
| 2469 Armour Ave Apt 2 Kingman, AZ | 2.0 | 2.0 | 830 | $1,224 | $1.47 | 23d | 1 | 1.45mi |
Listing history 13 events
-
2026-06-21days on market $189,900 Active 16 DOM
-
2026-06-18days on market $189,900 Active 13 DOM
-
2026-06-17days on market $189,900 Active 12 DOM
-
2026-06-16price $189,900 Active 11 DOM
-
2026-06-16days on market $199,900 Active 11 DOM
-
2026-06-15days on market $199,900 Active 10 DOM
-
2026-06-14days on market $199,900 Active 8 DOM
-
2026-06-13days on market $199,900 Active 7 DOM
-
2026-06-10days on market $199,900 Active 5 DOM
-
2026-06-09days on market $199,900 Active 4 DOM
-
2026-06-08days on market $199,900 Active 3 DOM
-
2026-06-07remarks 398-char remark
-
2026-06-07$199,900 Active 2 DOM
ⓘ Source: listings_history table (triggers on properties + properties_extension) + one-shot
backfill from property_details.listing_events for pre-trigger history.
Tax reassessment forecast AZ · Resets to sale price
- Current annual tax
- $471 · $39/mo
- Projected year-2 tax
- $1,253 · $104/mo
- Expected delta
- +$782/yr (+$65/mo · 165.8%)
ⓘ Screening estimate from a state-policy table — verify with the county assessor before closing.
Climate risk First Street
- Flood 1/10 Low FEMA zone X (unshaded) · 0% chance over 30 yrs
- Wildfire 7/10 Severe
- Heat 6/10 Major 7 d/yr ≥100°F today · 17 d/yr by 30 yrs out
- Wind 1/10 Low
- Air quality 1/10 Low 0 unhealthy d/yr today · 0 by 30 yrs out
Nearby sold comps map
Loading sold comps map…
Walkable amenities ~0.75 mi
Loading nearby amenities…
Taxation est. · year 1
- Rental income
- $18,269
- − Mortgage interest
- −$10,637
- − Property taxes
- −$471
- − Insurance
- −$950
- − Repairs & maintenance
- −$1,461
- − Management
- −$1,461
- − Depreciation
- −$5,524
- Taxable loss
- −$2,237
- Est. tax savings @ 24.0%
- +$537
- After-tax cash flow
- $1,598/yr
For passive investors: Depreciation is non-cash, so a rental often shows a tax loss while cash-flowing — sheltering income. Rental losses are passive: they offset passive income freely, and up to $25,000/yr can offset ordinary (W-2) income if you actively participate and your MAGI is under $100k (phasing out to $0 by $150k); unused losses carry forward. On sale, claimed depreciation is recaptured at up to 25%, and gains may owe capital-gains tax (a 1031 exchange can defer both). Figures are a year-1 estimate at your 24.0% rate — not tax advice; consult a CPA.
Schools (NCES district)
- District
- Kingman Unified School District (79598)
- NCES district ID
- 0400295
- Math proficiency
- 19% ▼ -11.00%
- Reading proficiency
- 24% ▼ -9.00%
- Median HH income
- $36,760
- Composite
- 17.87/100
- National rank
- #9002
- State rank
- #179 of 249 in AZ
Livability — Kingman
- Score
- 79/100
- State rank
- #5
- US rank
- #2014
Category grades
Schools grade is shown separately in the Schools card above.
Census & demographics
- Census place
- Kingman, AZ
- County
- Mohave County · 181,906 people
- City population
- 60,489
- Metro
- Lake Havasu City-Kingman, AZ
- Population (ZIP)
- 30,124
- Household income
- $66,129
- Rent vs Own
- Severe rent burden
- 985.0
Population outlook (Mohave County) Hauer SSP2
- Today (2025)
- 209,184 people
- By 2030
- 209,674 · +0.2%
- By 2040
- 205,897 · -1.6%
- By 2050
- 196,810 · -5.9%
- By 2075
- 169,454 · -19.0%
- By 2100
- 136,630 · -34.7%
Race, ethnicity, and origin ACS 2023
- Neighborhood character
- Predominantly White (76%)
- Race & ethnicity
- White 76% Hispanic / Latino 16% Two or more races 10% Asian 2% Black 1%
- Hispanic origin (detail)
- Mexican 13%
- Common ancestry
- Lithuanian 4% Slovak 2% Portuguese 2%
- Foreign-born
- 5% · Canada
- Languages at home
- 92% English-only · Spanish 6% Other Asian/Pacific 1% Other Indo-European 1%
Political lean MEDSL · Mohave
- 2024 margin
- Solid R (+55.8) · D 21.8% · R 77.6%
- 2008→2024 swing
- -22.9pp toward R · 2008: -32.9pp · 2024: -55.8pp
- All cycles
- 2024: R+55.8 2020: R+51.3 2016: R+51.5 2012: R+42.6 2008: R+32.9
Not yet ingested
- Civics
- —
Market trends
- HPI YoY
- ▼ -128.30%
- Current HPI
- 251.8208
- Rent YoY
- ▼ -0.28%
- Metro
- Lake Havasu City-Kingman, AZ
- State GDP YoY
- ▲ 4.54%
- F500 in state
- 20
Industry mix (Fortune 500 HQ in AZ)
| Industry | F500 HQs | Revenue |
|---|---|---|
| Technology | 2 | $13B |
|
||
| Mining / Metals | 1 | $23B |
|
||
| Environmental Services | 1 | $16B |
|
||
| Metals / Steel | 1 | $14B |
|
||
| Technology Distribution | 1 | $9B |
|
||
| Homebuilding | 1 | $8B |
|
||
Price history
+364.9% since first listed5 events — show timeline
- 2026-06-05 Listed $199,900 WARDEX
- 2021-08-30 Listed $180,000 WARDEX
- 2005-07-11 Sold (Public Records) $120,000 Public Records
- 2001-04-10 Sold (Public Records) $50,000 Public Records
- 1987-01-14 Sold (Public Records) $43,000 Public Records
Property tax history
+0.7%/yrLatest (2025): $471 · -0.2% YoY. Source: county tax records.
Cash-flow waterfall
monthlySold comps — $/sqft
last 12 mo · ≤1 miLoading sold comps…