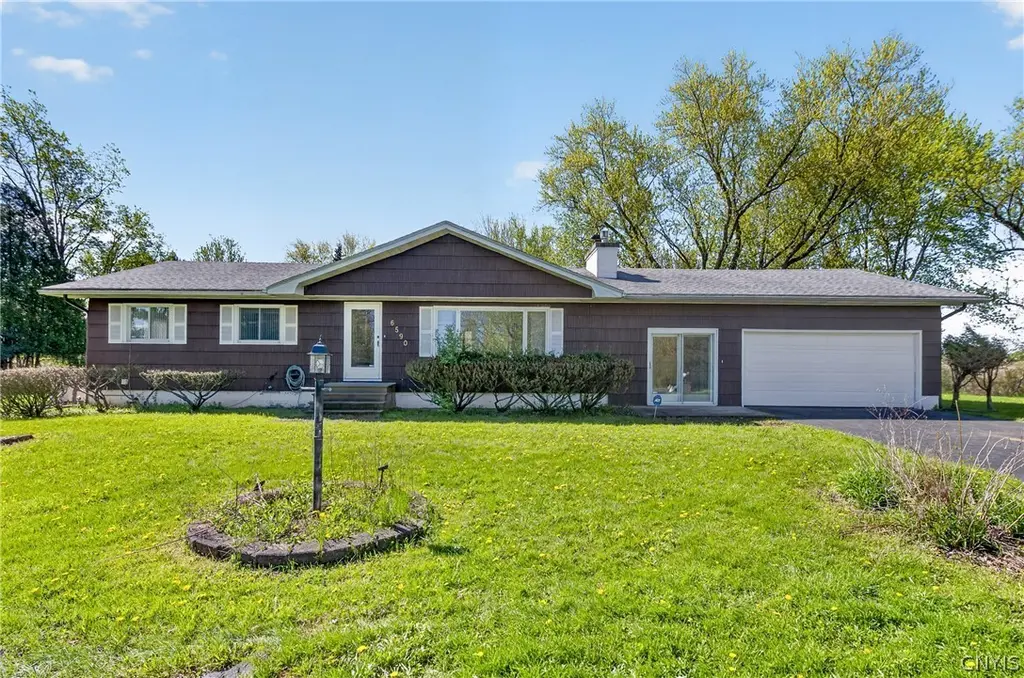
6590 Badgley Rd · East Syracuse, NY
Flood risk 1/10 · Minimal
- FEMA flood zone
- X (unshaded)
- Chance of flooding over 30 yrs
- 0.0%
- Est. flood insurance / yr
- $473 – $860
Fire risk 3/10 · Minor
- Est. fire insurance / yr
- $691 – $1,283
Heat risk 3/10 · Minor
- Hot days now (above 95°F)
- 7 days/yr
- Hot days in 30 yrs
- 15 days/yr
Wind risk 1/10 · Minimal
- Chance of severe wind over 30 yrs
- 1.0%
Air-quality risk 2/10 · Minimal
- Unhealthy air days now
- 0 days/yr
- Unhealthy air days in 30 yrs
- 1 days/yr
Risk factors via First Street. Map © Google.
Why this score? — see what drove the D+ grade
The composite is a weighted blend of 9 inputs, each scored 0–100. Each bar is that input's sub-score; the figure is the points it added to the 100-point composite (weight × sub-score).
- ARV discount +14.5/15.0
- Cash flow +13.2/30.0
- Livability +4.5/5.0
- Schools +4.3/10.0
- DSCR +4.0/10.0
- 1% rule +3.8/10.0
- Rent growth +2.5/5.0
- Condition / age +2.5/5.0
- Appreciation +0.0/10.0
$249,000
🖨 Deal sheet (PDF) 📄 Offer letter ✓ Due diligence
Listing remarks
Welcome to 6590 Badgley Road in East Syracuse, located in the highly regarded East Syracuse-Minoa School District. Set on 1.26 private acres, this well-maintained 1,568 SF ranch offers comfortable one-level living with 3 spacious bedrooms, 2 full bathrooms, and a 2-car attached garage. A charming circular-style driveway, mature trees, and expansive front and backyard create a peaceful, inviting setting from the moment you arrive. Inside, the living room is anchored by a striking floor-to-ceiling stone fireplace and filled with natural light. Original hardwood floors are believed to extend beneath the carpeting in the living room and bedrooms, offering an opportunity to enhance the home&rsqu
Key facts
- Private acres
- Backyard patio
- Full basement
Tags
Property features AI
Exterior
- Parking: Attached 2-car garage; Garage door opener; Circular driveway and driveway
- Utilities: Electricity available; High-speed internet available; Public water connected; Septic tank sewer
- Home design: Single-story home; Resale property; Cedar and wood siding exterior; Asphalt shingle roof
- Construction: Built as existing (year not specified); Block foundation
- Exterior features: Patio; Blacktop driveway; Shed(s) and storage
Interior
- Kitchen: Dishwasher; Electric oven; Electric range; Refrigerator
- Bedrooms: Three main-level bedrooms
- Flooring: Carpet; Hardwood; Laminate; Varies
- Bathrooms: Two full bathrooms (both on the main level)
- Heating & cooling: Central air conditioning; Electric and gas heating; Forced air and hot water heating
- Interior features: Breakfast bar; Ceiling fan(s); Separate/formal dining room; Entrance foyer; Separate/formal living room; Sliding glass door(s); Window treatments; Drapes; Sliding doors
- Laundry & utility: Washer and dryer located in the basement; Sump pump; Generator
Neighborhood map
What this means for you Summary
Snapshot
- This is a 3-bed/1.5-bath single-family listed at $249k.
Deal economics
- At list price, monthly cash flow is $-6 ($-67/yr) — negative.
- To cash-flow at today's rent, offer at most $248k (0.4% below list).
- To meet the 1% rule (rent ≥ 1% of price), the offer needs to be $218k (12.5% below list).
- Recommended offer: $218k (12.5% below list) — sets the bar for 1% rule.
Location & tenants
- Location reads 90/100 on livability (#4 in NY, #81 nationally) — a professional / high-income tenant draw. Strengths: amenities A+, commute A+, cost of living A+.
- East Syracuse Minoa Central School District (rural): math 46% / reading 53% proficiency, ranked #379 of 590 in NY (top 64%) — families likely to look elsewhere, expect single-tenant / working-renter base with shorter leases.
- Zoned schools: Woodland Elementary School (math 52% / reading 62%, grade C+, #842 of 2,108 statewide, top 43%, 291 students, 82% FRL); Pine Grove Middle School (math 29% / reading 49%, grade F, #433 of 729 statewide, top 60%, 672 students, 43% FRL); East Syracuse Minoa Central High School (math 97% / reading 87%, grade A+, #171 of 1,100 statewide, top 18%, 1,183 students, 60% FRL) — zoned schools average 62% FRL vs 29% district-wide (33 pts higher); higher-poverty schools than district average — tighter screening recommended.
- Zoned-school proficiency averages 63% at this address vs 50% district-wide (+13 pts) — the actual schools serving this property are materially stronger than the East Syracuse Minoa Central School District average implies; a family-tenant draw the district grade alone would hide.
- Market conditions: 59 active listings in the ZIP; solid renter incomes; 616 units permitted in Onondaga County in 2024 (256 in 5+ unit buildings).
- This rent runs 32% of the median local income ($81k/yr) — at the standard rent-burdened threshold; future hikes will face affordability resistance.
Forward outlook
- Local home prices are declining (-3.0%/yr); year-one equity from $2k of loan paydown is wiped out by about $7k of value loss. Plan a longer hold.
- Onondaga County population projected to shrink 9% by 2050 — rents likely to lag national; underwrite the cash flow, not the appreciation.
Negotiation context
- Only 5 days on market — expect competitive offers; lowballing is unlikely to land.
Questions for the listing agent
- What do current leases actually rent for vs. the listed asking? Can we see a recent rent roll and the last 12 months of T-12 income?
- Built in 1960 — when were the roof, HVAC, electrical panel, plumbing, and water heater last replaced?
- Is there a deadline driving the sale (1031 exchange, divorce, estate, relocation)? That informs how much negotiation room exists.
- Schools are D-rated, which usually means shorter tenancies and higher turnover. Who's the typical renter profile here, and what's been the actual vacancy rate?
- The area grade is low — what's the realistic commute time and amenity access for the typical tenant pool here? Any planned neighborhood developments (good or bad) we should know about?
- What's the average days-on-market for RENTAL listings here right now (not sales)? A rising rental-DOM trend means longer vacancies and softer asking-rent achievability than the comps imply.
- What's the recent tenant-quality profile in this submarket — average credit score on applications, eviction rate, late-payment / NSF rate, and stable-employment percentage? A property-management company in the area should have these aggregated.
- How much new for-sale + rental construction is in the pipeline within 1–3 miles? Heavy new supply typically softens prices + rents 12–24 months out; constrained supply supports both.
Investment metrics
- 1% rule
- 0.88% ✗
- Cap rate
- 6.27%
- Cash-on-cash
- -0.10%
- DSCR
- 1.00
- GRM
- 9.5
CMA / ARV
- ARV (on-the-fly)
- $294,784
- Comps found
- 1
Show comp detail 1 sale within ~0.75 mi
| Address | Dist | Beds/Ba | Sqft | Sold | Price | $/sf | Match |
|---|---|---|---|---|---|---|---|
| 6634 Collamer Rd | 0.49mi | 3/2.0 | 1,380 (-12%) | 6mo | $260,000 | $188 | 50 |
Match score weights: distance 35% · size 25% · config 20% · recency 20%. Top-matched comps best support the ARV.
Projected returns pro-forma
-3.0% appreciation · 3.0% rent growth · sell at horizon
- IRR
- -16.4%
- Equity multiple
- 0.42×
- Total profit
- $-40,668
- Equity at exit
- $37,127
- IRR
- -8.2%
- Equity multiple
- 0.49×
- Total profit
- $-35,723
- Equity at exit
- $21,529
Cash invested: $69,720 (down + closing). Projections, not guarantees.
Landlord ↔ Tenant lean methodology
- Overall (STATE)
- 15 Strongly Tenant-Friendly
- State New York
- 15 Strongly Tenant-Friendly · D+10
- County
- — inherits STATE
- City
- — inherits STATE
ZIP-level market 13057
- Home prices YoY
- -11.1%
- Active inventory
- 59
- Price-to-rent
- 9.5×
Monthly cashflow live
- Estimated rent
- $2,179 medium interval (Pro) →
- Mortgage (P&I)
- −$1,306
- Tax from tax record
- −$317 /mo · $3,809/yr
- Insurance
- −$104
- HOA
- −$0
- Vacancy / Maint / Mgmt
- −$458
- Net cashflow
- $-6
Break-even live
Sensitivity live
| Price | -10% $135 | -5% $65 | +0% $-6 | +5% $-76 | +10% $-147 |
|---|---|---|---|---|---|
| Rent | -10% $-178 | -5% $-92 | +0% $-6 | +5% $80 | +10% $167 |
| Rate | -1.0pp $120 | -0.5pp $58 | base $-6 | +0.5pp $-70 | +1.0pp $-136 |
UW: 25.0% down · 7.5% · 30yr · 1.5% tax · 5.0% vac · 8.0% maint · 8.0% mgmt
Financing live
Cash to close
- Down payment
- $62,250
- Closing costs
- $7,470
- Reserves months
- —
- Total cash needed
- —
Loan-product check · same deal, 3 products live
Conventional
25% down · 7.5% · 30yr
- Down + closing
- —
- Monthly P&I
- —
- Monthly cashflow
- —
- DSCR
- —
- Eligible?
- —
Personal DTI + credit; lowest rate.
DSCR
20% down · 8.5% · 30yr
- Down + closing
- —
- Monthly P&I
- —
- Monthly cashflow
- —
- DSCR
- —
- Eligible?
- —
No personal income docs; deal must DSCR.
Hard money
10% down · 12.0% · 12mo
- Down + closing
- —
- Monthly P&I
- —
- Monthly cashflow
- —
- DSCR
- —
- Eligible?
- —
Short-term bridge; refi at stabilization.
Listing history 3 events
-
2026-05-15status Pending
-
2026-05-13historical Active Under Contract
-
2026-05-09$249,000 Active
ⓘ Source: listings_history table (triggers on properties + properties_extension) + one-shot
backfill from property_details.listing_events for pre-trigger history.
Tax reassessment forecast NY · Partial reset (capped growth)
- Current annual tax
- $3,809 · $317/mo
- Projected year-2 tax
- $4,008 · $334/mo
- Expected delta
- +$200/yr (+$17/mo · 5.2%)
ⓘ Screening estimate from a state-policy table — verify with the county assessor before closing.
Climate risk First Street
- Flood 1/10 Low FEMA zone X (unshaded) · 0% chance over 30 yrs
- Wildfire 3/10 Moderate
- Heat 3/10 Moderate 7 d/yr ≥95°F today · 15 d/yr by 30 yrs out
- Wind 1/10 Low 100% chance of damaging wind over 30 yrs
- Air quality 2/10 Low 0 unhealthy d/yr today · 1 by 30 yrs out
Nearby sold comps map
Loading sold comps map…
Walkable amenities ~0.75 mi
Loading nearby amenities…
Taxation est. · year 1
- Rental income
- $26,147
- − Mortgage interest
- −$13,948
- − Property taxes
- −$3,809
- − Insurance
- −$1,245
- − Repairs & maintenance
- −$2,092
- − Management
- −$2,092
- − Depreciation
- −$7,244
- Taxable loss
- −$4,282
- Est. tax savings @ 24.0%
- +$1,028
- After-tax cash flow
- $961/yr
For passive investors: Depreciation is non-cash, so a rental often shows a tax loss while cash-flowing — sheltering income. Rental losses are passive: they offset passive income freely, and up to $25,000/yr can offset ordinary (W-2) income if you actively participate and your MAGI is under $100k (phasing out to $0 by $150k); unused losses carry forward. On sale, claimed depreciation is recaptured at up to 25%, and gains may owe capital-gains tax (a 1031 exchange can defer both). Figures are a year-1 estimate at your 24.0% rate — not tax advice; consult a CPA.
Schools (NCES district)
- District
- East Syracuse Minoa Central School District
- NCES district ID
- 3609990
- Math proficiency
- 46% ▼ -6.00%
- Reading proficiency
- 53% ▲ 9.00%
- Median HH income
- $55,801
- Composite
- 42.9/100
- National rank
- #3122
- State rank
- #379 of 590 in NY
Livability — East Syracuse
- Score
- 90/100
- State rank
- #4
- US rank
- #81
Category grades
Schools grade is shown separately in the Schools card above.
Census & demographics
- County
- Onondaga County · 247,257 people
- City population
- 14,253
- Metro
- Syracuse, NY
- Population (ZIP)
- 14,253
- Household income
- $80,900
- Rent vs Own
- Severe rent burden
- 250.0
Population outlook (Onondaga County) Hauer SSP2
- Today (2025)
- 467,894 people
- By 2030
- 463,381 · -1.0%
- By 2040
- 447,697 · -4.3%
- By 2050
- 426,399 · -8.9%
- By 2075
- 373,661 · -20.1%
- By 2100
- 307,967 · -34.2%
Race, ethnicity, and origin ACS 2023
- Neighborhood character
- Predominantly White (88%)
- Race & ethnicity
- White 88% Two or more races 5% Hispanic / Latino 3% Asian 2% Black 2%
- Common ancestry
- Romanian 5% Lithuanian 4% American 3%
- Foreign-born
- 6% · Canada, Vietnam
- Languages at home
- 92% English-only · Russian/Polish/Slavic 3% Spanish 1% Other Indo-European 1%
Political lean MEDSL · Onondaga
- 2024 margin
- D (+17.3) · D 58.6% · R 41.4%
- 2008→2024 swing
- -3.0pp toward R · 2008: 20.3pp · 2024: 17.3pp
- All cycles
- 2024: D+17.3 2020: D+20.6 2016: D+12.8 2012: D+21.1 2008: D+20.3
Not yet ingested
- Civics
- —
Market trends
- HPI YoY
- ▼ -39.50%
- Current HPI
- 316.8595
- Rent YoY
- —
- Metro
- Syracuse, NY
- State GDP YoY
- ▲ 2.60%
- F500 in state
- 92
Industry mix (Fortune 500 HQ in NY)
| Industry | F500 HQs | Revenue |
|---|---|---|
| Financial Services | 10 | $950B |
|
||
| Consumer Goods | 9 | $162B |
|
||
| Insurance | 4 | $225B |
|
||
| Telecommunications | 2 | $144B |
|
||
| Pharmaceuticals | 2 | $112B |
|
||
| Media / Entertainment | 2 | $69B |
|
||
Price history
3 events — show timeline
- 2026-05-15 Pending — CNYIS
- 2026-05-13 Contingent — CNYIS
- 2026-05-09 Listed $249,000 CNYIS
Property tax history
+23.8%/yrLatest (2025): $3,809 · +7.3% YoY. Source: county tax records.
Cash-flow waterfall
monthlySold comps — $/sqft
last 12 mo · ≤1 miLoading sold comps…