 11-Plex
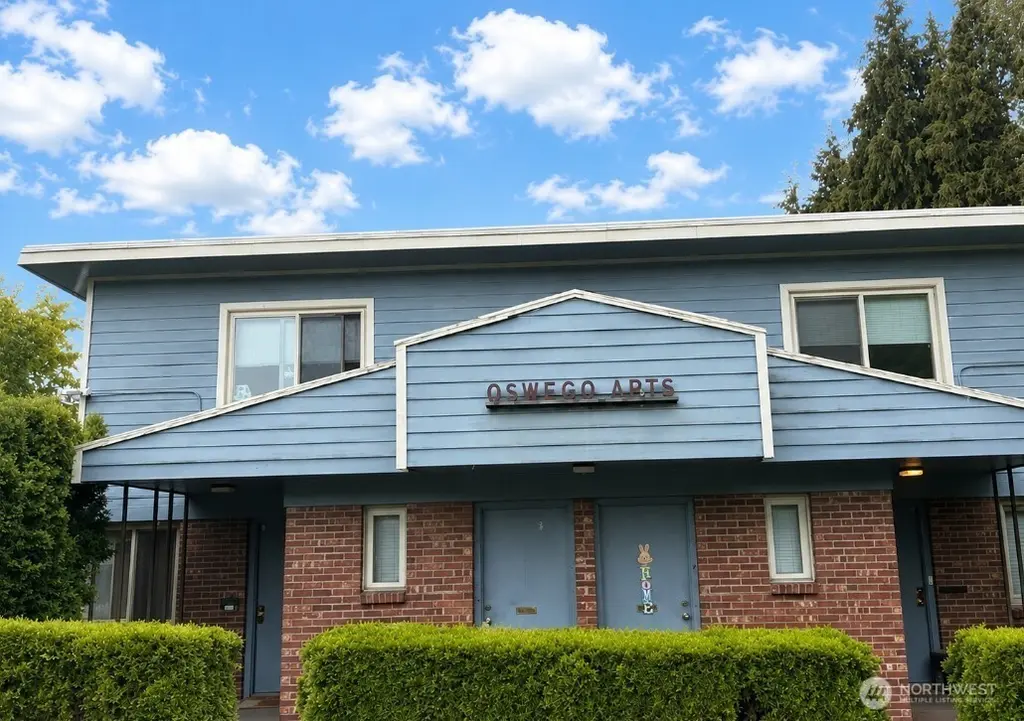
6537 Oswego Pl NE · Seattle, WA
Flood risk 7/10 · Major
- FEMA flood zone
- X (unshaded)
- Chance of flooding over 30 yrs
- 0.78%
- Est. flood insurance / yr
- $507 – $1,088
Fire risk 1/10 · Minimal
- Est. fire insurance / yr
- $604 – $1,122
Heat risk 3/10 · Minor
- Hot days now (above 86°F)
- 7 days/yr
- Hot days in 30 yrs
- 15 days/yr
Wind risk 1/10 · Minimal
- Chance of severe wind over 30 yrs
- —
Air-quality risk 7/10 · Major
- Unhealthy air days now
- 10 days/yr
- Unhealthy air days in 30 yrs
- 11 days/yr
Risk factors via First Street. Map © Google.
Why this score? — see what drove the C+ grade
The composite is a weighted blend of 9 inputs, each scored 0–100. Each bar is that input's sub-score; the figure is the points it added to the 100-point composite (weight × sub-score).
- Cash flow +26.2/30.0
- DSCR +8.8/10.0
- ARV discount +7.5/15.0
- 1% rule +6.2/10.0
- Schools +6.1/10.0
- Livability +3.8/5.0
- Rent growth +2.9/5.0
- Condition / age +2.5/5.0
- Appreciation +0.0/10.0
$2,600,000
🖨 Deal sheet 📄 Offer letter ✓ Due diligence
Multi-family units
County records classify this as Multi-Family (5+ Unit). Listing-text estimate: 11 units. confirmed
5+ unit building — per-unit beds/baths from public records are typically unavailable; the breakdown below (if shown) is an estimate from the listing text.
Listing remarks
Exceptional investment opportunity just minutes from Green Lake. This well-maintained 11-unit apartment building features a desirable unit mix of nine studios and two one-bedroom units. Professional management is already in place and available to continue operations, offering a seamless transition for a passive investor. The property is zoned LR3 (RC), providing attractive future development potential. Amenities include off-street parking, storage lockers, coin-operated laundry, and individual water heaters for each unit, all replaced in 2023. Five of the eleven units have been remodeled. Ideally located within walking distance of the Roosevelt Light Rail Station, and the Green Lake Park &
Key facts
- Zoned lr3
- Off-street parking
- Storage lockers
Tags
Property features AI
Finance
- Financial info: Listing terms: Cash or Conventional; Total units in building: 11; Calculated building area: 4,643; Gross scheduled income: $158,612; Gross adjusted income: $158,612; Total monthly income: $13,218; Total expenses: $54,427; Net operating income: $104,185; Electric expense: $797; Insurance expense: $5,001; Other expense: $21,573; Gross rent multiplier: 16; Individual unit rents range (examples): $1,020–$1,455
Exterior
- Parking: Seven uncovered parking spaces
- Security: Partially fenced property
- Utilities: Geothermal energy source; Water service: SPU; Sewer connected (SPU); Power: Seattle City Light
- Home design: Multi-family residential income property; Multi-family (10+ units) style; Two stories; Good condition
- Construction: Brick and cement plank construction; Composition and torch-down roofing; Poured concrete foundation; Effective year built 1993
- Exterior features: Brick and cement-plank exterior; Partially fenced site; Cable TV and high-speed internet available; Curbs, paved surfaces, sidewalks, located on a dead-end street
Interior
- Kitchen: Range/oven in each unit; Refrigerator in each unit
- Bedrooms: One 1-bedroom unit (Unit 9); One 1-bedroom unit (Unit 10); Other units are studio/efficiency (units 1–8 listed by unit number)
- Flooring: Hardwood; Carpet
- Bathrooms: All listed units have one bathroom
- Heating & cooling: Wall furnace heating; No central cooling
- Interior features: Hardwood and carpet flooring; Basement; Thermal windows; Partially fenced
- Laundry & utility: Coin-operated laundry
Neighborhood map
What this means for you Summary
Snapshot
- This is a 11 × 3-bed/11.0-bath units multifamily listed at $2.60M.
Deal economics
- At list price, monthly cash flow is $7k ($78k/yr) — positive. Per door: $594/mo.
- The deal already cash-flows at list — no discount required.
- Meets the 1% rule at list price ($29k rent vs $2.60M).
- Cap rate 9.3% vs local median 1.6% in Seattle — top-decile yield for the area; either an underpriced asset or a hidden risk that comps aren't pricing in. Stress-test before assuming the spread holds.
Location & tenants
- Location reads 75/100 on livability (#166 in WA, #4,033 nationally) — a middle-class / working-renter tenant base. Strengths: amenities A+, commute A+, employment A+; Watch: crime F, cost of living F.
- Seattle Public Schools (urban): math 64% / reading 72% proficiency, ranked #19 of 291 in WA (top 6%) — acceptable for families but not a draw, mixed tenant base, ~2y average lease.
- Zoned schools: Green Lake Elementary School (328 students, 23% FRL); Roosevelt High School (1,541 students, 15% FRL).
- Market conditions: Rents rising (+1.7%/yr); 288 active listings in the ZIP; high-income renter base; 10,555 units permitted in King County in 2024 (7,119 in 5+ unit buildings).
- At $29,217/mo this rent would consume 225% of the median local household income ($156k/yr) (locally 2019% of renters already pay >50% of income on rent) — very limited rent-growth headroom before tenants either downsize or default.
Forward outlook
- Local home prices are declining (-3.0%/yr); year-one equity from $18k of loan paydown is wiped out by about $78k of value loss. Plan a longer hold.
- King County population projected at +44% by 2050 — long-run rental-demand tailwind backs the buy-and-hold thesis.
Negotiation context
- Only 8 days on market — expect competitive offers; lowballing is unlikely to land.
- 5 sale attempts since 20y ago with the ask held roughly flat each time — persistent listings suggest the price (not the market) is what's stuck; bring a comps-based counter.
Risks & watch-outs
- Watch-outs: flood insurance adds $66/mo; built in 1950 — expect roof / HVAC / electrical / plumbing capex.
- Climate carrying-cost: major flood risk — expect insurance premiums to compound above CPI over the hold.
Questions for the listing agent
- Can we see the unit-by-unit rent roll, current vacancy, and any below-market leases? What's the average tenancy length?
- What capital expenditures (roof, boiler, parking lot, exteriors) have been made in the last 5 years, and what's planned in the next 2?
- Built in 1950 — when were the roof, HVAC, electrical panel, plumbing, and water heater last replaced?
- What's the actual annual flood-insurance premium (NFIP or private), and is the property in a SFHA with mandatory coverage?
- Is there a deadline driving the sale (1031 exchange, divorce, estate, relocation)? That informs how much negotiation room exists.
- Schools are A-rated — typically a magnet for longer-tenancy family renters. What's the average tenant stay here, and is there a school-zone premium baked into asking?
- Crime grade is F in this area — have there been break-ins, vandalism, or insurance claims at this property in the last 3 years? What carrier currently insures it and at what premium?
- What's the average days-on-market for RENTAL listings here right now (not sales)? A rising rental-DOM trend means longer vacancies and softer asking-rent achievability than the comps imply.
- What's the recent tenant-quality profile in this submarket — average credit score on applications, eviction rate, late-payment / NSF rate, and stable-employment percentage? A property-management company in the area should have these aggregated.
- How much new apartment / multifamily construction is in the pipeline within 1–3 miles? Heavy new supply (>2% of stock underway) typically softens rents 12–24 months out; light construction supports rent growth.
Investment metrics
- 1% rule
- 1.12% ✓
- Cap rate
- 9.34%
- Cash-on-cash
- 10.87%
- DSCR
- 1.48
- GRM
- 7.4
CMA / ARV
No comps found within radius.
Projected returns pro-forma
-3.0% appreciation · 1.73% rent growth · sell at horizon
- IRR
- -1.6%
- Equity multiple
- 0.94×
- Total profit
- $-42,683
- Equity at exit
- $387,668
- IRR
- 6.8%
- Equity multiple
- 1.48×
- Total profit
- $349,189
- Equity at exit
- $224,800
Cash invested: $728,000 (down + closing). Projections, not guarantees.
Landlord ↔ Tenant lean methodology
- Overall (CITY)
- 0 Strongly Tenant-Friendly
- State Washington
- 28 Tenant-Leaning · D+8
- County
- — inherits STATE
- City Seattle
- 0 Strongly Tenant-Friendly · D+52
ZIP-level market 98115
- Rents YoY
- 1.7%
- Active inventory
- 288
- Price-to-rent
- 81.6×
Monthly cashflow live
- Estimated rent
- $29,217 high interval (Pro) →
- Mortgage (P&I)
- −$13,635
- Tax from tax record
- −$1,766 /mo · $21,198/yr
- Insurance
- −$1,083
- Flood insurance flood zone
- −$66 /mo · $798/yr
- HOA
- −$0
- Vacancy / Maint / Mgmt
- −$6,136
- Net cashflow
- $6,530
Break-even live
11-unit breakdown (identical units grouped — click to expand)
| Units | Beds | Baths | Est. rent |
|---|---|---|---|
| 11× units | 3 | 11 | $29,216 |
| #1 | 3 | 11 | $2,656 |
| #2 | 3 | 11 | $2,656 |
| #3 | 3 | 11 | $2,656 |
| #4 | 3 | 11 | $2,656 |
| #5 | 3 | 11 | $2,656 |
| #6 | 3 | 11 | $2,656 |
| #7 | 3 | 11 | $2,656 |
| #8 | 3 | 11 | $2,656 |
| #9 | 3 | 11 | $2,656 |
| #10 | 3 | 11 | $2,656 |
| #11 | 3 | 11 | $2,656 |
| Total (11 units) | $29,217 | ||
UW: 25.0% down · 7.5% · 30yr · 1.5% tax · 5.0% vac · 8.0% maint · 8.0% mgmt
Financing live
Cash to close
- Down payment
- $650,000
- Closing costs
- $78,000
- Reserves months
- —
- Total cash needed
- —
Loan-product check · same deal, 3 products live
Conventional
25% down · 7.5% · 30yr
- Down + closing
- —
- Monthly P&I
- —
- Monthly cashflow
- —
- DSCR
- —
- Eligible?
- —
Personal DTI + credit; lowest rate.
DSCR
20% down · 8.5% · 30yr
- Down + closing
- —
- Monthly P&I
- —
- Monthly cashflow
- —
- DSCR
- —
- Eligible?
- —
No personal income docs; deal must DSCR.
Hard money
10% down · 12.0% · 12mo
- Down + closing
- —
- Monthly P&I
- —
- Monthly cashflow
- —
- DSCR
- —
- Eligible?
- —
Short-term bridge; refi at stabilization.
Listing history 9 events
-
2026-06-19days on market $2,600,000 Active 8 DOM
-
2026-06-18days on market $2,600,000 Active 7 DOM
-
2026-06-17days on market $2,600,000 Active 6 DOM
-
2026-06-16days on market $2,600,000 Active 5 DOM
-
2026-06-15days on market $2,600,000 Active 4 DOM
-
2026-06-15days on market $2,600,000 Active 3 DOM
-
2026-06-13days on market $2,600,000 Active 2 DOM
-
2026-06-12remarks 699-char remark
-
2026-06-12$2,600,000 Active 1 DOM
ⓘ Source: listings_history table (triggers on properties + properties_extension) + one-shot
backfill from property_details.listing_events for pre-trigger history.
Tax reassessment forecast WA · Resets to sale price
- Current annual tax
- $21,198 · $1,766/mo
- Projected year-2 tax
- $25,480 · $2,123/mo
- Expected delta
- +$4,282/yr (+$357/mo · 20.2%)
ⓘ Screening estimate from a state-policy table — verify with the county assessor before closing.
Climate risk First Street
- Flood 7/10 Severe FEMA zone X (unshaded) · 78% chance over 30 yrs
- Wildfire 1/10 Low
- Heat 3/10 Moderate 7 d/yr ≥86°F today · 15 d/yr by 30 yrs out
- Wind 1/10 Low
- Air quality 7/10 Severe 10 unhealthy d/yr today · 11 by 30 yrs out
Nearby sold comps map
Loading sold comps map…
Walkable amenities ~0.75 mi
Loading nearby amenities…
Taxation est. · year 1
- Rental income
- $350,604
- − Mortgage interest
- −$145,640
- − Property taxes
- −$21,198
- − Insurance
- −$13,797
- − Repairs & maintenance
- −$28,048
- − Management
- −$28,048
- − Depreciation
- −$75,636
- Taxable income
- $38,235
- Est. tax owed @ 24.0%
- −$9,176
- After-tax cash flow
- $69,189/yr
For passive investors: Depreciation is non-cash, so a rental often shows a tax loss while cash-flowing — sheltering income. Rental losses are passive: they offset passive income freely, and up to $25,000/yr can offset ordinary (W-2) income if you actively participate and your MAGI is under $100k (phasing out to $0 by $150k); unused losses carry forward. On sale, claimed depreciation is recaptured at up to 25%, and gains may owe capital-gains tax (a 1031 exchange can defer both). Figures are a year-1 estimate at your 24.0% rate — not tax advice; consult a CPA.
Schools (NCES district)
- District
- Seattle Public Schools
- NCES district ID
- 5307710
- Math proficiency
- 64% ▼ -1.00%
- Reading proficiency
- 72% ▬ 0.00%
- Median HH income
- $68,695
- Composite
- 60.76/100
- National rank
- #1649
- State rank
- #19 of 291 in WA
Livability — Seattle
- Score
- 75/100
- State rank
- #166
- US rank
- #4033
Category grades
Schools grade is shown separately in the Schools card above.
Census & demographics
- Census place
- Seattle, WA
- County
- King County · 2,251,916 people
- City population
- 706,262
- Metro
- Seattle-Tacoma-Bellevue, WA
- Population (ZIP)
- 54,349
- Household income
- $156,142
- Rent vs Own
- Severe rent burden
- 2019.0
Population outlook (King County) Hauer SSP2
- Today (2025)
- 2,576,485 people
- By 2030
- 2,803,316 · +8.8%
- By 2040
- 3,255,921 · +26.4%
- By 2050
- 3,706,444 · +43.9%
- By 2075
- 4,746,063 · +84.2%
- By 2100
- 5,407,730 · +109.9%
Race, ethnicity, and origin ACS 2023
- Neighborhood character
- Predominantly White (73%)
- Race & ethnicity
- White 73% Asian 13% Two or more races 9% Hispanic / Latino 5% Black 2%
- Hispanic origin (detail)
- Mexican 3%
- Common ancestry
- Italian 5% Portuguese 4% Slovak 3%
- Foreign-born
- 13% · China, Canada, South Korea
- Languages at home
- 85% English-only · Chinese 5% Spanish 3% Other Indo-European 3%
Political lean MEDSL · King
- 2024 margin
- Solid D (+51.7) · D 74.2% · R 22.5% · Other 3.4%
- 2008→2024 swing
- +9.6pp toward D · 2008: 42.1pp · 2024: 51.7pp
- All cycles
- 2024: D+51.7 2020: D+52.7 2016: D+50.4 2012: D+39.9 2008: D+42.1
Not yet ingested
- Civics
- —
Market trends
- HPI YoY
- ▼ -1449.87%
- Current HPI
- 331.4729
- Rent YoY
- ▲ 1.73%
- Metro
- Seattle-Tacoma-Bellevue, WA
- State GDP YoY
- ▲ 4.65%
- F500 in state
- 22
Industry mix (Fortune 500 HQ in WA)
| Industry | F500 HQs | Revenue |
|---|---|---|
| Retail | 2 | $269B |
|
||
| Technology / Retail | 1 | $638B |
|
||
| Technology | 1 | $245B |
|
||
| Telecommunications | 1 | $38B |
|
||
| Food / Beverage | 1 | $36B |
|
||
| Automotive / Trucks | 1 | $34B |
|
||
Price history
+477.8% since first listed17 events — show timeline
- 2026-06-11 Listed $2,600,000 NWMLS as Distributed by MLS Grid
- 2024-09-01 Rental Removed $1,095 APPFOLIO
- 2024-08-29 Listed for Rent $1,095 APPFOLIO
- 2023-08-29 Rental Removed $1,345 APPFOLIO
- 2023-08-02 Listed for Rent $1,345 APPFOLIO
- 2022-07-04 Price Changed $1,345 APPFOLIO
- 2018-04-20 Sold (Public Records) $2,360,000 Public Records
- 2018-04-20 Sold (MLS) $2,360,000 NWMLS as Distributed by MLS Grid
- 2018-02-27 Pending — NWMLS as Distributed by MLS Grid
- 2018-02-22 Pending — NWMLS as Distributed by MLS Grid
- 2017-12-07 Listed $2,400,000 NWMLS as Distributed by MLS Grid
- 2016-05-10 Sold (Public Records) $1,893,800 Public Records
- 2006-05-19 Sold (MLS) $1,035,000 NWMLS as Distributed by MLS Grid
- 2006-03-17 Delisted — NWMLS as Distributed by MLS Grid
- 2006-03-08 Listed $1,025,000 NWMLS as Distributed by MLS Grid
- 2003-09-02 Sold (Public Records) $689,000 Public Records
- 1995-11-15 Sold (Public Records) $450,000 Public Records
Property tax history
+5.1%/yrLatest (2025): $21,198 · -10.5% YoY. Source: county tax records.
Cash-flow waterfall
monthlySold comps — $/sqft
last 12 mo · ≤1 miLoading sold comps…