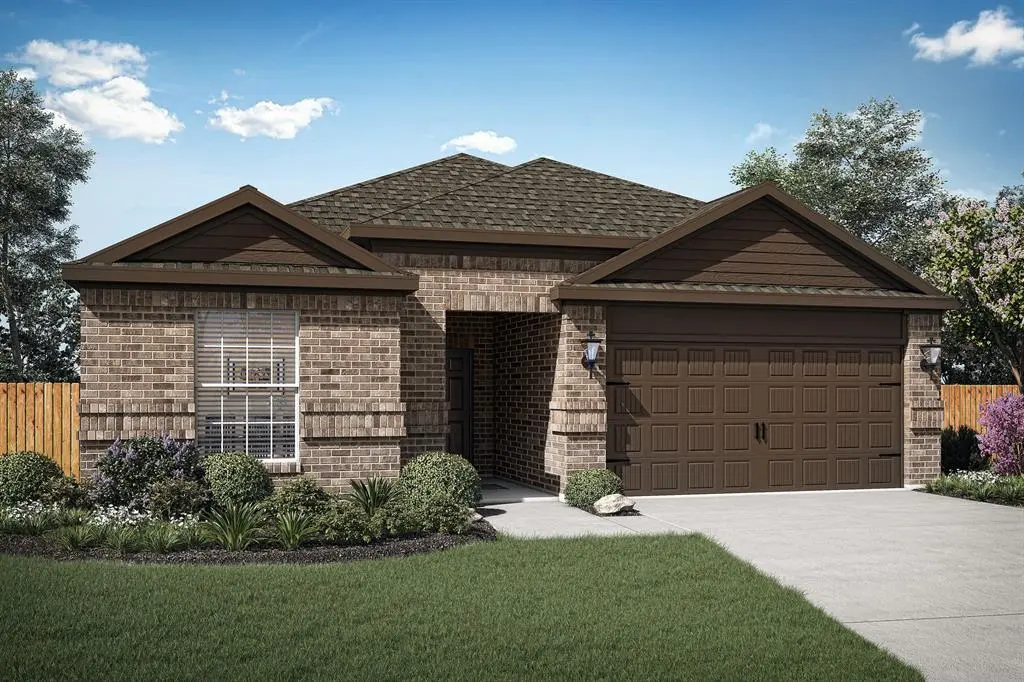
315 Revolution Dr · Venus, TX
Flood risk 1/10 · Minimal
- FEMA flood zone
- X (unshaded)
- Chance of flooding over 30 yrs
- 0.0%
- Est. flood insurance / yr
- $507 – $1,088
Fire risk 3/10 · Minor
- Est. fire insurance / yr
- $1,222 – $2,270
Heat risk 7/10 · Major
- Hot days now (above 110°F)
- 7 days/yr
- Hot days in 30 yrs
- 25 days/yr
Wind risk 6/10 · Moderate
- Chance of severe wind over 30 yrs
- 27.0%
Air-quality risk 2/10 · Minimal
- Unhealthy air days now
- 2 days/yr
- Unhealthy air days in 30 yrs
- 2 days/yr
Risk factors via First Street. Map © Google.
Why this score? — see what drove the F grade
The composite is a weighted blend of 9 inputs, each scored 0–100. Each bar is that input's sub-score; the figure is the points it added to the 100-point composite (weight × sub-score).
- Appreciation +8.7/10.0
- Cash flow +7.1/30.0
- ARV discount +3.6/15.0
- Livability +3.5/5.0
- Rent growth +3.1/5.0
- Schools +2.5/10.0
- Condition / age +2.5/5.0
- 1% rule +2.1/10.0
- DSCR +1.3/10.0
$329,900
🖨 Deal sheet (PDF) 📄 Offer letter ✓ Due diligence
Listing remarks
This incredible four-bedroom, two-bathroom home offers spacious living and thoughtful upgrades throughout. From the stunning brick exterior and professional front yard landscaping to the fully fenced backyard, this home has standout curb appeal and outdoor charm. Inside, the open layout features a large entertaining space and a beautifully upgraded kitchen complete with Whirlpool® appliances, designer wood cabinetry, granite countertops, flush mount LED lighting, and a convenient USB outlet. The private master suite boasts natural light, a walk-in closet, and an extended shower for added comfort. High-tech features include a Wi-Fi-enabled garage door opener, programmable thermostat, and
Key facts
- 5,478 sq ft lot
- 2 garage spots
- Community pool
Neighborhood map
What this means for you Summary
Snapshot
- This is a 4-bed/2.0-bath single-family listed at $330k.
Deal economics
- At list price, monthly cash flow is $-462 ($-6k/yr) — negative.
- To cash-flow at today's rent, offer at most $263k (20.3% below list).
- To meet the 1% rule (rent ≥ 1% of price), the offer needs to be $235k (28.8% below list).
- Recommended offer: $235k (28.8% below list) — sets the bar for 1% rule.
- Cap rate 4.6% vs local median 3.0% in Venus — top-decile yield for the area; either an underpriced asset or a hidden risk that comps aren't pricing in. Stress-test before assuming the spread holds.
Location & tenants
- Location reads 70/100 on livability (#356 in TX) — a middle-class / working-renter tenant base. Strengths: crime A+, employment A+, cost of living A+; Watch: amenities F, commute F, health & safety F.
- Venus ISD (town): math 25% / reading 32% proficiency, ranked #646 of 826 in TX (top 78%) — low school quality limits family demand, transient renter base, plan for 1-2y turnover; 60% free/reduced lunch — lower-income household profile, screen leases tightly.
- Zoned schools: Venus El (math 27% / reading 30%, grade F, #2,706 of 4,322 statewide, top 63%, 658 students, 82% FRL); Venus Middle (math 20% / reading 32%, grade F, #1,222 of 1,662 statewide, top 74%, 491 students, 80% FRL); Venus H S (math 32% / reading 35%, grade F, #1,011 of 1,632 statewide, top 63%, 725 students, 76% FRL) — zoned schools average 79% FRL vs 60% district-wide (19 pts higher); higher-poverty schools than district average — tighter screening recommended.
- Market conditions: Rents rising (+2.4%/yr); 427 active listings in the ZIP; 28 comparable units currently listed for rent nearby; rentals leasing fast (median 9d on market — plan ~1-2 weeks tenant-placement turnaround); solid renter incomes; 2,152 units permitted in Johnson County in 2024 (76 in 5+ unit buildings).
Forward outlook
- In year one you build about $26k of equity ($2k loan paydown + $24k appreciation (7.3% local appreciation)).
- Johnson County population projected at +24% by 2050 — long-run rental-demand tailwind backs the buy-and-hold thesis.
- By year 2, paydown + projected appreciation supports a ~$42k cash-out refi (75% LTV) — recoverable capital for the next deal without selling this one.
Negotiation context
- Only 9 days on market — expect competitive offers; lowballing is unlikely to land.
Risks & watch-outs
- Climate carrying-cost: major wind risk, 27% chance of damaging wind over 30y; extreme-heat days projected 7→25/yr by 2055 (HVAC capex compounding) — expect insurance premiums to compound above CPI over the hold.
Questions for the listing agent
- What do current leases actually rent for vs. the listed asking? Can we see a recent rent roll and the last 12 months of T-12 income?
- What does the HOA fee cover, when was the last increase, and are there any pending special assessments or reserve-fund shortfalls?
- Is there a deadline driving the sale (1031 exchange, divorce, estate, relocation)? That informs how much negotiation room exists.
- Schools are D-rated, which usually means shorter tenancies and higher turnover. Who's the typical renter profile here, and what's been the actual vacancy rate?
- The area grade is low — what's the realistic commute time and amenity access for the typical tenant pool here? Any planned neighborhood developments (good or bad) we should know about?
- What's the average days-on-market for RENTAL listings here right now (not sales)? A rising rental-DOM trend means longer vacancies and softer asking-rent achievability than the comps imply.
- What's the recent tenant-quality profile in this submarket — average credit score on applications, eviction rate, late-payment / NSF rate, and stable-employment percentage? A property-management company in the area should have these aggregated.
- How much new for-sale + rental construction is in the pipeline within 1–3 miles? Heavy new supply typically softens prices + rents 12–24 months out; constrained supply supports both.
Investment metrics
- 1% rule
- 0.71% ✗
- Cap rate
- 4.61%
- Cash-on-cash
- -6.00%
- DSCR
- 0.73
- GRM
- 11.7
CMA / ARV
- ARV (on-the-fly)
- $303,280
- Comps found
- 11
Show comp detail 11 sales within ~0.75 mi
| Address | Dist | Beds/Ba | Sqft | Sold | Price | $/sf | Match |
|---|---|---|---|---|---|---|---|
| 417 Cotton Bend Trl | 0.71mi | 4/2.0 | 1,732 (-3%) | 3mo | $294,999 | $170 | 60 |
| 313 N Point Dr | 0.34mi | 4/2.0 | 2,050 (+15%) | 10mo | $309,000 | $151 | 51 |
| 117 Hamilton Way | 0.71mi | 4/2.0 | 1,661 (-7%) | 6mo | $249,900 | $150 | 50 |
| 602 Wheat Valley Blvd | 0.69mi | 3/2.0 (-1) | 1,817 (+2%) | 14mo | $325,000 | $179 | 48 |
| 418 Fox Holw | 0.55mi | 4/2.0 | 1,886 (+6%) | 20mo | $309,900 | $164 | 48 |
| 105 Patton Ln | 0.70mi | 3/2.0 (-1) | 1,661 (-7%) | 4mo | $275,000 | $166 | 48 |
| 2412 Galaxy | 0.38mi | 3/2.0 (-1) | 1,994 (+12%) | 17mo | $364,990 | $183 | 44 |
| 111 Patton Ln | 0.67mi | 4/2.0 | 1,661 (-7%) | 16mo | $280,000 | $169 | 44 |
| 18725 County Road 620 | 0.69mi | 4/3.0 | 1,952 (+9%) | 8mo | $495,000 | $254 | 41 |
| 142 Crockett Way | 0.74mi | 3/2.5 (-1) | 1,615 (-10%) | 16mo | $300,000 | $186 | 29 |
| 101 Harley Meadows Cir | 0.74mi | 4/2.0 | 2,044 (+15%) | 18mo | $349,900 | $171 | 26 |
Match score weights: distance 35% · size 25% · config 20% · recency 20%. Top-matched comps best support the ARV.
Projected returns pro-forma
7.32% appreciation · 2.39% rent growth · sell at horizon
- IRR
- 13.7%
- Equity multiple
- 1.98×
- Total profit
- $90,934
- Equity at exit
- $235,555
- IRR
- 13.7%
- Equity multiple
- 4.06×
- Total profit
- $283,023
- Equity at exit
- $453,882
Cash invested: $92,372 (down + closing). Projections, not guarantees.
Landlord ↔ Tenant lean methodology
- Overall (STATE)
- 87 Strongly Landlord-Friendly
- State Texas
- 87 Strongly Landlord-Friendly · R+5
- County
- — inherits STATE
- City
- — inherits STATE
ZIP-level market 76084
- Home prices YoY
- 2.1%
- Rents YoY
- 2.4%
- Active inventory
- 427
- Price-to-rent
- 11.7×
Monthly cashflow live
- Estimated rent
- $2,348 high interval (Pro) →
- Mortgage (P&I)
- −$1,730
- Tax est. 1.5%
- −$412 /mo · $4,948/yr
- Insurance
- −$137
- HOA
- −$37
- Vacancy / Maint / Mgmt
- −$493
- Net cashflow
- $-462
Break-even live
Sensitivity live
| Price | -10% $-234 | -5% $-348 | +0% $-462 | +5% $-576 | +10% $-690 |
|---|---|---|---|---|---|
| Rent | -10% $-647 | -5% $-555 | +0% $-462 | +5% $-369 | +10% $-276 |
| Rate | -1.0pp $-296 | -0.5pp $-378 | base $-462 | +0.5pp $-547 | +1.0pp $-634 |
UW: 25.0% down · 7.5% · 30yr · 1.5% tax · 5.0% vac · 8.0% maint · 8.0% mgmt
Financing live
Cash to close
- Down payment
- $82,475
- Closing costs
- $9,897
- Reserves months
- —
- Total cash needed
- —
Loan-product check · same deal, 3 products live
Conventional
25% down · 7.5% · 30yr
- Down + closing
- —
- Monthly P&I
- —
- Monthly cashflow
- —
- DSCR
- —
- Eligible?
- —
Personal DTI + credit; lowest rate.
DSCR
20% down · 8.5% · 30yr
- Down + closing
- —
- Monthly P&I
- —
- Monthly cashflow
- —
- DSCR
- —
- Eligible?
- —
No personal income docs; deal must DSCR.
Hard money
10% down · 12.0% · 12mo
- Down + closing
- —
- Monthly P&I
- —
- Monthly cashflow
- —
- DSCR
- —
- Eligible?
- —
Short-term bridge; refi at stabilization.
Rent comps 28 comps
| Address | Beds | Baths | Sqft | Rent | $/sqft | DOM | Units | Dist |
|---|---|---|---|---|---|---|---|---|
| 101 Hancock St Venus, TX | 3.0 | 2.5 | 1773 | $1,929 | $1.09 | 2d | 1 | 0.77mi |
| 120 Mt Vernon Ln Venus, TX | 3.0 | 2.0 | 1661 | $2,149 | $1.29 | 45d | 1 | 0.86mi |
| 313 Patton Ln Venus, TX | 4.0 | 2.0 | 1784 | $2,355 | $1.32 | 8d | 1 | 0.88mi |
| 315 Patton Ln Venus, TX | 4.0 | 2.5 | 2173 | $2,515 | $1.16 | 4d | 1 | 0.88mi |
| 131 Mt Vernon Ln Venus, TX | 3.0 | 2.0 | 1652 | $2,169 | $1.31 | 23d | 1 | 0.90mi |
| 201 John Laurens Dr Venus, TX | 3.0–5.0 | 2.0–2.5 | 1975 | $2,535 | $1.28 | 0d | 1 | 1.00mi |
| 170 Kennedy Dr Venus, TX | 4.0 | 2.0 | 1661 | $2,300 | $1.38 | 0d | 1 | 1.05mi |
| 108 Rushmore Ln Venus, TX | 4.0 | 2.0 | 1658 | $1,969 | $1.19 | 25d | 1 | 1.12mi |
| 728 Fallow Dr Venus, TX | 3.0 | 2.0 | 1347 | $1,795 | $1.33 | 16d | 1 | 1.15mi |
| 512 Albert Anthony St Venus, TX | 3.0 | 2.0 | 1658 | $1,990 | $1.20 | 23d | 1 | 1.18mi |
| 512 Albert Anthony St Venus, TX | 3.0 | 2.0 | 1658 | $1,990 | $1.20 | 0d | 1 | 1.18mi |
| 112 Liberty Ln Venus, TX | 4.0 | 2.0 | 1658 | $2,309 | $1.39 | 45d | 1 | 1.21mi |
| 201 Julian Davis Dr Venus, TX | 3.0 | 2.5 | 1626 | $2,195 | $1.35 | 21d | 1 | 1.22mi |
| 135 Houston Pl Venus, TX | 3.0 | 2.0 | 1590 | $2,029 | $1.28 | 0d | 1 | 1.24mi |
| 325 Condie Russell Ave Venus, TX | 4.0 | 2.5 | 2189 | $2,325 | $1.06 | 14d | 1 | 1.26mi |
| 208 Julian Davis Dr Venus, TX | 4.0 | 2.0 | 1784 | $2,330 | $1.31 | 13d | 1 | 1.26mi |
| 147 Sammy Fowler Ave Venus, TX | 4.0 | 2.0 | 1690 | $2,250 | $1.33 | 0d | 1 | 1.27mi |
| 214 Julian Davis Dr Venus, TX | 4.0 | 2.0 | 1784 | $2,355 | $1.32 | 45d | 1 | 1.29mi |
| 418 Watson Ct Venus, TX | 3.0 | 2.0 | 1379 | $2,210 | $1.60 | 45d | 1 | 1.31mi |
| 523 Bennie Leonard St Venus, TX | 4.0 | 2.0 | 1690 | $2,350 | $1.39 | 0d | 1 | 1.36mi |
| 315 Julian Davis Dr Venus, TX | 4.0 | 2.0 | 1784 | $2,355 | $1.32 | 0d | 1 | 1.38mi |
| 358 Condie Russell Ave Venus, TX | 3.0 | 2.0 | 1658 | $1,995 | $1.20 | 3d | 1 | 1.40mi |
| 430 Gib Woodall Dr Venus, TX | 3.0 | 2.0 | 1379 | $2,000 | $1.45 | 4d | 1 | 1.43mi |
| 601 Harvest Moon Dr Venus, TX | 3.0 | 2.0 | 1347 | $1,795 | $1.33 | 45d | 1 | 1.45mi |
| 640-644 Wheatfield DR Venus, TX | 4.0 | 2.0 | 1926 | $2,100 | $1.09 | 0d | 1 | 1.46mi |
| 628 Blackland Dr Venus, TX | 4.0 | 2.5 | 1483 | $2,200 | $1.48 | 0d | 1 | 1.47mi |
| 620-616 Harvest Moon Dr Venus, TX | 3.0 | 2.0 | 1307 | $1,950 | $1.49 | 45d | 1 | 1.47mi |
| 645 Fallow Dr Venus, TX | 3.0 | 2.0 | 1301 | $1,950 | $1.50 | 8d | 1 | 1.49mi |
HOA detail
- Monthly dues
- $37 · $444/yr
- Likely covers
- internetlandscapingpool
Listing history 8 events
-
2026-06-21days on market $329,900 Active 9 DOM
-
2026-06-18days on market $329,900 Active 6 DOM
-
2026-06-17days on market $329,900 Active 5 DOM
-
2026-06-16days on market $329,900 Active 4 DOM
-
2026-06-15days on market $329,900 Active 3 DOM
-
2026-06-13statusdays on market $329,900 Active 1 DOM
-
2026-06-04remarks 695-char remark
-
2026-06-04$329,900 Pending
ⓘ Source: listings_history table (triggers on properties + properties_extension) + one-shot
backfill from property_details.listing_events for pre-trigger history.
Climate risk First Street
- Flood 1/10 Low FEMA zone X (unshaded) · 0% chance over 30 yrs
- Wildfire 3/10 Moderate
- Heat 7/10 Severe 7 d/yr ≥110°F today · 25 d/yr by 30 yrs out
- Wind 6/10 Major 27% chance of damaging wind over 30 yrs
- Air quality 2/10 Low 2 unhealthy d/yr today · 2 by 30 yrs out
Nearby sold comps map
Loading sold comps map…
Walkable amenities ~0.75 mi
Loading nearby amenities…
Taxation est. · year 1
- Rental income
- $28,177
- − Mortgage interest
- −$18,480
- − Property taxes
- −$4,948
- − Insurance
- −$1,650
- − Repairs & maintenance
- −$2,254
- − Management
- −$2,254
- − HOA
- −$444
- − Depreciation
- −$9,597
- Taxable loss
- −$11,450
- Est. tax savings @ 24.0%
- +$2,748
- After-tax cash flow
- $-2,795/yr
For passive investors: Depreciation is non-cash, so a rental often shows a tax loss while cash-flowing — sheltering income. Rental losses are passive: they offset passive income freely, and up to $25,000/yr can offset ordinary (W-2) income if you actively participate and your MAGI is under $100k (phasing out to $0 by $150k); unused losses carry forward. On sale, claimed depreciation is recaptured at up to 25%, and gains may owe capital-gains tax (a 1031 exchange can defer both). Figures are a year-1 estimate at your 24.0% rate — not tax advice; consult a CPA.
Schools (NCES district)
- District
- Venus ISD
- NCES district ID
- 4844010
- Math proficiency
- 25% ▼ -15.00%
- Reading proficiency
- 32% ▼ -2.00%
- Median HH income
- $50,394
- Composite
- 24.97/100
- National rank
- #7563
- State rank
- #646 of 826 in TX
Livability — Venus
- Score
- 70/100
- State rank
- #356
- US rank
- #7724
Category grades
Schools grade is shown separately in the Schools card above.
Census & demographics
- County
- Johnson County · 147,987 people
- Metro
- Dallas-Fort Worth-Arlington, TX
- Population (ZIP)
- 14,097
- Household income
- $102,115
- Rent vs Own
- Severe rent burden
- 70.0
Population outlook (Johnson County) Hauer SSP2
- Today (2025)
- 179,678 people
- By 2030
- 189,208 · +5.3%
- By 2040
- 207,261 · +15.4%
- By 2050
- 223,064 · +24.1%
- By 2075
- 259,979 · +44.7%
- By 2100
- 275,395 · +53.3%
Race, ethnicity, and origin ACS 2023
- Neighborhood character
- Diverse neighborhood (Simpson 0.63)
- Race & ethnicity
- White 52% Hispanic / Latino 30% Two or more races 24% Black 11% Asian 1%
- Hispanic origin (detail)
- Mexican 25% Puerto Rican 1%
- Common ancestry
- Romanian 2% Lithuanian 1% Slovak 1%
- Foreign-born
- 8% · Canada
- Languages at home
- 78% English-only · Spanish 18% Arabic 1% French/Haitian/Cajun 1%
Political lean MEDSL · Johnson
- 2024 margin
- Solid R (+51.4) · D 23.9% · R 75.3%
- 2008→2024 swing
- -3.9pp toward R · 2008: -47.5pp · 2024: -51.4pp
- All cycles
- 2024: R+51.4 2020: R+53.0 2016: R+58.3 2012: R+55.6 2008: R+47.5
Not yet ingested
- Civics
- —
Market trends
- HPI YoY
- ▲ 7.32%
- Current HPI
- 355.74
- Rent YoY
- ▲ 2.39%
- Metro
- Dallas-Fort Worth-Arlington, TX
- State GDP YoY
- ▲ 3.95%
- F500 in state
- 110
Industry mix (Fortune 500 HQ in TX)
| Industry | F500 HQs | Revenue |
|---|---|---|
| Energy | 16 | $1,198B |
|
||
| Technology | 5 | $198B |
|
||
| Engineering / Construction | 4 | $72B |
|
||
| Energy Services | 3 | $60B |
|
||
| Utilities | 3 | $41B |
|
||
| Healthcare | 2 | $330B |
|
||
Price history
2 events — show timeline
- 2026-06-03 Listing Removed — NTREIS
- 2026-06-03 Listed $329,900 NTREIS
Cash-flow waterfall
monthlySold comps — $/sqft
last 12 mo · ≤1 miLoading sold comps…