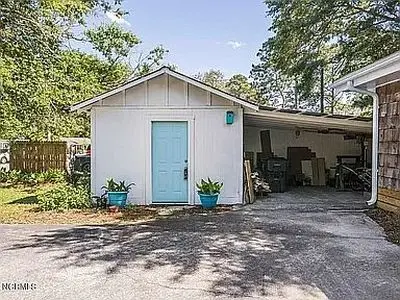
9081 Beach Dr SW · Calabash, NC
Flood risk 1/10 · Minimal
- FEMA flood zone
- X (unshaded)
- Chance of flooding over 30 yrs
- 0.0%
- Est. flood insurance / yr
- $507 – $1,088
Fire risk 3/10 · Minor
- Est. fire insurance / yr
- $906 – $1,684
Heat risk 9/10 · Severe
- Hot days now (above 104°F)
- 7 days/yr
- Hot days in 30 yrs
- 18 days/yr
Wind risk 8/10 · Major
- Chance of severe wind over 30 yrs
- 99.0%
Air-quality risk 2/10 · Minimal
- Unhealthy air days now
- 1 days/yr
- Unhealthy air days in 30 yrs
- 1 days/yr
Risk factors via First Street. Map © Google.
Why this score? — see what drove the F grade
The composite is a weighted blend of 9 inputs, each scored 0–100. Each bar is that input's sub-score; the figure is the points it added to the 100-point composite (weight × sub-score).
- Cash flow +15.0/30.0
- DSCR +4.6/10.0
- Schools +3.9/10.0
- Livability +3.1/5.0
- 1% rule +2.8/10.0
- Rent growth +2.5/5.0
- Condition / age +2.5/5.0
- ARV discount +0.0/15.0
- Appreciation +0.0/10.0
$280,000
🖨 Deal sheet (PDF) 📄 Offer letter ✓ Due diligence
Listing remarks
& quot; & quot; Perfect beach home within walking distance to all that Calabash has to offer! Whether this is your retirement home or an investment property this location is ideal Just 5 minutes to Sunset Beach 3 minutes to four golf courses deep sea fishing and three boat ramps. Choose your lifestyle the options are limitless! Retire and walk to the Calabash Deli for breakfast everyday or go down to meet the boats when they come in with fresh shrimp sea bass flounder trigger fish and grill it yourself in your private fenced backyard. Ideal live/ work situation with secure workshop and shed and a double carport which can be turned into another building. Home is extremely w
Key facts
- Secure workshop
- Walking distance
- Double carport
Tags
Neighborhood map
What this means for you Summary
Snapshot
- This is a 4-bed/2.0-bath manufactured listed at $280k.
Deal economics
- At list price, monthly cash flow is $86 ($1k/yr) — positive.
- The deal already cash-flows at list — no discount required.
- To meet the 1% rule (rent ≥ 1% of price), the offer needs to be $218k (22.2% below list).
- Recommended offer: $218k (22.2% below list) — sets the bar for 1% rule.
- Cap rate 6.7% vs local median 4.1% in Calabash — top-decile yield for the area; either an underpriced asset or a hidden risk that comps aren't pricing in. Stress-test before assuming the spread holds.
Location & tenants
- Location reads 61/100 on livability (#487 in NC) — a middle-class / working-renter tenant base. Strengths: cost of living A+, housing A+, crime A; Watch: health & safety D, amenities F, commute F.
- Brunswick County Schools (rural): math 45% / reading 47% proficiency, ranked #82 of 178 in NC (top 46%) — families likely to look elsewhere, expect single-tenant / working-renter base with shorter leases.
- Zoned schools: Jessie Mae Monroe Elementary (math 43% / reading 41%, grade F, #633 of 1,410 statewide, top 48%, 394 students, 99% FRL); Shallotte Middle (math 40% / reading 50%, grade D, #160 of 475 statewide, top 35%, 674 students, 100% FRL); West Brunswick High (math 50% / reading 56%, grade C-, #281 of 535 statewide, top 53%, 1,526 students, 100% FRL) — zoned schools average 100% FRL vs 53% district-wide (46 pts higher); higher-poverty schools than district average — tighter screening recommended.
- Market conditions: 703 active listings in the ZIP; 7 comparable units currently listed for rent nearby; rentals at typical pace (median 16d on market — plan ~3-4 weeks tenant-placement turnaround); solid renter incomes; 6,112 units permitted in Brunswick County in 2024 (990 in 5+ unit buildings).
- This rent runs 35% of the median local income ($75k/yr) — at the standard rent-burdened threshold; future hikes will face affordability resistance.
Forward outlook
- Local home prices are declining (-3.0%/yr); year-one equity from $2k of loan paydown is wiped out by about $8k of value loss. Plan a longer hold.
- Brunswick County population projected at +36% by 2050 — long-run rental-demand tailwind backs the buy-and-hold thesis.
Negotiation context
- It's been on market 26 days — a 2% lower offer ($276k) is reasonable based on typical stale-listing flexibility.
- 8 sale attempts since 13y ago with the ask held roughly flat each time — persistent listings suggest the price (not the market) is what's stuck; bring a comps-based counter.
- Current owner paid $65k; list at $280k implies a 331% gain — meaningful room to come down on a strong offer.
Risks & watch-outs
- Climate carrying-cost: severe wind risk, 99% chance of damaging wind over 30y; extreme-heat days projected 7→18/yr by 2055 (HVAC capex compounding) — expect insurance premiums to compound above CPI over the hold.
Questions for the listing agent
- Built in 1978 — when were the roof, HVAC, electrical panel, plumbing, and water heater last replaced?
- Is there a deadline driving the sale (1031 exchange, divorce, estate, relocation)? That informs how much negotiation room exists.
- Schools are F-rated, which usually means shorter tenancies and higher turnover. Who's the typical renter profile here, and what's been the actual vacancy rate?
- The area grade is low — what's the realistic commute time and amenity access for the typical tenant pool here? Any planned neighborhood developments (good or bad) we should know about?
- What's the average days-on-market for RENTAL listings here right now (not sales)? A rising rental-DOM trend means longer vacancies and softer asking-rent achievability than the comps imply.
- What's the recent tenant-quality profile in this submarket — average credit score on applications, eviction rate, late-payment / NSF rate, and stable-employment percentage? A property-management company in the area should have these aggregated.
- How much new for-sale + rental construction is in the pipeline within 1–3 miles? Heavy new supply typically softens prices + rents 12–24 months out; constrained supply supports both.
Investment metrics
- 1% rule
- 0.78% ✗
- Cap rate
- 6.66%
- Cash-on-cash
- 1.32%
- DSCR
- 1.06
- GRM
- 10.7
CMA / ARV
- ARV (on-the-fly)
- $208,500
- Comps found
- 12
Show comp detail 12 sales within ~0.75 mi
| Address | Dist | Beds/Ba | Sqft | Sold | Price | $/sf | Match |
|---|---|---|---|---|---|---|---|
| 932 Charlotte Ave SW | 0.22mi | 3/2.0 (-1) | 1,539 (+3%) | 11mo | $214,500 | $139 | 71 |
| 1112 Thrush Ct SW | 0.61mi | 3/2.0 (-1) | 1,475 (-2%) | 2mo | $258,000 | $175 | 62 |
| 1104 Captains Ct | 0.46mi | 3/2.0 (-1) | 1,388 (-8%) | 5mo | $233,000 | $168 | 56 |
| 1100 Thrush Ct | 0.62mi | 3/2.0 (-1) | 1,512 (+1%) | 11mo | $229,000 | $151 | 56 |
| 1122 Captains Ct | 0.35mi | 3/2.0 (-1) | 1,603 (+7%) | 14mo | $220,000 | $137 | 55 |
| 1111 Captains Ct SW | 0.44mi | 3/2.0 (-1) | 1,620 (+8%) | 9mo | $200,000 | $123 | 54 |
| 1070 Waterview Ln SW | 0.63mi | 3/2.0 (-1) | 1,404 (-6%) | 14mo | $210,000 | $150 | 44 |
| 1073 Captains Ct | 0.68mi | 3/2.0 (-1) | 1,675 (+12%) | 2mo | $200,000 | $119 | 43 |
| 1078 Waterview Ln SW | 0.57mi | 3/2.0 (-1) | 1,296 (-14%) | 7mo | $175,000 | $135 | 40 |
| 1108 Songbird Ct SW | 0.62mi | 3/2.0 (-1) | 1,339 (-11%) | 14mo | $185,000 | $138 | 37 |
| 1092 Nautical Ln SW | 0.44mi | 3/3.0 (-1) | 1,720 (+15%) | 13mo | $230,000 | $134 | 35 |
| 1084 Captains Ct | 0.60mi | 3/2.0 (-1) | 1,302 (-13%) | 13mo | $237,000 | $182 | 34 |
Match score weights: distance 35% · size 25% · config 20% · recency 20%. Top-matched comps best support the ARV.
Projected returns pro-forma
-3.0% appreciation · 3.0% rent growth · sell at horizon
- IRR
- -14.3%
- Equity multiple
- 0.49×
- Total profit
- $-40,039
- Equity at exit
- $41,749
- IRR
- -5.6%
- Equity multiple
- 0.64×
- Total profit
- $-28,419
- Equity at exit
- $24,209
Cash invested: $78,400 (down + closing). Projections, not guarantees.
Landlord ↔ Tenant lean methodology
- Overall (STATE)
- 85 Strongly Landlord-Friendly
- State North Carolina
- 85 Strongly Landlord-Friendly · R+3
- County
- — inherits STATE
- City
- — inherits STATE
ZIP-level market 28467
- Home prices YoY
- -33.7%
- Active inventory
- 703
- Price-to-rent
- 10.7×
Monthly cashflow live
- Estimated rent
- $2,178 high interval (Pro) →
- Mortgage (P&I)
- −$1,468
- Tax from tax record
- −$49 /mo · $591/yr
- Insurance
- −$117
- HOA
- −$0
- Vacancy / Maint / Mgmt
- −$457
- Net cashflow
- $86
Break-even live
Sensitivity live
| Price | -10% $245 | -5% $165 | +0% $86 | +5% $7 | +10% $-408 |
|---|---|---|---|---|---|
| Rent | -10% $-86 | -5% $0 | +0% $86 | +5% $172 | +10% $258 |
| Rate | -1.0pp $227 | -0.5pp $157 | base $86 | +0.5pp $14 | +1.0pp $-60 |
UW: 25.0% down · 7.5% · 30yr · 1.5% tax · 5.0% vac · 8.0% maint · 8.0% mgmt
Financing live
Cash to close
- Down payment
- $70,000
- Closing costs
- $8,400
- Reserves months
- —
- Total cash needed
- —
Loan-product check · same deal, 3 products live
Conventional
25% down · 7.5% · 30yr
- Down + closing
- —
- Monthly P&I
- —
- Monthly cashflow
- —
- DSCR
- —
- Eligible?
- —
Personal DTI + credit; lowest rate.
DSCR
20% down · 8.5% · 30yr
- Down + closing
- —
- Monthly P&I
- —
- Monthly cashflow
- —
- DSCR
- —
- Eligible?
- —
No personal income docs; deal must DSCR.
Hard money
10% down · 12.0% · 12mo
- Down + closing
- —
- Monthly P&I
- —
- Monthly cashflow
- —
- DSCR
- —
- Eligible?
- —
Short-term bridge; refi at stabilization.
Rent comps 7 comps
| Address | Beds | Baths | Sqft | Rent | $/sqft | DOM | Units | Dist |
|---|---|---|---|---|---|---|---|---|
| 1086 Mille Ave Calabash, NC | 3.0 | 2.0 | 1232 | $2,000 | $1.62 | 25d | 1 | 0.40mi |
| 1420 Sherman Dr Calabash, NC | 2.0–3.0 | 1.0–2.0 | 1011 | $770 | $0.76 | 15d | 3 | 0.46mi |
| 834 Greenwood Ct Calabash, NC | 3.0 | 2.0 | 1475 | $2,100 | $1.42 | 15d | 1 | 0.62mi |
| 1063 Harbor Dr Calabash, NC | 3.0 | 2.0 | 1421 | $2,200 | $1.55 | 23d | 1 | 0.69mi |
| 1016 Harbor Dr Calabash, NC | 4.0 | 2.0 | 1780 | $2,400 | $1.35 | 15d | 1 | 1.05mi |
| 1035 Brightwater Way Calabash, NC | 1.0–3.0 | 1.0–2.5 | 1327 | $2,145 | $1.62 | 25d | 1 | 1.09mi |
| 908 Resort Cir Unit 1 Sunset Beach, NC | 3.0 | 2.0 | 1301 | $1,500 | $1.15 | 15d | 1 | 1.43mi |
Listing history 44 events
-
2026-06-22days on market $280,000 Active 26 DOM
-
2026-06-18days on market $280,000 Active 23 DOM
-
2026-06-17days on market $280,000 Active 22 DOM
-
2026-06-16days on market $280,000 Active 21 DOM
-
2026-06-15days on market $280,000 Active 20 DOM
-
2026-06-14days on market $280,000 Active 18 DOM
-
2026-06-13days on market $280,000 Active 17 DOM
-
2026-06-10days on market $280,000 Active 15 DOM
-
2026-06-09days on market $280,000 Active 14 DOM
-
2026-06-08days on market $280,000 Active 13 DOM
-
2026-06-07days on market $280,000 Active 12 DOM
-
2026-06-05days on market $280,000 Active 9 DOM
-
2026-06-03days on market $280,000 Active 8 DOM
-
2026-06-02days on market $280,000 Active 7 DOM
-
2026-06-01days on market $280,000 Active 6 DOM
-
2026-05-31days on market $280,000 Active 5 DOM
-
2026-05-30days on market $280,000 Active 4 DOM
-
2026-05-26$280,000 Active
-
2025-03-31historical
-
2025-03-31historical
-
2025-03-22price $299,900
-
2025-03-22price $299,900
-
2025-03-11price $319,000
-
2025-02-20price $319,000
-
2024-09-13$339,000 Active
-
2024-09-13$339,000 Active
-
2024-09-07historical
-
2024-08-03$340,000 Active
-
2023-11-20historical
-
2023-07-19price $350,000
-
2023-07-02price $299,000
-
2023-06-19price $450,000
-
2023-06-13price $325,000
-
2023-06-01price $349,000
-
2023-05-01$350,000 Active
-
2023-04-17historical
-
2023-04-06price $383,000
-
2023-03-24$395,000 Active
-
2019-05-17historical
-
2018-11-19$99,900
-
2013-10-31historical
-
2013-10-24soldstatus $65,000
-
2013-03-27$89,900
-
2000-08-01soldstatus $20,000
ⓘ Source: listings_history table (triggers on properties + properties_extension) + one-shot
backfill from property_details.listing_events for pre-trigger history.
Tax reassessment forecast NC · Resets to sale price
- Current annual tax
- $591 · $49/mo
- Projected year-2 tax
- $2,296 · $191/mo
- Expected delta
- +$1,705/yr (+$142/mo · 288.4%)
ⓘ Screening estimate from a state-policy table — verify with the county assessor before closing.
Climate risk First Street
- Flood 1/10 Low FEMA zone X (unshaded) · 0% chance over 30 yrs
- Wildfire 3/10 Moderate
- Heat 9/10 Extreme 7 d/yr ≥104°F today · 18 d/yr by 30 yrs out
- Wind 8/10 Severe 99% chance of damaging wind over 30 yrs
- Air quality 2/10 Low 1 unhealthy d/yr today · 1 by 30 yrs out
Nearby sold comps map
Loading sold comps map…
Walkable amenities ~0.75 mi
Loading nearby amenities…
Taxation est. · year 1
- Rental income
- $26,133
- − Mortgage interest
- −$15,684
- − Property taxes
- −$591
- − Insurance
- −$1,400
- − Repairs & maintenance
- −$2,091
- − Management
- −$2,091
- − Depreciation
- −$8,145
- Taxable loss
- −$3,869
- Est. tax savings @ 24.0%
- +$929
- After-tax cash flow
- $1,962/yr
For passive investors: Depreciation is non-cash, so a rental often shows a tax loss while cash-flowing — sheltering income. Rental losses are passive: they offset passive income freely, and up to $25,000/yr can offset ordinary (W-2) income if you actively participate and your MAGI is under $100k (phasing out to $0 by $150k); unused losses carry forward. On sale, claimed depreciation is recaptured at up to 25%, and gains may owe capital-gains tax (a 1031 exchange can defer both). Figures are a year-1 estimate at your 24.0% rate — not tax advice; consult a CPA.
Schools (NCES district)
- District
- Brunswick County Schools
- NCES district ID
- 3700420
- Math proficiency
- 45% ▲ 4.00%
- Reading proficiency
- 47% ▲ 4.00%
- Median HH income
- $47,494
- Composite
- 39.23/100
- National rank
- #4011
- State rank
- #82 of 178 in NC
Livability — Calabash
- Score
- 61/100
- State rank
- #487
- US rank
- #17866
Category grades
Schools grade is shown separately in the Schools card above.
Census & demographics
- Census place
- Calabash, NC
- County
- Brunswick County · 131,536 people
- Metro
- Myrtle Beach-Conway-North Myrtle Beach, SC-NC
- Population (ZIP)
- 13,313
- Household income
- $75,341
- Rent vs Own
- Severe rent burden
- 81.0
Population outlook (Brunswick County) Hauer SSP2
- Today (2025)
- 152,111 people
- By 2030
- 165,705 · +8.9%
- By 2040
- 188,494 · +23.9%
- By 2050
- 206,228 · +35.6%
- By 2075
- 237,876 · +56.4%
- By 2100
- 251,451 · +65.3%
Race, ethnicity, and origin ACS 2023
- Neighborhood character
- Predominantly White (90%)
- Race & ethnicity
- White 90% Two or more races 4% Black 3% Hispanic / Latino 2%
- Common ancestry
- Slovak 5% Romanian 5% Lithuanian 3%
- Foreign-born
- 3% · Canada
- Languages at home
- 98% English-only · Spanish 1%
Political lean MEDSL · Brunswick
- 2024 margin
- Strong R (+24.9) · D 37.2% · R 62.0%
- 2008→2024 swing
- -6.9pp toward R · 2008: -17.9pp · 2024: -24.9pp
- All cycles
- 2024: R+24.9 2020: R+25.0 2016: R+28.7 2012: R+22.2 2008: R+17.9
Not yet ingested
- Civics
- —
Market trends
- HPI YoY
- ▼ -67.90%
- Current HPI
- 133.7186
- Rent YoY
- —
- Metro
- Myrtle Beach-Conway-North Myrtle Beach, SC-NC
- State GDP YoY
- ▲ 3.28%
- F500 in state
- 26
Industry mix (Fortune 500 HQ in NC)
| Industry | F500 HQs | Revenue |
|---|---|---|
| Financial Services | 2 | $213B |
|
||
| Retail | 2 | $95B |
|
||
| Industrial Conglomerate | 1 | $38B |
|
||
| Metals / Steel | 1 | $35B |
|
||
| Utilities | 1 | $30B |
|
||
| Industrial Machinery | 1 | $19B |
|
||
Price history
+1300.0% since first listed27 events — show timeline
- 2026-05-26 Listed $280,000 FSBO.com
- 2025-03-31 Listing Removed — CCAR
- 2025-03-31 Listing Removed — Hive MLS
- 2025-03-22 Price Changed $299,900 Hive MLS
- 2025-03-22 Price Changed $299,900 CCAR
- 2025-03-11 Price Changed $319,000 Hive MLS
- 2025-02-20 Price Changed $319,000 CCAR
- 2024-09-13 Listed $339,000 CCAR
- 2024-09-13 Listed $339,000 Hive MLS
- 2024-09-07 Listing Removed — Hive MLS
- 2024-08-03 Listed $340,000 Hive MLS
- 2023-11-20 Listing Removed — Hive MLS
- 2023-07-19 Price Changed $350,000 Hive MLS
- 2023-07-02 Price Changed $299,000 Hive MLS
- 2023-06-19 Price Changed $450,000 Hive MLS
- 2023-06-13 Price Changed $325,000 Hive MLS
- 2023-06-01 Price Changed $349,000 Hive MLS
- 2023-05-01 Listed $350,000 Hive MLS
- 2023-04-17 Listing Removed — Hive MLS
- 2023-04-06 Price Changed $383,000 Hive MLS
- 2023-03-24 Listed $395,000 Hive MLS
- 2019-05-17 Listing Removed — Hive MLS
- 2018-11-19 Listed $99,900 Hive MLS
- 2013-10-31 Listing Removed — Hive MLS
- 2013-10-24 Sold (Public Records) $65,000 Public Records
- 2013-03-27 Listed $89,900 Hive MLS
- 2000-08-01 Sold (Public Records) $20,000 Public Records
Property tax history
+7.5%/yrLatest (2025): $591 · +2.0% YoY. Source: county tax records.
Cash-flow waterfall
monthlySold comps — $/sqft
last 12 mo · ≤1 miLoading sold comps…