 Multi-family
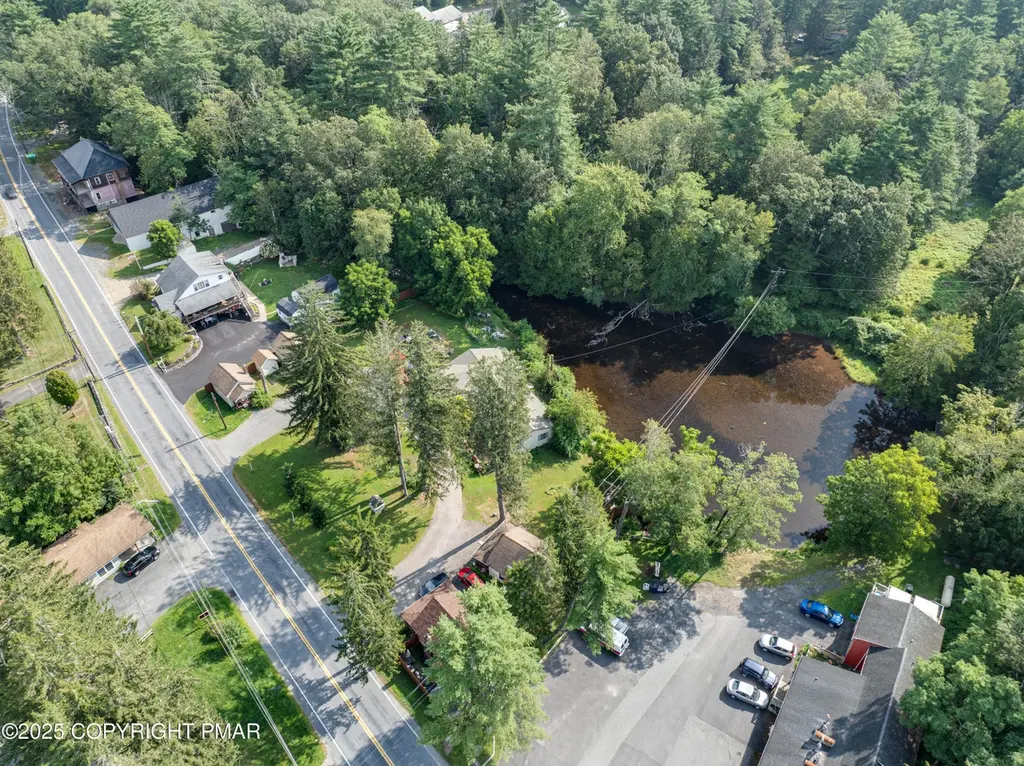
2413 Route 390 · Barrett, PA
Flood risk 10/10 · Severe
- FEMA flood zone
- X (unshaded)
- Chance of flooding over 30 yrs
- 0.99%
- Est. flood insurance / yr
- $507 – $1,088
Fire risk 3/10 · Minor
- Est. fire insurance / yr
- $511 – $949
Heat risk 3/10 · Minor
- Hot days now (above 90°F)
- 8 days/yr
- Hot days in 30 yrs
- 18 days/yr
Wind risk 3/10 · Minor
- Chance of severe wind over 30 yrs
- 6.0%
Air-quality risk 2/10 · Minimal
- Unhealthy air days now
- 1 days/yr
- Unhealthy air days in 30 yrs
- 2 days/yr
Risk factors via First Street. Map © Google.
Why this score? — see what drove the B+ grade
The composite is a weighted blend of 9 inputs, each scored 0–100. Each bar is that input's sub-score; the figure is the points it added to the 100-point composite (weight × sub-score).
- Cash flow +30.0/30.0
- 1% rule +10.0/10.0
- DSCR +10.0/10.0
- ARV discount +7.5/15.0
- Appreciation +5.7/10.0
- Schools +4.0/10.0
- Condition / age +3.8/5.0
- Rent growth +2.5/5.0
- Livability +2.5/5.0
$1,950,000
🖨 Deal sheet 📄 Offer letter ✓ Due diligence
Multi-family units
County records classify this as Multi-Family (5+ Unit). Listing-text estimate: 1 unit. estimate disagrees with records
5+ unit building — per-unit beds/baths from public records are typically unavailable; the breakdown below (if shown) is an estimate from the listing text.
Listing remarks MLS
Prime Investment in Canadensis! Multi-unit, mixed-use commercial property featuring 23 units with nearly 100% occupancy. This well-maintained complex includes multiple buildings and has undergone major recent updates, including new roofs and siding, ensuring long-term stability for investors. Perfectly situated in the heart of Mountainhome, tenants enjoy easy access to state parks, Skytop Resort, dining, and local amenities. Strong rental history and location make this a fantastic opportunity to own a high-performing asset in the Poconos. Rare chance to secure a turnkey property with steady income and growth potential.
Key facts
- New siding
- New roofs
- 23 units
Tags
Neighborhood map
What this means for you Summary
Snapshot
- This is a multifamily listed at $1.95M. Condition is rated good.
Deal economics
- At list price, monthly cash flow is $13k ($154k/yr) — positive.
- The deal already cash-flows at list — no discount required.
- Meets the 1% rule at list price ($33k rent vs $1.95M).
- Recommended offer: $1.72M (12.0% below list) — sets the bar for market timing.
Location & tenants
- Location reads: area grade B — affects rentability + tenant quality, not the cash-flow math above.
- Pocono Mountain SD (rural): math 37% / reading 55% proficiency, ranked #245 of 539 in PA (top 46%) — families likely to look elsewhere, expect single-tenant / working-renter base with shorter leases.
- Market conditions: 48 active listings in the ZIP; 278 units permitted in Monroe County in 2024 (52 in 5+ unit buildings).
Forward outlook
- In year one you build about $43k of equity ($13k loan paydown + $29k appreciation (1.5% local appreciation)).
- Monroe County population projected at -11% by 2050 — secular population decline; favor cash flow + early exit over multi-decade hold.
- At projected returns (1.5% appreciation + 3.0% rent growth), your $546k cash investment doubles in ~3 years — after that, you're playing with house money.
- By year 3, paydown + projected appreciation supports a ~$110k cash-out refi (75% LTV) — recoverable capital for the next deal without selling this one.
Negotiation context
- It's been on market 263 days — a 12% lower offer ($1.72M) is reasonable based on typical stale-listing flexibility.
- 2 sale attempts with the ask held roughly flat each time — persistent listings suggest the price (not the market) is what's stuck; bring a comps-based counter.
Risks & watch-outs
- Watch-outs: flood insurance adds $66/mo.
- Climate carrying-cost: severe flood risk — expect insurance premiums to compound above CPI over the hold.
Questions for the listing agent
- It's been on market 263 days. Have you received any prior offers? Is the seller open to a 12% concession, seller financing, or rate buy-down credit?
- Built in 1971 — when were the roof, HVAC, electrical panel, plumbing, and water heater last replaced?
- What's the actual annual flood-insurance premium (NFIP or private), and is the property in a SFHA with mandatory coverage?
- Why hasn't it sold? Are there any deal-killer items the seller is aware of (foundation, flood, title, zoning, code violations)?
- Is there a deadline driving the sale (1031 exchange, divorce, estate, relocation)? That informs how much negotiation room exists.
- What's the average days-on-market for RENTAL listings here right now (not sales)? A rising rental-DOM trend means longer vacancies and softer asking-rent achievability than the comps imply.
- What's the recent tenant-quality profile in this submarket — average credit score on applications, eviction rate, late-payment / NSF rate, and stable-employment percentage? A property-management company in the area should have these aggregated.
- How much new apartment / multifamily construction is in the pipeline within 1–3 miles? Heavy new supply (>2% of stock underway) typically softens rents 12–24 months out; light construction supports rent growth.
Investment metrics
- 1% rule
- 1.71% ✓
- Cap rate
- 14.24%
- Cash-on-cash
- 28.39%
- DSCR
- 2.26
- GRM
- 4.9
CMA / ARV
No comps found within radius.
Projected returns pro-forma
1.5% appreciation · 3.0% rent growth · sell at horizon
- IRR
- 31.5%
- Equity multiple
- 2.65×
- Total profit
- $903,360
- Equity at exit
- $716,479
- IRR
- 33.3%
- Equity multiple
- 5.16×
- Total profit
- $2,269,141
- Equity at exit
- $992,719
Cash invested: $546,000 (down + closing). Projections, not guarantees.
Landlord ↔ Tenant lean methodology
- Overall (STATE)
- 62 Landlord-Friendly
- State Pennsylvania
- 62 Landlord-Friendly · EVEN
- County
- — inherits STATE
- City
- — inherits STATE
ZIP-level market 18325
- Home prices YoY
- 0.9%
- Active inventory
- 48
- Price-to-rent
- 111.9×
Monthly cashflow live
- Estimated rent
- $33,412 medium interval (Pro) →
- Mortgage (P&I)
- −$10,226
- Tax est. 1.5%
- −$2,438 /mo · $29,250/yr
- Insurance
- −$812
- Flood insurance flood zone
- −$66 /mo · $798/yr
- HOA
- −$0
- Vacancy / Maint / Mgmt
- −$7,017
- Net cashflow
- $12,853
Break-even live
23-unit breakdown (identical units grouped — click to expand)
| Units | Beds | Baths | Est. rent |
|---|---|---|---|
| 23× units | 2 | 1 | $33,419 |
| #1 | 2 | 1 | $1,453 |
| #2 | 2 | 1 | $1,453 |
| #3 | 2 | 1 | $1,453 |
| #4 | 2 | 1 | $1,453 |
| #5 | 2 | 1 | $1,453 |
| #6 | 2 | 1 | $1,453 |
| #7 | 2 | 1 | $1,453 |
| #8 | 2 | 1 | $1,453 |
| #9 | 2 | 1 | $1,453 |
| #10 | 2 | 1 | $1,453 |
| #11 | 2 | 1 | $1,453 |
| #12 | 2 | 1 | $1,453 |
| #13 | 2 | 1 | $1,453 |
| #14 | 2 | 1 | $1,453 |
| #15 | 2 | 1 | $1,453 |
| #16 | 2 | 1 | $1,453 |
| #17 | 2 | 1 | $1,453 |
| #18 | 2 | 1 | $1,453 |
| #19 | 2 | 1 | $1,453 |
| #20 | 2 | 1 | $1,453 |
| #21 | 2 | 1 | $1,453 |
| #22 | 2 | 1 | $1,453 |
| #23 | 2 | 1 | $1,453 |
| Total (23 units) | $33,412 | ||
UW: 25.0% down · 7.5% · 30yr · 1.5% tax · 5.0% vac · 8.0% maint · 8.0% mgmt
Financing live
Cash to close
- Down payment
- $487,500
- Closing costs
- $58,500
- Reserves months
- —
- Total cash needed
- —
Loan-product check · same deal, 3 products live
Conventional
25% down · 7.5% · 30yr
- Down + closing
- —
- Monthly P&I
- —
- Monthly cashflow
- —
- DSCR
- —
- Eligible?
- —
Personal DTI + credit; lowest rate.
DSCR
20% down · 8.5% · 30yr
- Down + closing
- —
- Monthly P&I
- —
- Monthly cashflow
- —
- DSCR
- —
- Eligible?
- —
No personal income docs; deal must DSCR.
Hard money
10% down · 12.0% · 12mo
- Down + closing
- —
- Monthly P&I
- —
- Monthly cashflow
- —
- DSCR
- —
- Eligible?
- —
Short-term bridge; refi at stabilization.
Listing history 15 events
-
2026-06-18days on market $1,950,000 Active 263 DOM
-
2026-06-17days on market $1,950,000 Active 262 DOM
-
2026-06-16days on market $1,950,000 Active 261 DOM
-
2026-06-15days on market $1,950,000 Active 260 DOM
-
2026-06-14days on market $1,950,000 Active 258 DOM
-
2026-06-13days on market $1,950,000 Active 257 DOM
-
2026-06-10days on market $1,950,000 Active 255 DOM
-
2026-06-08days on market $1,950,000 Active 253 DOM
-
2026-06-07days on market $1,950,000 Active 252 DOM
-
2026-06-02days on market $1,950,000 Active 247 DOM
-
2026-06-01days on market $1,950,000 Active 246 DOM
-
2026-05-31days on market $1,950,000 Active 245 DOM
-
2026-05-30days on market $1,950,000 Active 244 DOM
-
2026-03-10status Active 626-char remark
Show marketing remark (626 chars)
Prime Investment in Canadensis! Multi-unit, mixed-use commercial property featuring 23 units with nearly 100% occupancy. This well-maintained complex includes multiple buildings and has undergone major recent updates, including new roofs and siding, ensuring long-term stability for investors. Perfectly situated in the heart of Mountainhome, tenants enjoy easy access to state parks, Skytop Resort, dining, and local amenities. Strong rental history and location make this a fantastic opportunity to own a high-performing asset in the Poconos. Rare chance to secure a turnkey property with steady income and growth potential.
-
2025-09-18$1,950,000 Active 626-char remark
Show marketing remark (626 chars)
Prime Investment in Canadensis! Multi-unit, mixed-use commercial property featuring 23 units with nearly 100% occupancy. This well-maintained complex includes multiple buildings and has undergone major recent updates, including new roofs and siding, ensuring long-term stability for investors. Perfectly situated in the heart of Mountainhome, tenants enjoy easy access to state parks, Skytop Resort, dining, and local amenities. Strong rental history and location make this a fantastic opportunity to own a high-performing asset in the Poconos. Rare chance to secure a turnkey property with steady income and growth potential.
ⓘ Source: listings_history table (triggers on properties + properties_extension) + one-shot
backfill from property_details.listing_events for pre-trigger history.
Climate risk First Street
- Flood 10/10 Extreme FEMA zone X (unshaded) · 99% chance over 30 yrs
- Wildfire 3/10 Moderate
- Heat 3/10 Moderate 8 d/yr ≥90°F today · 18 d/yr by 30 yrs out
- Wind 3/10 Moderate 6% chance of damaging wind over 30 yrs
- Air quality 2/10 Low 1 unhealthy d/yr today · 2 by 30 yrs out
Nearby sold comps map
Loading sold comps map…
Walkable amenities ~0.75 mi
Loading nearby amenities…
Taxation est. · year 1
- Rental income
- $400,944
- − Mortgage interest
- −$109,230
- − Property taxes
- −$29,250
- − Insurance
- −$10,548
- − Repairs & maintenance
- −$32,076
- − Management
- −$32,076
- − Depreciation
- −$56,727
- Taxable income
- $131,038
- Est. tax owed @ 24.0%
- −$31,449
- After-tax cash flow
- $122,787/yr
For passive investors: Depreciation is non-cash, so a rental often shows a tax loss while cash-flowing — sheltering income. Rental losses are passive: they offset passive income freely, and up to $25,000/yr can offset ordinary (W-2) income if you actively participate and your MAGI is under $100k (phasing out to $0 by $150k); unused losses carry forward. On sale, claimed depreciation is recaptured at up to 25%, and gains may owe capital-gains tax (a 1031 exchange can defer both). Figures are a year-1 estimate at your 24.0% rate — not tax advice; consult a CPA.
Condition & rehab AI · 13 photos
This multi-family property is in good condition with no visible damage. It has undergone recent updates and is well-maintained. Painting the exterior, cleaning the parking lot, and trimming the trees can further increase its value.
Value-add opportunities
- Both Paint the exterior — Painting the exterior can improve the curb appeal and increase both resale and rental value.
- Both Clean the parking lot — A clean parking lot can improve the overall appearance of the property and increase both resale and rental value.
- Both Trim the trees — Trimming the trees can improve the overall appearance of the property and increase both resale and rental value.
Renovation cost estimate screening
Value-add ROI direction
- Both Paint the exterior — Painting the exterior can improve the curb appeal and increase both resale and rental value. ↑
- Both Clean the parking lot — A clean parking lot can improve the overall appearance of the property and increase both resale and rental value. ↑
- Both Trim the trees — Trimming the trees can improve the overall appearance of the property and increase both resale and rental value. ↑
ⓘ Cost ranges are severity-bucket heuristics (US national rule-of-thumb). Get contractor quotes + a written scope before underwriting a rehab budget.
Schools (NCES district)
- District
- Pocono Mountain SD
- NCES district ID
- 4219500
- Math proficiency
- 37% ▼ -5.00%
- Reading proficiency
- 55% ▲ 1.00%
- Median HH income
- $55,317
- Composite
- 39.91/100
- National rank
- #3856
- State rank
- #245 of 539 in PA
Livability — Barrett
No livability data for this city. (Only ~50 U.S. cities are tracked.)
Census & demographics
- Population (ZIP)
- 2,688
Population outlook (Monroe County) Hauer SSP2
- Today (2025)
- 164,099 people
- By 2030
- 161,412 · -1.6%
- By 2040
- 154,616 · -5.8%
- By 2050
- 146,710 · -10.6%
- By 2075
- 140,830 · -14.2%
- By 2100
- 138,472 · -15.6%
Race, ethnicity, and origin ACS 2023
- Neighborhood character
- Predominantly White (78%)
- Race & ethnicity
- White 78% Two or more races 22% Hispanic / Latino 19%
- Hispanic origin (detail)
- Common ancestry
- Romanian 22% Scotch-Irish 7% Slovak 2%
- Foreign-born
- 6% · Canada
- Languages at home
- 82% English-only · Spanish 14% Russian/Polish/Slavic 3% French/Haitian/Cajun 1%
Political lean MEDSL · Monroe
- 2024 margin
- Toss-up / Even · D 49.1% · R 49.9%
- 2008→2024 swing
- -17.1pp toward R · 2008: 16.3pp · 2024: -0.8pp
- All cycles
- 2024: R+0.8 2020: D+6.4 2016: D+0.3 2012: D+14.0 2008: D+16.3
Not yet ingested
- Civics
- —
Market trends
- HPI YoY
- ▲ 1.50%
- Current HPI
- 168.9888
- Rent YoY
- —
- Metro
- —
- State GDP YoY
- ▲ 1.68%
- F500 in state
- 34
Industry mix (Fortune 500 HQ in PA)
| Industry | F500 HQs | Revenue |
|---|---|---|
| Healthcare | 2 | $309B |
|
||
| Insurance | 2 | $27B |
|
||
| Telecommunications / Media | 1 | $124B |
|
||
| Industrial Distribution | 1 | $22B |
|
||
| Financial Services | 1 | $20B |
|
||
| Chemicals / Materials | 1 | $18B |
|
||
Price history
2 events — show timeline
- 2026-03-10 Relisted — PMAR
- 2025-09-18 Listed $1,950,000 PMAR
Cash-flow waterfall
monthlySold comps — $/sqft
last 12 mo · ≤1 miLoading sold comps…