202 4th St NW · Magee, MS
Flood risk No data
- FEMA flood zone
- —
- Chance of flooding over 30 yrs
- —
- Est. flood insurance / yr
- —
Fire risk No data
- Est. fire insurance / yr
- —
Heat risk No data
- Hot days now (above threshold)
- —
- Hot days in 30 yrs
- —
Wind risk No data
- Chance of severe wind over 30 yrs
- —
Air-quality risk No data
- Unhealthy air days now
- —
- Unhealthy air days in 30 yrs
- —
Risk factors via First Street. Map © Google.
Why this score? — see what drove the B grade
The composite is a weighted blend of 9 inputs, each scored 0–100. Each bar is that input's sub-score; the figure is the points it added to the 100-point composite (weight × sub-score).
- Cash flow +30.0/30.0
- 1% rule +10.0/10.0
- DSCR +10.0/10.0
- ARV discount +7.5/15.0
- Appreciation +6.5/10.0
- Livability +3.2/5.0
- Rent growth +2.5/5.0
- Condition / age +2.0/5.0
- Schools +1.7/10.0
$70,000
🖨 Deal sheet (PDF) 📄 Offer letter ✓ Due diligence
Listing remarks
fixer upper with tons of potential
Key facts
- Built 1948
Neighborhood map
What this means for you Summary
Snapshot
- This is a 3-bed/2.0-bath single-family listed at $70k. Condition is rated fair.
Deal economics
- At list price, monthly cash flow is $412 ($5k/yr) — positive.
- The deal already cash-flows at list — no discount required.
- Meets the 1% rule at list price ($1k rent vs $70k).
- Cap rate 13.4% vs local median 3.5% in Magee — top-decile yield for the area; either an underpriced asset or a hidden risk that comps aren't pricing in. Stress-test before assuming the spread holds.
Location & tenants
- Location reads 63/100 on livability (#158 in MS) — a middle-class / working-renter tenant base. Strengths: cost of living A+; Watch: crime F, amenities F, commute F.
- Simpson County School District (rural): math 18% / reading 24% proficiency, ranked #90 of 130 in MS (top 69%) — low school quality limits family demand, transient renter base, plan for 1-2y turnover; 76% free/reduced lunch — lower-income household profile, screen leases tightly.
- Zoned schools: Magee Elementary School (math 16% / reading 22%, grade F, #251 of 375 statewide, top 67%, 504 students, 99% FRL); Magee Middle School (math 14% / reading 21%, grade F, #123 of 179 statewide, top 69%, 325 students, 99% FRL); Magee High School (math 8% / reading 8%, grade F, #184 of 197 statewide, top 94%, 405 students, 99% FRL) — zoned schools average 99% FRL vs 76% district-wide (24 pts higher); higher-poverty schools than district average — tighter screening recommended.
- Market conditions: 78 active listings in the ZIP; 3 units permitted in Simpson County in 2024 (0 in 5+ unit buildings).
Forward outlook
- In year one you build about $3k of equity ($484 loan paydown + $2k appreciation (2.9% local appreciation)).
- Simpson County population projected at -16% by 2050 — secular population decline; favor cash flow + early exit over multi-decade hold.
- At projected returns (2.9% appreciation + 3.0% rent growth), your $20k cash investment doubles in ~3 years — after that, you're playing with house money.
Negotiation context
- Only 0 days on market — expect competitive offers; lowballing is unlikely to land.
- 3 sale attempts since 27y ago with the ask held roughly flat each time — persistent listings suggest the price (not the market) is what's stuck; bring a comps-based counter.
Risks & watch-outs
- Watch-outs: built in 1948 — expect roof / HVAC / electrical / plumbing capex.
Questions for the listing agent
- Have any recent inspections been done? Can we get a copy of the seller's disclosures and any deferred-maintenance estimates?
- Built in 1948 — when were the roof, HVAC, electrical panel, plumbing, and water heater last replaced?
- Is there a deadline driving the sale (1031 exchange, divorce, estate, relocation)? That informs how much negotiation room exists.
- Schools are F-rated, which usually means shorter tenancies and higher turnover. Who's the typical renter profile here, and what's been the actual vacancy rate?
- Crime grade is F in this area — have there been break-ins, vandalism, or insurance claims at this property in the last 3 years? What carrier currently insures it and at what premium?
- What's the average days-on-market for RENTAL listings here right now (not sales)? A rising rental-DOM trend means longer vacancies and softer asking-rent achievability than the comps imply.
- What's the recent tenant-quality profile in this submarket — average credit score on applications, eviction rate, late-payment / NSF rate, and stable-employment percentage? A property-management company in the area should have these aggregated.
- How much new for-sale + rental construction is in the pipeline within 1–3 miles? Heavy new supply typically softens prices + rents 12–24 months out; constrained supply supports both.
Investment metrics
- 1% rule
- 1.62% ✓
- Cap rate
- 13.36%
- Cash-on-cash
- 25.24%
- DSCR
- 2.12
- GRM
- 5.1
CMA / ARV
- ARV (on-the-fly)
- $164,445
- Comps found
- 7
Show comp detail 7 sales within ~0.75 mi
| Address | Dist | Beds/Ba | Sqft | Sold | Price | $/sf | Match |
|---|---|---|---|---|---|---|---|
| 510 NW Kennedy Dr | 0.19mi | 3/2.0 | 1,561 (-10%) | 2mo | $169,900 | $109 | 73 |
| 320 NE 2nd Ave | 0.23mi | 3/1.0 | 1,871 (+8%) | 7mo | $65,000 | $35 | 66 |
| 608 NW Goodwater Rd | 0.37mi | 3/2.0 | 1,736 (+0%) | 20mo | $155,900 | $90 | 66 |
| 324 NW 3rd Ave | 0.16mi | 2/2.0 (-1) | 1,551 (-10%) | 22mo | $165,000 | $106 | 52 |
| 105 NE Adams Ave | 0.75mi | 3/2.0 | 1,600 (-8%) | 9mo | $272,000 | $170 | 45 |
| 722 SE 1st St | 0.67mi | 4/2.0 (+1) | 1,532 (-12%) | 9mo | $145,000 | $95 | 37 |
| 625 SW 4th Ave | 0.69mi | 4/3.0 (+1) | 1,873 (+8%) | 11mo | $169,000 | $90 | 36 |
Match score weights: distance 35% · size 25% · config 20% · recency 20%. Top-matched comps best support the ARV.
Projected returns pro-forma
2.9% appreciation · 3.0% rent growth · sell at horizon
- IRR
- 31.1%
- Equity multiple
- 2.75×
- Total profit
- $34,340
- Equity at exit
- $31,085
- IRR
- 31.6%
- Equity multiple
- 5.38×
- Total profit
- $85,941
- Equity at exit
- $47,605
Cash invested: $19,600 (down + closing). Projections, not guarantees.
Landlord ↔ Tenant lean methodology
- Overall (STATE)
- 90 Strongly Landlord-Friendly
- State Mississippi
- 90 Strongly Landlord-Friendly · R+11
- County
- — inherits STATE
- City
- — inherits STATE
ZIP-level market 39111
- Home prices YoY
- 1.8%
- Active inventory
- 78
- Price-to-rent
- 5.1×
Monthly cashflow live
- Estimated rent
- $1,134 medium interval (Pro) →
- Mortgage (P&I)
- −$367
- Tax est. 1.5%
- −$88 /mo · $1,050/yr
- Insurance
- −$29
- HOA
- −$0
- Vacancy / Maint / Mgmt
- −$238
- Net cashflow
- $412
Break-even live
Sensitivity live
| Price | -10% $461 | -5% $436 | +0% $412 | +5% $388 | +10% $364 |
|---|---|---|---|---|---|
| Rent | -10% $323 | -5% $367 | +0% $412 | +5% $457 | +10% $502 |
| Rate | -1.0pp $448 | -0.5pp $430 | base $412 | +0.5pp $394 | +1.0pp $376 |
UW: 25.0% down · 7.5% · 30yr · 1.5% tax · 5.0% vac · 8.0% maint · 8.0% mgmt
Financing live
Cash to close
- Down payment
- $17,500
- Closing costs
- $2,100
- Reserves months
- —
- Total cash needed
- —
Loan-product check · same deal, 3 products live
Conventional
25% down · 7.5% · 30yr
- Down + closing
- —
- Monthly P&I
- —
- Monthly cashflow
- —
- DSCR
- —
- Eligible?
- —
Personal DTI + credit; lowest rate.
DSCR
20% down · 8.5% · 30yr
- Down + closing
- —
- Monthly P&I
- —
- Monthly cashflow
- —
- DSCR
- —
- Eligible?
- —
No personal income docs; deal must DSCR.
Hard money
10% down · 12.0% · 12mo
- Down + closing
- —
- Monthly P&I
- —
- Monthly cashflow
- —
- DSCR
- —
- Eligible?
- —
Short-term bridge; refi at stabilization.
Listing history 5 events
-
2026-05-26$70,000
-
2021-10-08historical
-
2021-10-04historical
-
2000-03-09$67,500
-
1999-12-12$67,500
ⓘ Source: listings_history table (triggers on properties + properties_extension) + one-shot
backfill from property_details.listing_events for pre-trigger history.
Nearby sold comps map
Loading sold comps map…
Walkable amenities ~0.75 mi
Loading nearby amenities…
Taxation est. · year 1
- Rental income
- $13,610
- − Mortgage interest
- −$3,921
- − Property taxes
- −$1,050
- − Insurance
- −$350
- − Repairs & maintenance
- −$1,089
- − Management
- −$1,089
- − Depreciation
- −$2,036
- Taxable income
- $4,075
- Est. tax owed @ 24.0%
- −$978
- After-tax cash flow
- $3,969/yr
For passive investors: Depreciation is non-cash, so a rental often shows a tax loss while cash-flowing — sheltering income. Rental losses are passive: they offset passive income freely, and up to $25,000/yr can offset ordinary (W-2) income if you actively participate and your MAGI is under $100k (phasing out to $0 by $150k); unused losses carry forward. On sale, claimed depreciation is recaptured at up to 25%, and gains may owe capital-gains tax (a 1031 exchange can defer both). Figures are a year-1 estimate at your 24.0% rate — not tax advice; consult a CPA.
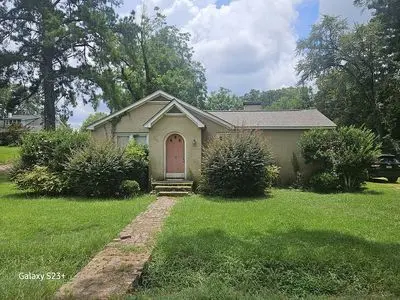
Condition & rehab AI · 1 photo
A fair condition home with moderate rehab needs, offering significant potential for improvement.
Repairs flagged
- Moderate siding — Aged appearance
- Minor landscaping — Some overgrown areas
Value-add opportunities
- Both paint exterior walls — Enhances curb appeal and value
- Both repair and paint siding — Improves appearance and value
- Both replace landscaping — Enhances curb appeal and value
Renovation cost estimate screening
| Repair item | Severity | Est. cost |
|---|---|---|
| siding · Aged appearance | Moderate | $3,000–15,000 |
| landscaping · Some overgrown areas | Minor | $500–3,000 |
| Total estimated repair cost · 2 items | $3,500–18,000 |
Value-add ROI direction
- Both paint exterior walls — Enhances curb appeal and value ↑
- Both repair and paint siding — Improves appearance and value ↑
- Both replace landscaping — Enhances curb appeal and value ↑
ⓘ Cost ranges are severity-bucket heuristics (US national rule-of-thumb). Get contractor quotes + a written scope before underwriting a rehab budget.
Schools (NCES district)
- District
- Simpson County School District
- NCES district ID
- 2803990
- Math proficiency
- 18% ▼ -14.00%
- Reading proficiency
- 24% ▼ -9.00%
- Median HH income
- $36,826
- Composite
- 17.46/100
- National rank
- #9063
- State rank
- #90 of 130 in MS
Livability — Magee
- Score
- 63/100
- State rank
- #158
- US rank
- #15438
Category grades
Schools grade is shown separately in the Schools card above.
Census & demographics
- Census place
- Magee, MS
- Population (ZIP)
- 8,927
Population outlook (Simpson County) Hauer SSP2
- Today (2025)
- 26,197 people
- By 2030
- 25,474 · -2.8%
- By 2040
- 23,811 · -9.1%
- By 2050
- 22,024 · -15.9%
- By 2075
- 17,701 · -32.4%
- By 2100
- 13,732 · -47.6%
Race, ethnicity, and origin ACS 2023
- Neighborhood character
- Predominantly White (67%)
- Race & ethnicity
- White 67% Black 28% Hispanic / Latino 4% Two or more races 2%
- Common ancestry
- Serbian 5% Slovak 1% Italian 1%
- Foreign-born
- 2% · Canada
- Languages at home
- 97% English-only · Spanish 3%
Political lean MEDSL · Simpson
- 2024 margin
- Solid R (+36.7) · D 31.4% · R 68.1%
- 2008→2024 swing
- -14.3pp toward R · 2008: -22.4pp · 2024: -36.7pp
- All cycles
- 2024: R+36.7 2020: R+30.4 2016: R+30.9 2012: R+22.1 2008: R+22.4
Not yet ingested
- Civics
- —
Market trends
- HPI YoY
- ▲ 2.90%
- Current HPI
- 161.8264
- Rent YoY
- —
- Metro
- —
- State GDP YoY
- —
- F500 in state
- 0
Price history
+3.7% since first listed5 events — show timeline
- 2026-05-26 Listed $70,000 FSBO.com
- 2021-10-08 Listing Removed — MLSU
- 2021-10-04 Listing Removed — MLSU
- 2000-03-09 Listed $67,500 MLSU
- 1999-12-12 Listed $67,500 MLSU
Cash-flow waterfall
monthlySold comps — $/sqft
last 12 mo · ≤1 miLoading sold comps…