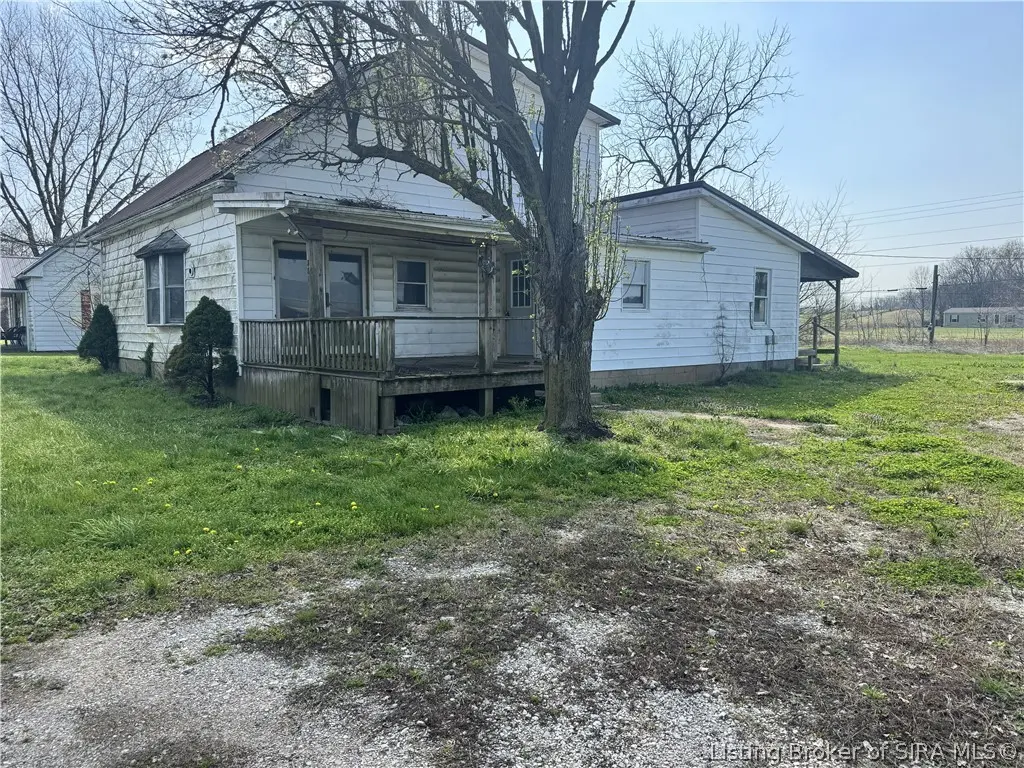
381 W Main St · Livonia, IN
Flood risk 4/10 · Minor
- FEMA flood zone
- X (unshaded)
- Chance of flooding over 30 yrs
- 0.2%
- Est. flood insurance / yr
- $507 – $1,088
Fire risk 1/10 · Minimal
- Est. fire insurance / yr
- $717 – $1,331
Heat risk 4/10 · Minor
- Hot days now (above 104°F)
- 7 days/yr
- Hot days in 30 yrs
- 19 days/yr
Wind risk 2/10 · Minimal
- Chance of severe wind over 30 yrs
- 4.0%
Air-quality risk 2/10 · Minimal
- Unhealthy air days now
- 1 days/yr
- Unhealthy air days in 30 yrs
- 2 days/yr
Risk factors via First Street. Map © Google.
Why this score? — see what drove the C+ grade
The composite is a weighted blend of 9 inputs, each scored 0–100. Each bar is that input's sub-score; the figure is the points it added to the 100-point composite (weight × sub-score).
- Cash flow +27.7/30.0
- DSCR +9.8/10.0
- ARV discount +7.5/15.0
- 1% rule +7.0/10.0
- Schools +3.5/10.0
- Livability +3.1/5.0
- Rent growth +2.5/5.0
- Condition / age +2.5/5.0
- Appreciation +0.0/10.0
$115,000
🖨 Deal sheet (PDF) 📄 Offer letter ✓ Due diligence
Listing remarks MLS
Classic Farmhouse Opportunity in the Heart of Livonia – Bring Your Vision. If you’ve been waiting for the right project with character, space, and unbeatable country views, this two-story farmhouse in the charming town of Livonia is ready for its next chapter. Set right along the highway, this property offers sweeping farmland and field scenery in every direction, the kind of peaceful backdrop that never gets old. A beautiful front porch welcomes you in, perfect for morning coffee, evening sunsets, and soaking in that slow-paced country lifestyle. Inside, you’ll find a large home with solid bones and strong structure, just waiting for the right person to bring it back to life. This is not a light cosmetic project—it needs significant updating and attention—but the opportunity is clear for someone with vision, skill, and a passion for restoring homes. Whether you're looking to renovate and resell, or build your own slice of country living from the ground up, this property offers the space, setting, and foundation to make it happen. Bring your tools, your ideas, and your imagination—this farmhouse is ready for its revival.
Key facts
- Solid bones
- Large home
- Strong structure
Tags
Neighborhood map
What this means for you Summary
Snapshot
- This is a 4-bed/1.0-bath single-family listed at $115k.
Deal economics
- At list price, monthly cash flow is $347 ($4k/yr) — positive.
- The deal already cash-flows at list — no discount required.
- Meets the 1% rule at list price ($1k rent vs $115k).
- Recommended offer: $108k (6.0% below list) — sets the bar for market timing.
Location & tenants
- Location reads 61/100 on livability (#491 in IN) — a middle-class / working-renter tenant base. Strengths: cost of living A+, housing A+; Watch: crime D+, health & safety D, schools F.
- West Washington School Corporation (rural): math 41% / reading 43% proficiency, ranked #125 of 301 in IN (top 42%) — families likely to look elsewhere, expect single-tenant / working-renter base with shorter leases.
- Market conditions: 15 active listings in the ZIP; 25 units permitted in Washington County in 2024 (0 in 5+ unit buildings).
Forward outlook
- Local home prices are declining (-3.0%/yr); year-one equity from $795 of loan paydown is wiped out by about $3k of value loss. Plan a longer hold.
- Washington County population projected at -22% by 2050 — secular population decline; favor cash flow + early exit over multi-decade hold.
- At projected returns (-3.0% appreciation + 3.0% rent growth), your $32k cash investment doubles in ~9 years — after that, you're playing with house money.
Negotiation context
- It's been on market 63 days — a 6% lower offer ($108k) is reasonable based on typical stale-listing flexibility.
Risks & watch-outs
- Watch-outs: built in 1950 — expect roof / HVAC / electrical / plumbing capex.
Questions for the listing agent
- It's been on market 63 days. Have you received any prior offers? Is the seller open to a 6% concession, seller financing, or rate buy-down credit?
- Built in 1950 — when were the roof, HVAC, electrical panel, plumbing, and water heater last replaced?
- Why hasn't it sold? Are there any deal-killer items the seller is aware of (foundation, flood, title, zoning, code violations)?
- Is there a deadline driving the sale (1031 exchange, divorce, estate, relocation)? That informs how much negotiation room exists.
- Schools are F-rated, which usually means shorter tenancies and higher turnover. Who's the typical renter profile here, and what's been the actual vacancy rate?
- Crime grade is D in this area — have there been break-ins, vandalism, or insurance claims at this property in the last 3 years? What carrier currently insures it and at what premium?
- What's the average days-on-market for RENTAL listings here right now (not sales)? A rising rental-DOM trend means longer vacancies and softer asking-rent achievability than the comps imply.
- What's the recent tenant-quality profile in this submarket — average credit score on applications, eviction rate, late-payment / NSF rate, and stable-employment percentage? A property-management company in the area should have these aggregated.
- How much new for-sale + rental construction is in the pipeline within 1–3 miles? Heavy new supply typically softens prices + rents 12–24 months out; constrained supply supports both.
Investment metrics
- 1% rule
- 1.20% ✓
- Cap rate
- 9.92%
- Cash-on-cash
- 12.95%
- DSCR
- 1.58
- GRM
- 6.9
CMA / ARV
No comps found within radius.
Projected returns pro-forma
-3.0% appreciation · 3.0% rent growth · sell at horizon
- IRR
- 2.8%
- Equity multiple
- 1.11×
- Total profit
- $3,486
- Equity at exit
- $17,147
- IRR
- 12.4%
- Equity multiple
- 1.98×
- Total profit
- $31,490
- Equity at exit
- $9,943
Cash invested: $32,200 (down + closing). Projections, not guarantees.
Landlord ↔ Tenant lean methodology
- Overall (STATE)
- 90 Strongly Landlord-Friendly
- State Indiana
- 90 Strongly Landlord-Friendly · R+11
- County
- — inherits STATE
- City
- — inherits STATE
ZIP-level market 47108
- Home prices YoY
- -18.8%
- Active inventory
- 15
- Price-to-rent
- 6.9×
Monthly cashflow live
- Estimated rent
- $1,380 medium interval (Pro) →
- Mortgage (P&I)
- −$603
- Tax from tax record
- −$92 /mo · $1,103/yr
- Insurance
- −$48
- HOA
- −$0
- Vacancy / Maint / Mgmt
- −$290
- Net cashflow
- $347
Break-even live
Sensitivity live
| Price | -10% $413 | -5% $380 | +0% $347 | +5% $315 | +10% $282 |
|---|---|---|---|---|---|
| Rent | -10% $238 | -5% $293 | +0% $347 | +5% $402 | +10% $457 |
| Rate | -1.0pp $405 | -0.5pp $377 | base $347 | +0.5pp $318 | +1.0pp $287 |
UW: 25.0% down · 7.5% · 30yr · 1.5% tax · 5.0% vac · 8.0% maint · 8.0% mgmt
Financing live
Cash to close
- Down payment
- $28,750
- Closing costs
- $3,450
- Reserves months
- —
- Total cash needed
- —
Loan-product check · same deal, 3 products live
Conventional
25% down · 7.5% · 30yr
- Down + closing
- —
- Monthly P&I
- —
- Monthly cashflow
- —
- DSCR
- —
- Eligible?
- —
Personal DTI + credit; lowest rate.
DSCR
20% down · 8.5% · 30yr
- Down + closing
- —
- Monthly P&I
- —
- Monthly cashflow
- —
- DSCR
- —
- Eligible?
- —
No personal income docs; deal must DSCR.
Hard money
10% down · 12.0% · 12mo
- Down + closing
- —
- Monthly P&I
- —
- Monthly cashflow
- —
- DSCR
- —
- Eligible?
- —
Short-term bridge; refi at stabilization.
Listing history 17 events
-
2026-06-19days on market $115,000 Active 63 DOM
-
2026-06-18days on market $115,000 Active 62 DOM
-
2026-06-17days on market $115,000 Active 61 DOM
-
2026-06-16days on market $115,000 Active 60 DOM
-
2026-06-15days on market $115,000 Active 59 DOM
-
2026-06-14days on market $115,000 Active 57 DOM
-
2026-06-12days on market $115,000 Active 56 DOM
-
2026-06-09days on market $115,000 Active 53 DOM
-
2026-06-08days on market $115,000 Active 52 DOM
-
2026-06-07days on market $115,000 Active 51 DOM
-
2026-06-05days on market $115,000 Active 49 DOM
-
2026-06-03days on market $115,000 Active 47 DOM
-
2026-06-02days on market $115,000 Active 46 DOM
-
2026-06-01days on market $115,000 Active 45 DOM
-
2026-05-31days on market $115,000 Active 44 DOM
-
2026-05-30days on market $115,000 Active 43 DOM
-
2026-04-17$115,000 Active 1174-char remark
Show marketing remark (1174 chars)
Classic Farmhouse Opportunity in the Heart of Livonia – Bring Your Vision. If you’ve been waiting for the right project with character, space, and unbeatable country views, this two-story farmhouse in the charming town of Livonia is ready for its next chapter. Set right along the highway, this property offers sweeping farmland and field scenery in every direction, the kind of peaceful backdrop that never gets old. A beautiful front porch welcomes you in, perfect for morning coffee, evening sunsets, and soaking in that slow-paced country lifestyle. Inside, you’ll find a large home with solid bones and strong structure, just waiting for the right person to bring it back to life. This is not a light cosmetic project—it needs significant updating and attention—but the opportunity is clear for someone with vision, skill, and a passion for restoring homes. Whether you're looking to renovate and resell, or build your own slice of country living from the ground up, this property offers the space, setting, and foundation to make it happen. Bring your tools, your ideas, and your imagination—this farmhouse is ready for its revival.
ⓘ Source: listings_history table (triggers on properties + properties_extension) + one-shot
backfill from property_details.listing_events for pre-trigger history.
Tax reassessment forecast IN · Partial reset (capped growth)
- Current annual tax
- $1,103 · $92/mo
- Projected year-2 tax
- $1,103 · $92/mo
- Expected delta
- $0/yr ($0/mo · 0.0%)
ⓘ Screening estimate from a state-policy table — verify with the county assessor before closing.
Climate risk First Street
- Flood 4/10 Moderate FEMA zone X (unshaded) · 20% chance over 30 yrs
- Wildfire 1/10 Low
- Heat 4/10 Moderate 7 d/yr ≥104°F today · 19 d/yr by 30 yrs out
- Wind 2/10 Low 4% chance of damaging wind over 30 yrs
- Air quality 2/10 Low 1 unhealthy d/yr today · 2 by 30 yrs out
Nearby sold comps map
Loading sold comps map…
Walkable amenities ~0.75 mi
Loading nearby amenities…
Taxation est. · year 1
- Rental income
- $16,563
- − Mortgage interest
- −$6,442
- − Property taxes
- −$1,103
- − Insurance
- −$575
- − Repairs & maintenance
- −$1,325
- − Management
- −$1,325
- − Depreciation
- −$3,345
- Taxable income
- $2,448
- Est. tax owed @ 24.0%
- −$587
- After-tax cash flow
- $3,583/yr
For passive investors: Depreciation is non-cash, so a rental often shows a tax loss while cash-flowing — sheltering income. Rental losses are passive: they offset passive income freely, and up to $25,000/yr can offset ordinary (W-2) income if you actively participate and your MAGI is under $100k (phasing out to $0 by $150k); unused losses carry forward. On sale, claimed depreciation is recaptured at up to 25%, and gains may owe capital-gains tax (a 1031 exchange can defer both). Figures are a year-1 estimate at your 24.0% rate — not tax advice; consult a CPA.
Schools (NCES district)
- District
- West Washington School Corporation
- NCES district ID
- 1812930
- Math proficiency
- 41% ▼ -15.00%
- Reading proficiency
- 43% ▼ -15.00%
- Median HH income
- $42,006
- Composite
- 35.39/100
- National rank
- #4949
- State rank
- #125 of 301 in IN
Livability — Livonia
- Score
- 61/100
- State rank
- #491
- US rank
- #17501
Category grades
Schools grade is shown separately in the Schools card above.
Census & demographics
- Census place
- Livonia, IN
- Population (ZIP)
- 2,003
Population outlook (Washington County) Hauer SSP2
- Today (2025)
- 26,460 people
- By 2030
- 25,498 · -3.6%
- By 2040
- 23,127 · -12.6%
- By 2050
- 20,505 · -22.5%
- By 2075
- 14,941 · -43.5%
- By 2100
- 10,453 · -60.5%
Race, ethnicity, and origin ACS 2023
- Neighborhood character
- Predominantly White (92%)
- Race & ethnicity
- White 92% Two or more races 5%
- Common ancestry
- Scottish 2% Lithuanian 2% Slovak 1%
Political lean MEDSL · Washington
- 2024 margin
- Solid R (+54.8) · D 21.7% · R 76.5% · Other 1.7%
- 2008→2024 swing
- -37.5pp toward R · 2008: -17.3pp · 2024: -54.8pp
- All cycles
- 2024: R+54.8 2020: R+52.1 2016: R+49.1 2012: R+24.4 2008: R+17.3
Not yet ingested
- Civics
- —
Market trends
- HPI YoY
- ▼ -42.69%
- Current HPI
- 184.4
- Rent YoY
- —
- Metro
- —
- State GDP YoY
- ▲ 2.90%
- F500 in state
- 18
Industry mix (Fortune 500 HQ in IN)
| Industry | F500 HQs | Revenue |
|---|---|---|
| Industrial Machinery | 2 | $37B |
|
||
| Healthcare | 1 | $177B |
|
||
| Pharmaceuticals | 1 | $45B |
|
||
| Metals / Steel | 1 | $18B |
|
||
| Agriculture | 1 | $17B |
|
||
| Packaging | 1 | $12B |
|
||
Price history
1 event — show timeline
- 2026-04-17 Listed $115,000 SIRA
Property tax history
+12.7%/yrLatest (2024): $1,103 · -28.7% YoY. Source: county tax records.
Cash-flow waterfall
monthlySold comps — $/sqft
last 12 mo · ≤1 miLoading sold comps…