 Fourplex
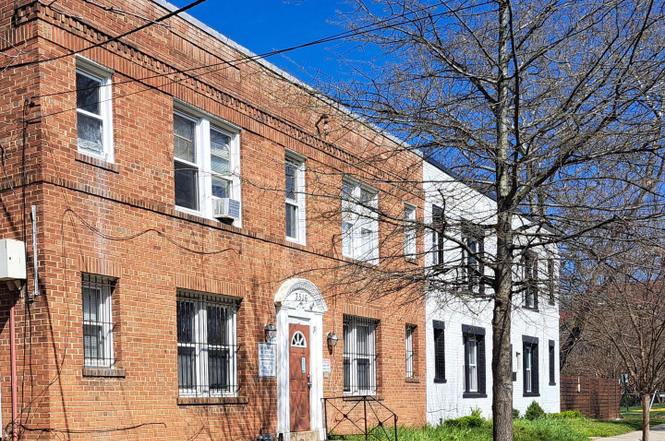
3516 Ely Pl SE · Washington, DC
Flood risk 1/10 · Minimal
- FEMA flood zone
- X (unshaded)
- Chance of flooding over 30 yrs
- 0.0%
- Est. flood insurance / yr
- $473 – $860
Fire risk 2/10 · Minimal
- Est. fire insurance / yr
- $631 – $1,173
Heat risk 8/10 · Major
- Hot days now (above 104°F)
- 7 days/yr
- Hot days in 30 yrs
- 15 days/yr
Wind risk 4/10 · Minor
- Chance of severe wind over 30 yrs
- 20.0%
Air-quality risk 4/10 · Minor
- Unhealthy air days now
- 4 days/yr
- Unhealthy air days in 30 yrs
- 5 days/yr
Risk factors via First Street. Map © Google.
Why this score? — see what drove the C+ grade
The composite is a weighted blend of 9 inputs, each scored 0–100. Each bar is that input's sub-score; the figure is the points it added to the 100-point composite (weight × sub-score).
- Cash flow +22.9/30.0
- ARV discount +15.0/15.0
- DSCR +7.3/10.0
- 1% rule +5.5/10.0
- Rent growth +4.0/5.0
- Livability +3.7/5.0
- Schools +3.6/10.0
- Condition / age +2.5/5.0
- Appreciation +0.0/10.0
$575,000
🖨 Deal sheet (PDF) 📄 Offer letter ✓ Due diligence
Multi-family units
County records classify this as Multi-Family (2-4 Unit). Listing-text estimate: 4 units. confirmed
Listing remarks MLS
SOLD AS-IS, ALL OFFER MUST HAVE EMD, PROOF OF FUNDS IF CASH OFFER, NO LETTERS OF INTENT, SELLER INSTRUCTION SHEET, LENDER LETTER.
Key facts
- Secured building
- 3,547 sq ft lot
- Built 1943
Tags
Property features AI
Finance
- Financial info: Assessed improvement value: $588,880; Assessed land value: $155,390; Total tax assessed value: $744,270; Tax year: 2024
Exterior
- Parking: On-street parking
- Utilities: Public water; Public sewer; Natural gas hot water; Natural gas heating
- Home design: Semi-detached property; Fee simple ownership
- Construction: Brick construction; Crawl space foundation; Building not winterized
- Exterior features: No tidal water on the lot; Soil type: Urban Land–Cristiana–Sunnysider
Interior
- Bedrooms: Four one-bedroom units (multi-unit property); One unit currently vacant
- Heating & cooling: Forced air heating; Window air conditioning units
- Interior features: Basement present (other type); Finished area above grade is 3,362; Unfinished area below grade is 300; Total below-grade area is 300
Neighborhood map
What this means for you Summary
Snapshot
- This is a 4 × 1-bed/1.0-bath units multifamily listed at $575k.
Deal economics
- At list price, monthly cash flow is $1k ($12k/yr) — positive. Per door: $252/mo.
- The deal already cash-flows at list — no discount required.
- Meets the 1% rule at list price ($6k rent vs $575k).
- Recommended offer: $506k (12.0% below list) — sets the bar for market timing.
- Cap rate 8.4% vs local median 2.5% in Washington — top-decile yield for the area; either an underpriced asset or a hidden risk that comps aren't pricing in. Stress-test before assuming the spread holds.
Location & tenants
- Location reads 73/100 on livability (#1 in DC) — a middle-class / working-renter tenant base. Strengths: amenities A+, commute A+, employment A+; Watch: crime F, cost of living F.
- District Of Columbia Public Schools (urban): math 33% / reading 40% proficiency, ranked #8 of 32 in DC (top 25%) — families likely to look elsewhere, expect single-tenant / working-renter base with shorter leases; 65% free/reduced lunch — lower-income household profile, screen leases tightly.
- Market conditions: Rents rising fast (+6.1%/yr); 281 active listings in the ZIP; 2 comparable units currently listed for rent nearby; 1,737 units permitted in District of Columbia in 2024 (1,506 in 5+ unit buildings).
- At $6,064/mo this rent would consume 125% of the median local household income ($58k/yr) (locally 5115% of renters already pay >50% of income on rent) — very limited rent-growth headroom before tenants either downsize or default.
Forward outlook
- Local home prices are declining (-3.0%/yr); year-one equity from $4k of loan paydown is wiped out by about $17k of value loss. Plan a longer hold.
- District of Columbia County population projected at +50% by 2050 — long-run rental-demand tailwind backs the buy-and-hold thesis.
- At projected returns (-3.0% appreciation + 6.1% rent growth), your $161k cash investment doubles in ~10 years — after that, you're playing with house money.
Negotiation context
- It's been on market 470 days — a 12% lower offer ($506k) is reasonable based on typical stale-listing flexibility.
- 7 sale attempts since 21y ago with the ask held roughly flat each time — persistent listings suggest the price (not the market) is what's stuck; bring a comps-based counter.
- Current owner paid $170k; list at $575k implies a 238% gain — meaningful room to come down on a strong offer.
Risks & watch-outs
- Watch-outs: built in 1943 — expect roof / HVAC / electrical / plumbing capex.
- Climate carrying-cost: extreme-heat days projected 7→15/yr by 2055 (HVAC capex compounding) — expect insurance premiums to compound above CPI over the hold.
Questions for the listing agent
- It's been on market 470 days. Have you received any prior offers? Is the seller open to a 12% concession, seller financing, or rate buy-down credit?
- Can we see the unit-by-unit rent roll, current vacancy, and any below-market leases? What's the average tenancy length?
- What capital expenditures (roof, boiler, parking lot, exteriors) have been made in the last 5 years, and what's planned in the next 2?
- Built in 1943 — when were the roof, HVAC, electrical panel, plumbing, and water heater last replaced?
- Why hasn't it sold? Are there any deal-killer items the seller is aware of (foundation, flood, title, zoning, code violations)?
- Is there a deadline driving the sale (1031 exchange, divorce, estate, relocation)? That informs how much negotiation room exists.
- Crime grade is F in this area — have there been break-ins, vandalism, or insurance claims at this property in the last 3 years? What carrier currently insures it and at what premium?
- What's the average days-on-market for RENTAL listings here right now (not sales)? A rising rental-DOM trend means longer vacancies and softer asking-rent achievability than the comps imply.
- What's the recent tenant-quality profile in this submarket — average credit score on applications, eviction rate, late-payment / NSF rate, and stable-employment percentage? A property-management company in the area should have these aggregated.
- How much new apartment / multifamily construction is in the pipeline within 1–3 miles? Heavy new supply (>2% of stock underway) typically softens rents 12–24 months out; light construction supports rent growth.
Investment metrics
- 1% rule
- 1.05% ✓
- Cap rate
- 8.40%
- Cash-on-cash
- 7.52%
- DSCR
- 1.33
- GRM
- 7.9
CMA / ARV
- ARV (on-the-fly)
- $790,070
- Comps found
- 4
Show comp detail 4 sales within ~0.75 mi
| Address | Dist | Beds/Ba | Sqft | Sold | Price | $/sf | Match |
|---|---|---|---|---|---|---|---|
| 405 34th St SE | 0.14mi | 8/— | 3,400 (+1%) | 10mo | $905,000 | $266 | 84 |
| 141 36th St NE | 0.55mi | 8/— | 3,400 (+1%) | 18mo | $799,999 | $235 | 57 |
| 3325 Ely SE | 0.19mi | 8/4.0 | 3,796 (+13%) | 18mo | $425,000 | $112 | 54 |
| 212 36th St NE | 0.66mi | 7/— (-1) | 3,400 (+1%) | 15mo | $546,915 | $161 | 50 |
Match score weights: distance 35% · size 25% · config 20% · recency 20%. Top-matched comps best support the ARV.
Projected returns pro-forma
-3.0% appreciation · 6.06% rent growth · sell at horizon
- IRR
- -1.5%
- Equity multiple
- 0.94×
- Total profit
- $-9,732
- Equity at exit
- $85,734
- IRR
- 11.1%
- Equity multiple
- 1.98×
- Total profit
- $158,204
- Equity at exit
- $49,715
Cash invested: $161,000 (down + closing). Projections, not guarantees.
Landlord ↔ Tenant lean methodology
- Overall (CITY)
- 0 Strongly Tenant-Friendly
- State District of Columbia
- 12 Strongly Tenant-Friendly · D+43
- County
- — inherits STATE
- City Washington
- 0 Strongly Tenant-Friendly · D+43
ZIP-level market 20019
- Rents YoY
- 6.1%
- Active inventory
- 281
- Price-to-rent
- 31.6×
Monthly cashflow live
- Estimated rent
- $6,064 high interval (Pro) →
- Mortgage (P&I)
- −$3,015
- Tax from tax record
- −$527 /mo · $6,326/yr
- Insurance
- −$240
- HOA
- −$0
- Vacancy / Maint / Mgmt
- −$1,273
- Net cashflow
- $1,008
Break-even live
Sensitivity live
| Price | -10% $1,334 | -5% $1,171 | +0% $1,008 | +5% $846 | +10% $683 |
|---|---|---|---|---|---|
| Rent | -10% $529 | -5% $769 | +0% $1,008 | +5% $1,248 | +10% $1,487 |
| Rate | -1.0pp $1,298 | -0.5pp $1,155 | base $1,008 | +0.5pp $859 | +1.0pp $708 |
4-unit breakdown (identical units grouped — click to expand)
| Units | Beds | Baths | Est. rent |
|---|---|---|---|
| 4× units | 1 | 1 | $6,064 |
| #1 | 1 | 1 | $1,516 |
| #2 | 1 | 1 | $1,516 |
| #3 | 1 | 1 | $1,516 |
| #4 | 1 | 1 | $1,516 |
| Total (4 units) | $6,064 | ||
UW: 25.0% down · 7.5% · 30yr · 1.5% tax · 5.0% vac · 8.0% maint · 8.0% mgmt
Financing live
Cash to close
- Down payment
- $143,750
- Closing costs
- $17,250
- Reserves months
- —
- Total cash needed
- —
Loan-product check · same deal, 3 products live
Conventional
25% down · 7.5% · 30yr
- Down + closing
- —
- Monthly P&I
- —
- Monthly cashflow
- —
- DSCR
- —
- Eligible?
- —
Personal DTI + credit; lowest rate.
DSCR
20% down · 8.5% · 30yr
- Down + closing
- —
- Monthly P&I
- —
- Monthly cashflow
- —
- DSCR
- —
- Eligible?
- —
No personal income docs; deal must DSCR.
Hard money
10% down · 12.0% · 12mo
- Down + closing
- —
- Monthly P&I
- —
- Monthly cashflow
- —
- DSCR
- —
- Eligible?
- —
Short-term bridge; refi at stabilization.
Rent comps 2 comps
| Address | Beds | Baths | Sqft | Rent | $/sqft | DOM | Units | Dist |
|---|---|---|---|---|---|---|---|---|
| 3305 Dubois Pl SE Washington, DC | 9.0 | 5.0 | 3900 | $7,500 | $1.92 | 15d | 1 | 0.25mi |
| 922 Ridge Rd SE Washington, DC | 8.0 | 4.0 | 4000 | $7,500 | $1.88 | 25d | 1 | 1.14mi |
Listing history 36 events
-
2026-06-21days on market $575,000 Active 470 DOM
-
2026-06-18days on market $575,000 Active 467 DOM
-
2026-06-17days on market $575,000 Active 466 DOM
-
2026-06-16days on market $575,000 Active 465 DOM
-
2026-06-15days on market $575,000 Active 464 DOM
-
2026-06-13days on market $575,000 Active 462 DOM
-
2026-06-09days on market $575,000 Active 458 DOM
-
2026-06-08days on market $575,000 Active 457 DOM
-
2026-06-07days on market $575,000 Active 456 DOM
-
2026-06-04days on market $575,000 Active 453 DOM
-
2026-06-03days on market $575,000 Active 452 DOM
-
2026-06-02days on market $575,000 Active 451 DOM
-
2026-06-01days on market $575,000 Active 450 DOM
-
2026-05-31days on market $575,000 Active 449 DOM
-
2025-07-14price $575,000
-
2025-03-08$599,900 Active
-
2009-05-07soldstatus $170,000 Sold 129-char remark
Show marketing remark (129 chars)
SOLD AS-IS, ALL OFFER MUST HAVE EMD, PROOF OF FUNDS IF CASH OFFER, NO LETTERS OF INTENT, SELLER INSTRUCTION SHEET, LENDER LETTER.
-
2009-05-07soldstatus $170,000 129-char remark
Show marketing remark (129 chars)
SOLD AS-IS, ALL OFFER MUST HAVE EMD, PROOF OF FUNDS IF CASH OFFER, NO LETTERS OF INTENT, SELLER INSTRUCTION SHEET, LENDER LETTER.
-
2009-03-09historical 129-char remark
Show marketing remark (129 chars)
SOLD AS-IS, ALL OFFER MUST HAVE EMD, PROOF OF FUNDS IF CASH OFFER, NO LETTERS OF INTENT, SELLER INSTRUCTION SHEET, LENDER LETTER.
-
2009-02-23historical 129-char remark
Show marketing remark (129 chars)
SOLD AS-IS, ALL OFFER MUST HAVE EMD, PROOF OF FUNDS IF CASH OFFER, NO LETTERS OF INTENT, SELLER INSTRUCTION SHEET, LENDER LETTER.
-
2009-02-18$199,000 129-char remark
Show marketing remark (129 chars)
SOLD AS-IS, ALL OFFER MUST HAVE EMD, PROOF OF FUNDS IF CASH OFFER, NO LETTERS OF INTENT, SELLER INSTRUCTION SHEET, LENDER LETTER.
-
2009-02-17$199,000 129-char remark
Show marketing remark (129 chars)
SOLD AS-IS, ALL OFFER MUST HAVE EMD, PROOF OF FUNDS IF CASH OFFER, NO LETTERS OF INTENT, SELLER INSTRUCTION SHEET, LENDER LETTER.
-
2009-01-16historical
-
2008-08-13
-
2008-08-04historical
-
2007-04-06
-
2006-04-10soldstatus $400,000
-
2006-04-04soldstatus $400,000
-
2006-02-22historical
-
2006-01-19$360,000
-
2006-01-19historical
-
2005-12-17
-
2002-12-31soldstatus $150,000
-
1999-08-25soldstatus $120,000
-
1995-02-28soldstatus $105,000
-
1982-06-04soldstatus $50,000
ⓘ Source: listings_history table (triggers on properties + properties_extension) + one-shot
backfill from property_details.listing_events for pre-trigger history.
Tax reassessment forecast DC · Partial reset (capped growth)
- Current annual tax
- $6,326 · $527/mo
- Projected year-2 tax
- $6,326 · $527/mo
- Expected delta
- $0/yr ($0/mo · 0.0%)
ⓘ Screening estimate from a state-policy table — verify with the county assessor before closing.
Climate risk First Street
- Flood 1/10 Low FEMA zone X (unshaded) · 0% chance over 30 yrs
- Wildfire 2/10 Low
- Heat 8/10 Severe 7 d/yr ≥104°F today · 15 d/yr by 30 yrs out
- Wind 4/10 Moderate 20% chance of damaging wind over 30 yrs
- Air quality 4/10 Moderate 4 unhealthy d/yr today · 5 by 30 yrs out
Nearby sold comps map
Loading sold comps map…
Walkable amenities ~0.75 mi
Loading nearby amenities…
Taxation est. · year 1
- Rental income
- $72,768
- − Mortgage interest
- −$32,209
- − Property taxes
- −$6,326
- − Insurance
- −$2,875
- − Repairs & maintenance
- −$5,821
- − Management
- −$5,821
- − Depreciation
- −$16,727
- Taxable income
- $2,988
- Est. tax owed @ 24.0%
- −$717
- After-tax cash flow
- $11,384/yr
For passive investors: Depreciation is non-cash, so a rental often shows a tax loss while cash-flowing — sheltering income. Rental losses are passive: they offset passive income freely, and up to $25,000/yr can offset ordinary (W-2) income if you actively participate and your MAGI is under $100k (phasing out to $0 by $150k); unused losses carry forward. On sale, claimed depreciation is recaptured at up to 25%, and gains may owe capital-gains tax (a 1031 exchange can defer both). Figures are a year-1 estimate at your 24.0% rate — not tax advice; consult a CPA.
Schools (NCES district)
- District
- District Of Columbia Public Schools
- NCES district ID
- 1100030
- Math proficiency
- 33% ▲ 3.00%
- Reading proficiency
- 40% ▲ 5.00%
- Median HH income
- $67,671
- Composite
- 35.84/100
- National rank
- #9606
- State rank
- #8 of 32 in DC
Livability — Washington
- Score
- 73/100
- State rank
- #1
- US rank
- #5327
Category grades
Schools grade is shown separately in the Schools card above.
Census & demographics
- Census place
- Washington, DC
- County
- District of Columbia · 671,873 people
- City population
- 671,873
- Metro
- Washington-Arlington-Alexandria, DC-VA-MD-WV
- Population (ZIP)
- 63,380
- Household income
- $58,296
- Rent vs Own
- Severe rent burden
- 5115.0
Population outlook (District of Columbia County) Hauer SSP2
- Today (2025)
- 821,926 people
- By 2030
- 899,517 · +9.4%
- By 2040
- 1,061,162 · +29.1%
- By 2050
- 1,231,493 · +49.8%
- By 2075
- 1,603,312 · +95.1%
- By 2100
- 1,847,141 · +124.7%
Race, ethnicity, and origin ACS 2023
- Neighborhood character
- Predominantly Black (87%)
- Race & ethnicity
- Black 87% Hispanic / Latino 7% Two or more races 4% White 2%
- Hispanic origin (detail)
- Mexican 1% Dominican 1%
- Foreign-born
- 6% · Canada
- Languages at home
- 91% English-only · Spanish 6% French/Haitian/Cajun 1%
Political lean MEDSL · District of Columbia
- 2024 margin
- Solid D (+86.1) · D 91.2% · R 5.1% · Other 3.8%
- 2008→2024 swing
- +0.1pp no change · 2008: 85.9pp · 2024: 86.1pp
- All cycles
- 2024: D+86.1 2020: D+86.8 2016: D+88.7 2012: D+84.2 2008: D+85.9
Not yet ingested
- Civics
- —
Market trends
- HPI YoY
- ▼ -416.91%
- Current HPI
- 326.4481
- Rent YoY
- ▲ 6.06%
- Metro
- Washington-Arlington-Alexandria, DC-VA-MD-WV
- State GDP YoY
- ▲ 1.33%
- F500 in state
- 6
Industry mix (Fortune 500 HQ in DC)
| Industry | F500 HQs | Revenue |
|---|---|---|
| Financial Services | 1 | $153B |
|
||
| Life Sciences / Industrials | 1 | $25B |
|
||
| Industrial Machinery | 1 | $8B |
|
||
Price history
+1050.0% since first listed22 events — show timeline
- 2025-07-14 Price Changed $575,000 BRIGHT MLS
- 2025-03-08 Listed $599,900 BRIGHT MLS
- 2009-05-07 Sold (MLS) $170,000 BRIGHT MLS
- 2009-05-07 Sold (MLS) $170,000 MRIS
- 2009-03-09 Delisted — MRIS
- 2009-02-23 Listing Removed — BRIGHT MLS
- 2009-02-18 Listed $199,000 MRIS
- 2009-02-17 Listed $199,000 BRIGHT MLS
- 2009-01-16 Delisted — MRIS
- 2008-08-13 Listed — MRIS
- 2008-08-04 Delisted — MRIS
- 2007-04-06 Listed — MRIS
- 2006-04-10 Sold (Public Records) $400,000 Public Records
- 2006-04-04 Sold (MLS) $400,000 MRIS
- 2006-02-22 Delisted — MRIS
- 2006-01-19 Delisted — MRIS
- 2006-01-19 Listed $360,000 MRIS
- 2005-12-17 Listed — MRIS
- 2002-12-31 Sold (Public Records) $150,000 Public Records
- 1999-08-25 Sold (Public Records) $120,000 Public Records
- 1995-02-28 Sold (Public Records) $105,000 Public Records
- 1982-06-04 Sold (Public Records) $50,000 Public Records
Property tax history
+4.4%/yrLatest (2025): $6,326 · +0.5% YoY. Source: county tax records.
Cash-flow waterfall
monthlySold comps — $/sqft
last 12 mo · ≤1 miLoading sold comps…