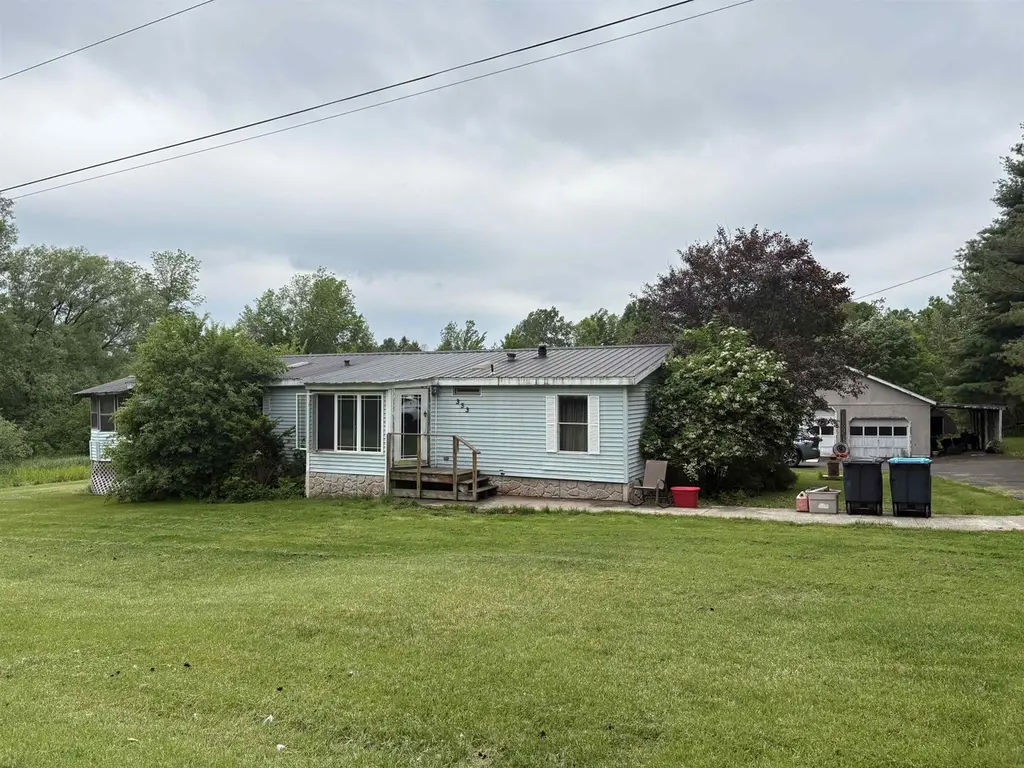
353 Barker Rd · Potsdam, NY
Flood risk 1/10 · Minimal
- FEMA flood zone
- X
- Chance of flooding over 30 yrs
- 0.0%
- Est. flood insurance / yr
- $507 – $1,088
Fire risk 3/10 · Minor
- Est. fire insurance / yr
- $691 – $1,283
Heat risk 2/10 · Minimal
- Hot days now (above 93°F)
- 7 days/yr
- Hot days in 30 yrs
- 15 days/yr
Wind risk 1/10 · Minimal
- Chance of severe wind over 30 yrs
- —
Air-quality risk 1/10 · Minimal
- Unhealthy air days now
- 0 days/yr
- Unhealthy air days in 30 yrs
- 0 days/yr
Risk factors via First Street. Map © Google.
Why this score? — see what drove the A- grade
The composite is a weighted blend of 9 inputs, each scored 0–100. Each bar is that input's sub-score; the figure is the points it added to the 100-point composite (weight × sub-score).
- Cash flow +30.0/30.0
- 1% rule +10.0/10.0
- DSCR +10.0/10.0
- Appreciation +10.0/10.0
- ARV discount +7.5/15.0
- Schools +5.0/10.0
- Livability +3.8/5.0
- Rent growth +2.5/5.0
- Condition / age +2.5/5.0
$59,000
🖨 Deal sheet (PDF) 📄 Offer letter ✓ Due diligence
Listing remarks MLS
Looking for a little country living? This 3 bedroom 2 bathroom home may just be it for you! Listed only at $66,000 on 2.2 acres of land. Home has been well maintained and taken care of. Call today for your personal showing.
Key facts
- Durable metal roof
- 2.2 acre lot
- 2 garage spots
Tags
Property features AI
Exterior
- Parking: Detached, paved 2-car garage
- Utilities: Private well water; Septic tank sewage
- Home design: Manufactured home; Single-story
- Construction: Vinyl siding
- Exterior features: Metal roof; 2.2-acre lot
Interior
- Kitchen: Gas cooktop; Refrigerator
- Bedrooms: Total of 5 rooms (includes bedroom count within room total)
- Flooring: Laminate; Tile; Vinyl
- Bathrooms: 1 full bathroom; 1 half bathroom
- Heating & cooling: Forced air heating; Kerosene heating
- Interior features: Pantry; Crawl space basement
- Laundry & utility: Washer and dryer on the main level; Electric water heater
Neighborhood map
What this means for you Summary
Snapshot
- This is a 3-bed/2.0-bath manufactured listed at $59k.
Deal economics
- At list price, monthly cash flow is $674 ($8k/yr) — positive.
- The deal already cash-flows at list — no discount required.
- Meets the 1% rule at list price ($1k rent vs $59k).
- Cap rate 20.0% vs local median 4.9% in Potsdam — top-decile yield for the area; either an underpriced asset or a hidden risk that comps aren't pricing in. Stress-test before assuming the spread holds.
Location & tenants
- Location reads 75/100 on livability (#249 in NY, #3,908 nationally) — a middle-class / working-renter tenant base. Strengths: amenities A+, cost of living A+, health & safety A+; Watch: crime F, commute F, employment F.
- Potsdam Central School District (town): math 53% / reading 66% proficiency, ranked #258 of 590 in NY (top 44%) — acceptable for families but not a draw, mixed tenant base, ~2y average lease.
- Zoned schools: Lawrence Avenue Elementary School (math 72% / reading 72%, grade A-, #378 of 2,108 statewide, top 20%, 551 students, 39% FRL); A A Kingston Middle School (math 27% / reading 54%, grade F, #409 of 729 statewide, top 56%, 368 students, 40% FRL); Potsdam Senior High School (math 92% / reading 92%, grade A+, #171 of 1,100 statewide, top 18%, 372 students, 37% FRL) — zoned schools at 39% FRL track the district average.
- Market conditions: 118 active listings in the ZIP; 215 units permitted in St. Lawrence County in 2024 (0 in 5+ unit buildings).
Forward outlook
- In year one you build about $6k of equity ($408 loan paydown + $6k appreciation (10.0% local appreciation)).
- St. Lawrence County population projected at -14% by 2050 — secular population decline; favor cash flow + early exit over multi-decade hold.
- At projected returns (10.0% appreciation + 3.0% rent growth), your $17k cash investment doubles in ~2 years — after that, you're playing with house money.
- By year 6, paydown + projected appreciation supports a ~$37k cash-out refi (75% LTV) — recoverable capital for the next deal without selling this one.
Negotiation context
- Only 9 days on market — expect competitive offers; lowballing is unlikely to land.
- 2 sale attempts since 11y ago with the ask held roughly flat each time — persistent listings suggest the price (not the market) is what's stuck; bring a comps-based counter.
Questions for the listing agent
- Is there a deadline driving the sale (1031 exchange, divorce, estate, relocation)? That informs how much negotiation room exists.
- Schools are A-rated — typically a magnet for longer-tenancy family renters. What's the average tenant stay here, and is there a school-zone premium baked into asking?
- Crime grade is F in this area — have there been break-ins, vandalism, or insurance claims at this property in the last 3 years? What carrier currently insures it and at what premium?
- What's the average days-on-market for RENTAL listings here right now (not sales)? A rising rental-DOM trend means longer vacancies and softer asking-rent achievability than the comps imply.
- What's the recent tenant-quality profile in this submarket — average credit score on applications, eviction rate, late-payment / NSF rate, and stable-employment percentage? A property-management company in the area should have these aggregated.
- How much new for-sale + rental construction is in the pipeline within 1–3 miles? Heavy new supply typically softens prices + rents 12–24 months out; constrained supply supports both.
Investment metrics
- 1% rule
- 2.32% ✓
- Cap rate
- 20.01%
- Cash-on-cash
- 48.98%
- DSCR
- 3.18
- GRM
- 3.6
CMA / ARV
No comps found within radius.
Projected returns pro-forma
10.0% appreciation · 3.0% rent growth · sell at horizon
- IRR
- 62.7%
- Equity multiple
- 5.55×
- Total profit
- $75,104
- Equity at exit
- $53,152
- IRR
- 56.3%
- Equity multiple
- 12.35×
- Total profit
- $187,434
- Equity at exit
- $114,624
Cash invested: $16,520 (down + closing). Projections, not guarantees.
Landlord ↔ Tenant lean methodology
- Overall (STATE)
- 15 Strongly Tenant-Friendly
- State New York
- 15 Strongly Tenant-Friendly · D+10
- County
- — inherits STATE
- City
- — inherits STATE
ZIP-level market 13676
- Home prices YoY
- 17.7%
- Active inventory
- 118
- Price-to-rent
- 3.6×
Monthly cashflow live
- Estimated rent
- $1,370 medium interval (Pro) →
- Mortgage (P&I)
- −$309
- Tax est. 1.5%
- −$74 /mo · $885/yr
- Insurance
- −$25
- HOA
- −$0
- Vacancy / Maint / Mgmt
- −$288
- Net cashflow
- $674
Break-even live
Sensitivity live
| Price | -10% $715 | -5% $695 | +0% $674 | +5% $654 | +10% $634 |
|---|---|---|---|---|---|
| Rent | -10% $566 | -5% $620 | +0% $674 | +5% $728 | +10% $783 |
| Rate | -1.0pp $704 | -0.5pp $689 | base $674 | +0.5pp $659 | +1.0pp $644 |
UW: 25.0% down · 7.5% · 30yr · 1.5% tax · 5.0% vac · 8.0% maint · 8.0% mgmt
Financing live
Cash to close
- Down payment
- $14,750
- Closing costs
- $1,770
- Reserves months
- —
- Total cash needed
- —
Loan-product check · same deal, 3 products live
Conventional
25% down · 7.5% · 30yr
- Down + closing
- —
- Monthly P&I
- —
- Monthly cashflow
- —
- DSCR
- —
- Eligible?
- —
Personal DTI + credit; lowest rate.
DSCR
20% down · 8.5% · 30yr
- Down + closing
- —
- Monthly P&I
- —
- Monthly cashflow
- —
- DSCR
- —
- Eligible?
- —
No personal income docs; deal must DSCR.
Hard money
10% down · 12.0% · 12mo
- Down + closing
- —
- Monthly P&I
- —
- Monthly cashflow
- —
- DSCR
- —
- Eligible?
- —
Short-term bridge; refi at stabilization.
Listing history 8 events
-
2026-06-16status $59,000 Pending 9 DOM
-
2026-06-15days on market $59,000 Active 9 DOM
-
2026-06-13days on market $59,000 Active 7 DOM
-
2026-06-12days on market $59,000 Active 6 DOM
-
2026-06-09days on market $59,000 Active 3 DOM
-
2026-06-08days on market $59,000 Active 2 DOM
-
2026-06-07remarks 692-char remark
-
2026-06-07$59,000 Active 1 DOM
ⓘ Source: listings_history table (triggers on properties + properties_extension) + one-shot
backfill from property_details.listing_events for pre-trigger history.
Climate risk First Street
- Flood 1/10 Low FEMA zone X · 0% chance over 30 yrs
- Wildfire 3/10 Moderate
- Heat 2/10 Low 7 d/yr ≥93°F today · 15 d/yr by 30 yrs out
- Wind 1/10 Low
- Air quality 1/10 Low 0 unhealthy d/yr today · 0 by 30 yrs out
Nearby sold comps map
Loading sold comps map…
Walkable amenities ~0.75 mi
Loading nearby amenities…
Taxation est. · year 1
- Rental income
- $16,437
- − Mortgage interest
- −$3,305
- − Property taxes
- −$885
- − Insurance
- −$295
- − Repairs & maintenance
- −$1,315
- − Management
- −$1,315
- − Depreciation
- −$1,716
- Taxable income
- $7,606
- Est. tax owed @ 24.0%
- −$1,825
- After-tax cash flow
- $6,267/yr
For passive investors: Depreciation is non-cash, so a rental often shows a tax loss while cash-flowing — sheltering income. Rental losses are passive: they offset passive income freely, and up to $25,000/yr can offset ordinary (W-2) income if you actively participate and your MAGI is under $100k (phasing out to $0 by $150k); unused losses carry forward. On sale, claimed depreciation is recaptured at up to 25%, and gains may owe capital-gains tax (a 1031 exchange can defer both). Figures are a year-1 estimate at your 24.0% rate — not tax advice; consult a CPA.
Schools (NCES district)
- District
- Potsdam Central School District
- NCES district ID
- 3623670
- Math proficiency
- 53% ▼ -2.00%
- Reading proficiency
- 66% ▲ 12.00%
- Median HH income
- $44,144
- Composite
- 50.05/100
- National rank
- #1915
- State rank
- #258 of 590 in NY
Livability — Potsdam
- Score
- 75/100
- State rank
- #249
- US rank
- #3908
Category grades
Schools grade is shown separately in the Schools card above.
Census & demographics
- City population
- 2,123
- Population (ZIP)
- 13,408
Population outlook (St. Lawrence County) Hauer SSP2
- Today (2025)
- 110,027 people
- By 2030
- 107,455 · -2.3%
- By 2040
- 100,492 · -8.7%
- By 2050
- 94,254 · -14.3%
- By 2075
- 80,175 · -27.1%
- By 2100
- 63,140 · -42.6%
Race, ethnicity, and origin ACS 2023
- Neighborhood character
- Predominantly White (90%)
- Race & ethnicity
- White 90% Two or more races 4% Asian 3% Hispanic / Latino 2% Black 2%
- Common ancestry
- Lithuanian 6% Romanian 4% Iranian 2%
- Foreign-born
- 7% · Canada, China
- Languages at home
- 94% English-only · Spanish 2% Other Indo-European 1% French/Haitian/Cajun 1%
Political lean MEDSL · St. Lawrence
- 2024 margin
- R (+18.0) · D 41.0% · R 59.0%
- 2008→2024 swing
- -34.3pp toward R · 2008: 16.3pp · 2024: -18.0pp
- All cycles
- 2024: R+18.0 2020: R+11.7 2016: R+10.8 2012: D+16.6 2008: D+16.3
Not yet ingested
- Civics
- —
Market trends
- HPI YoY
- ▲ 48.01%
- Current HPI
- 318.7704
- Rent YoY
- —
- Metro
- —
- State GDP YoY
- ▲ 2.60%
- F500 in state
- 92
Industry mix (Fortune 500 HQ in NY)
| Industry | F500 HQs | Revenue |
|---|---|---|
| Financial Services | 10 | $950B |
|
||
| Consumer Goods | 9 | $162B |
|
||
| Insurance | 4 | $225B |
|
||
| Telecommunications | 2 | $144B |
|
||
| Pharmaceuticals | 2 | $112B |
|
||
| Media / Entertainment | 2 | $69B |
|
||
Price history
-10.6% since first listed4 events — show timeline
- 2026-06-07 Listed $59,000 SLCMLS
- 2015-07-22 Sold (Public Records) $62,000 Public Records
- 2015-07-21 Sold (MLS) $62,000 SLCMLS
- 2015-05-20 Listed $66,000 SLCMLS
Property tax history
+5.9%/yrLatest (2025): $3,607 · +15.5% YoY. Source: county tax records.
Cash-flow waterfall
monthlySold comps — $/sqft
last 12 mo · ≤1 miLoading sold comps…