2798 Cincinnatus Rd · Cincinnatus, NY
Flood risk No data
- FEMA flood zone
- —
- Chance of flooding over 30 yrs
- —
- Est. flood insurance / yr
- —
Fire risk No data
- Est. fire insurance / yr
- —
Heat risk No data
- Hot days now (above threshold)
- —
- Hot days in 30 yrs
- —
Wind risk No data
- Chance of severe wind over 30 yrs
- —
Air-quality risk No data
- Unhealthy air days now
- —
- Unhealthy air days in 30 yrs
- —
Risk factors via First Street. Map © Google.
Why this score? — see what drove the C- grade
The composite is a weighted blend of 9 inputs, each scored 0–100. Each bar is that input's sub-score; the figure is the points it added to the 100-point composite (weight × sub-score).
- Cash flow +15.0/30.0
- Appreciation +10.0/10.0
- ARV discount +7.5/15.0
- 1% rule +5.0/10.0
- DSCR +5.0/10.0
- Schools +4.8/10.0
- Rent growth +2.5/5.0
- Livability +2.5/5.0
- Condition / age +2.5/5.0
$14,900
🖨 Deal sheet 📄 Offer letter ✓ Due diligence
Listing remarks
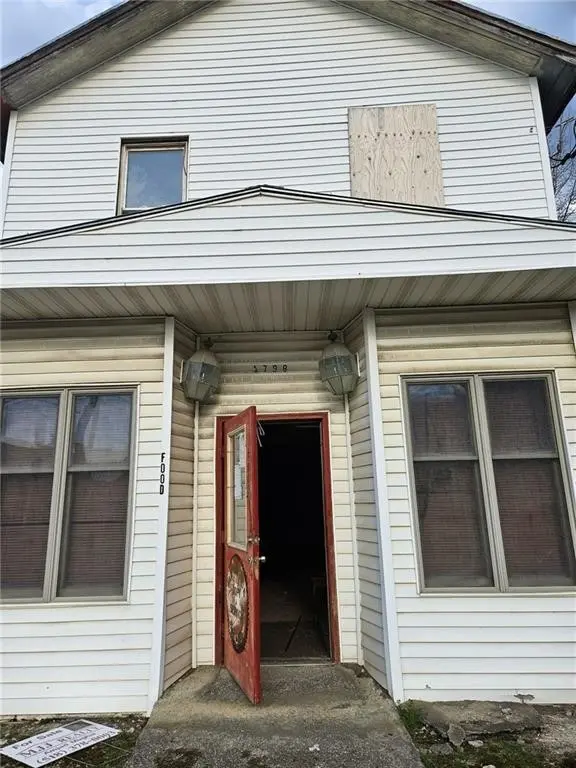
Welcome To 2798 Cincinnatus Road, Ideally Situated In The Heart Of Cincinnatus. This Expansive Property Offers Significant Potential, As It Is Zoned For Mixed Use. Providing You The Opportunity For Conversion Into A Single-Family Home, Duplex, Or The Continuation Of The Existing Storefront. The Second Floor Boasts A Generously-Sized Bedroom, A Colossal Living Room, And A Kitchen. Property Needs Rehab. As Is.
Key facts
- Zoned for mixed use
- Existing storefront
- 2,597 sq ft lot
Tags
Property features AI
Exterior
- Parking: No garage
- Utilities: Well water; Septic tank sewer
- Home design: Single-family residential home; Two levels / 2 stories; Fixer condition
- Construction: Wood siding exterior; Stone and slab foundation; Built prior to present listing (year not provided)
- Exterior features: Rectangular lot; Other lot features (see remarks); Lot dimensions approximately 35 x 74
Interior
- Flooring: Hardwood flooring; Tile flooring; Varied flooring types
- Bathrooms: 1 full bathroom; 1 half bathroom; One main-level bathroom
- Heating & cooling: No central heating (see remarks)
- Interior features: Other features (see remarks)
Neighborhood map
What this means for you Summary
Snapshot
- This is a 1-bed/1.5-bath single-family listed at $15k.
Deal economics
- At list price, monthly cash flow is $691 ($8k/yr) — positive.
- The deal already cash-flows at list — no discount required.
- Meets the 1% rule at list price ($1k rent vs $15k).
- Recommended offer: $15k (1.5% below list) — sets the bar for market timing.
Location & tenants
- Location reads: area grade C — affects rentability + tenant quality, not the cash-flow math above.
- Cincinnatus Central School District (rural): math 52% / reading 62% proficiency, ranked #287 of 590 in NY (top 49%) — acceptable for families but not a draw, mixed tenant base, ~2y average lease.
- Market conditions: 21 active listings in the ZIP; 45 units permitted in Cortland County in 2024 (12 in 5+ unit buildings).
Forward outlook
- In year one you build about $2k of equity ($103 loan paydown + $1k appreciation (10.0% local appreciation)).
- Cortland County population projected at -15% by 2050 — secular population decline; favor cash flow + early exit over multi-decade hold.
- At projected returns (10.0% appreciation + 3.0% rent growth), your $4k cash investment doubles in ~1 year — after that, you're playing with house money.
Negotiation context
- It's been on market 15 days — a 2% lower offer ($15k) is reasonable based on typical stale-listing flexibility.
- 2 sale attempts with the ask held roughly flat each time — persistent listings suggest the price (not the market) is what's stuck; bring a comps-based counter.
Risks & watch-outs
- Watch-outs: built in 1900 — expect roof / HVAC / electrical / plumbing capex.
Questions for the listing agent
- Built in 1900 — when were the roof, HVAC, electrical panel, plumbing, and water heater last replaced?
- Is there a deadline driving the sale (1031 exchange, divorce, estate, relocation)? That informs how much negotiation room exists.
- What's the average days-on-market for RENTAL listings here right now (not sales)? A rising rental-DOM trend means longer vacancies and softer asking-rent achievability than the comps imply.
- What's the recent tenant-quality profile in this submarket — average credit score on applications, eviction rate, late-payment / NSF rate, and stable-employment percentage? A property-management company in the area should have these aggregated.
- How much new for-sale + rental construction is in the pipeline within 1–3 miles? Heavy new supply typically softens prices + rents 12–24 months out; constrained supply supports both.
Investment metrics
- 1% rule
- 6.74% ✓
- Cap rate
- 61.93%
- Cash-on-cash
- 198.69%
- DSCR
- 9.84
- GRM
- 1.2
CMA / ARV
No comps found within radius.
Projected returns pro-forma
10.0% appreciation · 3.0% rent growth · sell at horizon
- IRR
- —
- Equity multiple
- 13.49×
- Total profit
- $52,126
- Equity at exit
- $13,423
- IRR
- —
- Equity multiple
- 29.51×
- Total profit
- $118,935
- Equity at exit
- $28,947
Cash invested: $4,172 (down + closing). Projections, not guarantees.
Landlord ↔ Tenant lean methodology
- Overall (STATE)
- 15 Strongly Tenant-Friendly
- State New York
- 15 Strongly Tenant-Friendly · D+10
- County
- — inherits STATE
- City
- — inherits STATE
ZIP-level market 13040
- Home prices YoY
- 3.8%
- Active inventory
- 21
- Price-to-rent
- 1.2×
Monthly cashflow live
- Estimated rent
- $1,005 medium interval (Pro) →
- Mortgage (P&I)
- −$78
- Tax est. 1.5%
- −$19 /mo · $224/yr
- Insurance
- −$6
- HOA
- −$0
- Vacancy / Maint / Mgmt
- −$211
- Net cashflow
- $691
Break-even live
UW: 25.0% down · 7.5% · 30yr · 1.5% tax · 5.0% vac · 8.0% maint · 8.0% mgmt
Financing live
Cash to close
- Down payment
- $3,725
- Closing costs
- $447
- Reserves months
- —
- Total cash needed
- —
Loan-product check · same deal, 3 products live
Conventional
25% down · 7.5% · 30yr
- Down + closing
- —
- Monthly P&I
- —
- Monthly cashflow
- —
- DSCR
- —
- Eligible?
- —
Personal DTI + credit; lowest rate.
DSCR
20% down · 8.5% · 30yr
- Down + closing
- —
- Monthly P&I
- —
- Monthly cashflow
- —
- DSCR
- —
- Eligible?
- —
No personal income docs; deal must DSCR.
Hard money
10% down · 12.0% · 12mo
- Down + closing
- —
- Monthly P&I
- —
- Monthly cashflow
- —
- DSCR
- —
- Eligible?
- —
Short-term bridge; refi at stabilization.
Listing history 11 events
-
2026-06-18days on market $14,900 Active 15 DOM
-
2026-06-17days on market $14,900 Active 14 DOM
-
2026-06-16days on market $14,900 Active 13 DOM
-
2026-06-15days on market $14,900 Active 12 DOM
-
2026-06-13days on market $14,900 Active 10 DOM
-
2026-06-12days on market $14,900 Active 9 DOM
-
2026-06-09days on market $14,900 Active 6 DOM
-
2026-06-08days on market $14,900 Active 5 DOM
-
2026-06-07days on market $14,900 Active 4 DOM
-
2026-06-07remarks 411-char remark
-
2026-06-07$14,900 Active 3 DOM
ⓘ Source: listings_history table (triggers on properties + properties_extension) + one-shot
backfill from property_details.listing_events for pre-trigger history.
Nearby sold comps map
Loading sold comps map…
Walkable amenities ~0.75 mi
Loading nearby amenities…
Taxation est. · year 1
- Rental income
- $12,057
- − Mortgage interest
- −$835
- − Property taxes
- −$224
- − Insurance
- −$74
- − Repairs & maintenance
- −$965
- − Management
- −$965
- − Depreciation
- −$433
- Taxable income
- $8,562
- Est. tax owed @ 24.0%
- −$2,055
- After-tax cash flow
- $6,235/yr
For passive investors: Depreciation is non-cash, so a rental often shows a tax loss while cash-flowing — sheltering income. Rental losses are passive: they offset passive income freely, and up to $25,000/yr can offset ordinary (W-2) income if you actively participate and your MAGI is under $100k (phasing out to $0 by $150k); unused losses carry forward. On sale, claimed depreciation is recaptured at up to 25%, and gains may owe capital-gains tax (a 1031 exchange can defer both). Figures are a year-1 estimate at your 24.0% rate — not tax advice; consult a CPA.
Schools (NCES district)
- District
- Cincinnatus Central School District
- NCES district ID
- 3607560
- Math proficiency
- 52% ▲ 9.00%
- Reading proficiency
- 62% ▲ 21.00%
- Median HH income
- $45,988
- Composite
- 48.17/100
- National rank
- #2173
- State rank
- #287 of 590 in NY
Livability — Cincinnatus
No livability data for this city. (Only ~50 U.S. cities are tracked.)
Census & demographics
- Population (ZIP)
- 2,683
Population outlook (Cortland County) Hauer SSP2
- Today (2025)
- 47,543 people
- By 2030
- 46,107 · -3.0%
- By 2040
- 43,122 · -9.3%
- By 2050
- 40,216 · -15.4%
- By 2075
- 34,717 · -27.0%
- By 2100
- 28,953 · -39.1%
Race, ethnicity, and origin ACS 2023
- Neighborhood character
- Predominantly White (95%)
- Race & ethnicity
- White 95% Two or more races 3% Hispanic / Latino 2%
- Common ancestry
- Iranian 4% Romanian 2% Polish 2%
- Foreign-born
- 1%
- Languages at home
- 97% English-only · German/W. Germanic 1% Spanish 1% Other Indo-European 1%
Political lean MEDSL · Cortland
- 2024 margin
- Lean R (+6.4) · D 46.8% · R 53.2%
- 2008→2024 swing
- -16.4pp toward R · 2008: 10.0pp · 2024: -6.4pp
- All cycles
- 2024: R+6.4 2020: R+1.9 2016: R+6.7 2012: D+8.8 2008: D+10.0
Not yet ingested
- Civics
- —
Market trends
- HPI YoY
- ▲ 11.68%
- Current HPI
- 316.2434
- Rent YoY
- —
- Metro
- —
- State GDP YoY
- ▲ 2.60%
- F500 in state
- 92
Industry mix (Fortune 500 HQ in NY)
| Industry | F500 HQs | Revenue |
|---|---|---|
| Financial Services | 10 | $950B |
|
||
| Consumer Goods | 9 | $162B |
|
||
| Insurance | 4 | $225B |
|
||
| Telecommunications | 2 | $144B |
|
||
| Pharmaceuticals | 2 | $112B |
|
||
| Media / Entertainment | 2 | $69B |
|
||
Price history
-62.7% since first listed7 events — show timeline
- 2026-06-03 Listed $14,900 IBRMLS
- 2025-10-08 Price Changed $18,900 IBRMLS
- 2025-08-21 Price Changed $19,900 IBRMLS
- 2025-08-01 Price Changed $23,900 IBRMLS
- 2025-07-10 Price Changed $24,900 IBRMLS
- 2025-04-27 Price Changed $29,900 IBRMLS
- 2025-03-03 Listed $39,900 IBRMLS
Cash-flow waterfall
monthlySold comps — $/sqft
last 12 mo · ≤1 miLoading sold comps…