703 W Benton St · Windsor, MO
Flood risk 1/10 · Minimal
- FEMA flood zone
- X (unshaded)
- Chance of flooding over 30 yrs
- 0.0%
- Est. flood insurance / yr
- $507 – $1,088
Fire risk 5/10 · Moderate
- Est. fire insurance / yr
- $1,054 – $1,958
Heat risk 4/10 · Minor
- Hot days now (above 106°F)
- 7 days/yr
- Hot days in 30 yrs
- 18 days/yr
Wind risk 2/10 · Minimal
- Chance of severe wind over 30 yrs
- —
Air-quality risk 2/10 · Minimal
- Unhealthy air days now
- 0 days/yr
- Unhealthy air days in 30 yrs
- 1 days/yr
Risk factors via First Street. Map © Google.
Why this score? — see what drove the C grade
The composite is a weighted blend of 9 inputs, each scored 0–100. Each bar is that input's sub-score; the figure is the points it added to the 100-point composite (weight × sub-score).
- Cash flow +21.7/30.0
- ARV discount +7.5/15.0
- DSCR +6.9/10.0
- Appreciation +5.0/10.0
- 1% rule +4.6/10.0
- Livability +3.2/5.0
- Schools +2.6/10.0
- Rent growth +2.5/5.0
- Condition / age +2.5/5.0
$135,500
🖨 Deal sheet (PDF) 📄 Offer letter ✓ Due diligence
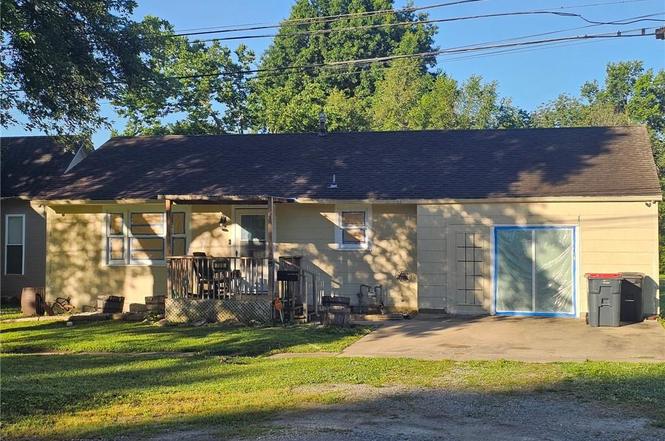
Listing remarks
Investor special/ Equity builder! Solid 2 bed 1 bath home! This home would make a great rental or perfect starter home for someone looking to build some equity!
Key facts
- 0.24 acre lot
Property features AI
Finance
- Financial info: Annual tax amount reported
Exterior
- Parking: Off-street parking
- Utilities: Public water; Public sewer
- Home design: Single-family residence; Residential property type; Ranch style
- Construction: Asbestos construction materials; Composition roof; Built approximately 51–75 years ago
- Exterior features: Lot approximately 10,296 square feet; Not in a flood plain
Interior
- Bedrooms: 2 bedrooms
- Bathrooms: 1 full bathroom
- Heating & cooling: Natural gas heating; Electric cooling
- Interior features: Ranch floor plan; Crawl space basement
Neighborhood map
What this means for you Summary
Snapshot
- This is a 2-bed/1.0-bath other listed at $136k.
Deal economics
- At list price, monthly cash flow is $209 ($3k/yr) — positive.
- The deal already cash-flows at list — no discount required.
- To meet the 1% rule (rent ≥ 1% of price), the offer needs to be $130k (3.7% below list).
- Recommended offer: $130k (3.7% below list) — sets the bar for 1% rule.
- Cap rate 8.1% vs local median 4.4% in Windsor — top-decile yield for the area; either an underpriced asset or a hidden risk that comps aren't pricing in. Stress-test before assuming the spread holds.
Location & tenants
- Location reads 65/100 on livability (#288 in MO) — a middle-class / working-renter tenant base. Strengths: cost of living A+, housing A+, crime B+; Watch: employment D+, amenities F, commute F.
- Henry County R-I (town): math 27% / reading 34% proficiency, ranked #270 of 324 in MO (top 83%) — families likely to look elsewhere, expect single-tenant / working-renter base with shorter leases.
- Zoned schools: Windsor Elem. (math 27% / reading 32%, grade F, #813 of 1,115 statewide, top 75%, 377 students, 58% FRL); Windsor High (math 27% / reading 37%, grade F, #356 of 521 statewide, top 71%, 326 students, 48% FRL).
- Market conditions: 1 active listings in the ZIP; 15 units permitted in Henry County in 2024 (0 in 5+ unit buildings).
Forward outlook
- In year one you build about $5k of equity ($937 loan paydown + $4k appreciation (3.0% local appreciation)).
- Henry County population projected at -18% by 2050 — secular population decline; favor cash flow + early exit over multi-decade hold.
- At projected returns (3.0% appreciation + 3.0% rent growth), your $38k cash investment doubles in ~5 years — after that, you're playing with house money.
- By year 7, paydown + projected appreciation supports a ~$32k cash-out refi (75% LTV) — recoverable capital for the next deal without selling this one.
Negotiation context
- Only 1 days on market — expect competitive offers; lowballing is unlikely to land.
Risks & watch-outs
- Watch-outs: built in 1957 — expect roof / HVAC / electrical / plumbing capex.
- Climate carrying-cost: moderate wildfire risk — expect insurance premiums to compound above CPI over the hold.
Questions for the listing agent
- Built in 1957 — when were the roof, HVAC, electrical panel, plumbing, and water heater last replaced?
- Is there a deadline driving the sale (1031 exchange, divorce, estate, relocation)? That informs how much negotiation room exists.
- Schools are F-rated, which usually means shorter tenancies and higher turnover. Who's the typical renter profile here, and what's been the actual vacancy rate?
- What's the average days-on-market for RENTAL listings here right now (not sales)? A rising rental-DOM trend means longer vacancies and softer asking-rent achievability than the comps imply.
- What's the recent tenant-quality profile in this submarket — average credit score on applications, eviction rate, late-payment / NSF rate, and stable-employment percentage? A property-management company in the area should have these aggregated.
- How much new for-sale + rental construction is in the pipeline within 1–3 miles? Heavy new supply typically softens prices + rents 12–24 months out; constrained supply supports both.
Investment metrics
- 1% rule
- 0.96% ✗
- Cap rate
- 8.14%
- Cash-on-cash
- 6.60%
- DSCR
- 1.29
- GRM
- 8.7
CMA / ARV
No comps found within radius.
Projected returns pro-forma
3.0% appreciation · 3.0% rent growth · sell at horizon
- IRR
- 13.6%
- Equity multiple
- 1.78×
- Total profit
- $29,569
- Equity at exit
- $60,927
- IRR
- 15.5%
- Equity multiple
- 3.28×
- Total profit
- $86,581
- Equity at exit
- $93,895
Cash invested: $37,940 (down + closing). Projections, not guarantees.
Landlord ↔ Tenant lean methodology
- Overall (STATE)
- 81 Strongly Landlord-Friendly
- State Missouri
- 81 Strongly Landlord-Friendly · R+10
- County
- — inherits STATE
- City
- — inherits STATE
ZIP-level market 64360
- Active inventory
- 1
- Price-to-rent
- 8.7×
Monthly cashflow live
- Estimated rent
- $1,305 medium interval (Pro) →
- Mortgage (P&I)
- −$711
- Tax from tax record
- −$55 /mo · $661/yr
- Insurance
- −$56
- HOA
- −$0
- Vacancy / Maint / Mgmt
- −$274
- Net cashflow
- $209
Break-even live
Sensitivity live
| Price | -10% $285 | -5% $247 | +0% $209 | +5% $170 | +10% $132 |
|---|---|---|---|---|---|
| Rent | -10% $106 | -5% $157 | +0% $209 | +5% $260 | +10% $312 |
| Rate | -1.0pp $277 | -0.5pp $243 | base $209 | +0.5pp $174 | +1.0pp $138 |
UW: 25.0% down · 7.5% · 30yr · 1.5% tax · 5.0% vac · 8.0% maint · 8.0% mgmt
Financing live
Cash to close
- Down payment
- $33,875
- Closing costs
- $4,065
- Reserves months
- —
- Total cash needed
- —
Loan-product check · same deal, 3 products live
Conventional
25% down · 7.5% · 30yr
- Down + closing
- —
- Monthly P&I
- —
- Monthly cashflow
- —
- DSCR
- —
- Eligible?
- —
Personal DTI + credit; lowest rate.
DSCR
20% down · 8.5% · 30yr
- Down + closing
- —
- Monthly P&I
- —
- Monthly cashflow
- —
- DSCR
- —
- Eligible?
- —
No personal income docs; deal must DSCR.
Hard money
10% down · 12.0% · 12mo
- Down + closing
- —
- Monthly P&I
- —
- Monthly cashflow
- —
- DSCR
- —
- Eligible?
- —
Short-term bridge; refi at stabilization.
Listing history 4 events
-
2026-06-18statusdays on market $135,500 Active 1 DOM
-
2026-06-17days on market $135,500 Coming Soon 2 DOM
-
2026-06-16remarks 160-char remark
-
2026-06-16$135,500 Coming Soon 1 DOM
ⓘ Source: listings_history table (triggers on properties + properties_extension) + one-shot
backfill from property_details.listing_events for pre-trigger history.
Tax reassessment forecast MO · Resets to sale price
- Current annual tax
- $661 · $55/mo
- Projected year-2 tax
- $1,314 · $110/mo
- Expected delta
- +$653/yr (+$54/mo · 98.9%)
ⓘ Screening estimate from a state-policy table — verify with the county assessor before closing.
Climate risk First Street
- Flood 1/10 Low FEMA zone X (unshaded) · 0% chance over 30 yrs
- Wildfire 5/10 Major
- Heat 4/10 Moderate 7 d/yr ≥106°F today · 18 d/yr by 30 yrs out
- Wind 2/10 Low
- Air quality 2/10 Low 0 unhealthy d/yr today · 1 by 30 yrs out
Nearby sold comps map
Loading sold comps map…
Walkable amenities ~0.75 mi
Loading nearby amenities…
Taxation est. · year 1
- Rental income
- $15,659
- − Mortgage interest
- −$7,590
- − Property taxes
- −$661
- − Insurance
- −$678
- − Repairs & maintenance
- −$1,253
- − Management
- −$1,253
- − Depreciation
- −$3,942
- Taxable income
- $283
- Est. tax owed @ 24.0%
- −$68
- After-tax cash flow
- $2,437/yr
For passive investors: Depreciation is non-cash, so a rental often shows a tax loss while cash-flowing — sheltering income. Rental losses are passive: they offset passive income freely, and up to $25,000/yr can offset ordinary (W-2) income if you actively participate and your MAGI is under $100k (phasing out to $0 by $150k); unused losses carry forward. On sale, claimed depreciation is recaptured at up to 25%, and gains may owe capital-gains tax (a 1031 exchange can defer both). Figures are a year-1 estimate at your 24.0% rate — not tax advice; consult a CPA.
Schools (NCES district)
- District
- Henry County R-I
- NCES district ID
- 2932110
- Math proficiency
- 27% ▲ 3.00%
- Reading proficiency
- 34% ▲ 2.00%
- Median HH income
- $38,839
- Composite
- 25.53/100
- National rank
- #7434
- State rank
- #270 of 324 in MO
Livability — Windsor
- Score
- 65/100
- State rank
- #288
- US rank
- #13335
Category grades
Schools grade is shown separately in the Schools card above.
Census & demographics
- Census place
- Windsor, MO
Population outlook (Henry County) Hauer SSP2
- Today (2025)
- 20,584 people
- By 2030
- 19,839 · -3.6%
- By 2040
- 18,305 · -11.1%
- By 2050
- 16,893 · -17.9%
- By 2075
- 14,285 · -30.6%
- By 2100
- 11,905 · -42.2%
Not yet ingested
- Political lean
- —
- Race & ethnicity
- —
- Common origin
- —
- Civics
- —
Market trends
- HPI YoY
- —
- Current HPI
- —
- Rent YoY
- —
- Metro
- —
- State GDP YoY
- ▲ 1.84%
- F500 in state
- 20
Industry mix (Fortune 500 HQ in MO)
| Industry | F500 HQs | Revenue |
|---|---|---|
| Healthcare | 1 | $163B |
|
||
| Insurance | 1 | $21B |
|
||
| Industrial Technology | 1 | $17B |
|
||
| Retail | 1 | $16B |
|
||
| Industrial Distribution | 1 | $10B |
|
||
| Utilities | 1 | $9B |
|
||
Price history
+201.1% since first listed4 events — show timeline
- 2026-06-15 Coming Soon $135,500 Heartland MLS as Distributed by MLS Grid
- 2005-06-10 Sold (Public Records) — Public Records
- 2004-04-02 Sold (MLS) — Heartland MLS as Distributed by MLS Grid
- 2003-12-13 Listed $45,000 Heartland MLS as Distributed by MLS Grid
Property tax history
+2.7%/yrLatest (2025): $661 · +4.0% YoY. Source: county tax records.
Cash-flow waterfall
monthlySold comps — $/sqft
last 12 mo · ≤1 miLoading sold comps…