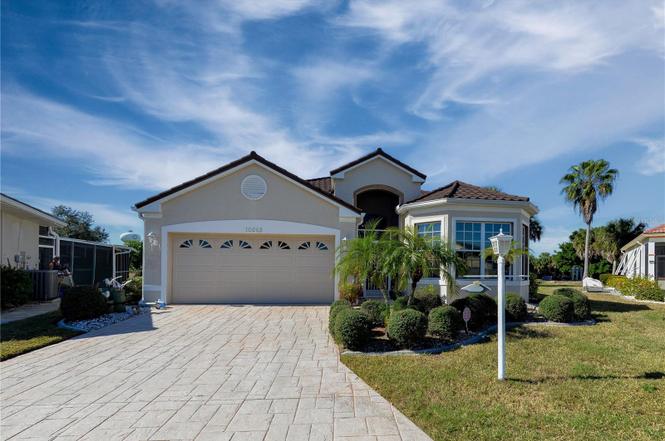
10263 Shadow Run Ct · Punta Gorda, FL
Flood risk 8/10 · Major
- FEMA flood zone
- X (shaded)
- Chance of flooding over 30 yrs
- 0.97%
- Est. flood insurance / yr
- $507 – $1,088
Fire risk 4/10 · Minor
- Est. fire insurance / yr
- $947 – $1,759
Heat risk 10/10 · Severe
- Hot days now (above 107°F)
- 7 days/yr
- Hot days in 30 yrs
- 28 days/yr
Wind risk 10/10 · Severe
- Chance of severe wind over 30 yrs
- 99.0%
Air-quality risk 3/10 · Minor
- Unhealthy air days now
- 2 days/yr
- Unhealthy air days in 30 yrs
- 2 days/yr
Risk factors via First Street. Map © Google.
Why this score? — see what drove the D+ grade
The composite is a weighted blend of 9 inputs, each scored 0–100. Each bar is that input's sub-score; the figure is the points it added to the 100-point composite (weight × sub-score).
- ARV discount +15.0/15.0
- Cash flow +13.6/30.0
- Schools +4.6/10.0
- DSCR +4.1/10.0
- Livability +3.8/5.0
- 1% rule +3.6/10.0
- Rent growth +2.5/5.0
- Condition / age +2.5/5.0
- Appreciation +0.0/10.0
$315,000
🖨 Deal sheet (PDF) 📄 Offer letter ✓ Due diligence
Listing remarks
One or more photo(s) has been virtually staged. MOTIVATED SELLERS - RECENT PRICE IMPROVEMENT. We invite you to discover this well-positioned 3-bedroom, 2-bath home in the highly desirable, guard-gated Seminole Lakes Golf & Country Club in Punta Gorda, Florida. Tucked away at the end of a quiet cul-de-sac and overlooking the 16th fairway, this home offers a peaceful, resort-style setting with stunning sunsets and abundant wildlife views from your private all-season Florida room. Seminole Lakes is known for its beautifully maintained grounds, 8 freshwater lakes, and convenient lifestyle—just minutes to shopping, dining, downtown Punta Gorda, I-75, and U. S. 41. Residents enjoy a l
Key facts
- Gated community
- Open floor plan
- Cul-de-sac
Tags
Property features AI
Finance
- Other: Lease restrictions apply
- Financial info: Total monthly HOA: $152 ($1,824 annual)
- HOA & community: Has HOA with monthly fee of $152; Association approval required; Association fee includes 24-hour guard, pool, private road, security, and other amenities; Community features: clubhouse, golf (golf carts OK), pool, sidewalks, tennis courts; Pets allowed (cats and dogs)
Exterior
- Parking: Attached 2-car garage (18 x 20) with garage door opener
- Security: Gated community
- Utilities: Public water; Public sewer; Cable available; Electricity connected; Sewer connected; Water connected; Underground utilities; Irrigation equipment
- Home design: Single family residence; One-story home; East-facing
- Construction: Block and stucco construction; Metal roof; Slab foundation; Completed condition; Built as residential single family
- Exterior features: Covered, enclosed patio/porch; Private mailbox; Sliding doors; Mature landscaping; On golf course; Paved surfaces; Cul-de-sac lot; Landscaped
Interior
- Kitchen: Convection oven; Dishwasher; Disposal; Ice maker; Microwave; Range; Refrigerator; Eat-in kitchen area
- Bedrooms: 3 bedrooms (located on first floor)
- Flooring: Tile flooring; Wood flooring
- Bathrooms: 2 full bathrooms
- Heating & cooling: Electric heating; Central air conditioning
- Interior features: Ceiling fans; Eat-in kitchen; High ceilings; Kitchen/family room combo; Living room/dining room combo; Open floorplan; Thermostat; Walk-in closets; Window treatments; Blinds and shades
- Laundry & utility: Washer and dryer hookups inside; Laundry room; Electric dryer hookup; Electric water heater
Neighborhood map
What this means for you Summary
Snapshot
- This is a 3-bed/2.0-bath single-family listed at $315k.
Deal economics
- At list price, monthly cash flow is $-52 ($-623/yr) — negative.
- To cash-flow at today's rent, offer at most $306k (2.9% below list).
- To meet the 1% rule (rent ≥ 1% of price), the offer needs to be $272k (13.7% below list).
- Recommended offer: $272k (13.7% below list) — sets the bar for 1% rule.
- Cap rate 6.3% vs local median 2.8% in Punta Gorda — top-decile yield for the area; either an underpriced asset or a hidden risk that comps aren't pricing in. Stress-test before assuming the spread holds.
Location & tenants
- Location reads 76/100 on livability (#225 in FL, #3,567 nationally) — a middle-class / working-renter tenant base. Strengths: crime A+, health & safety A+, housing B; Watch: cost of living D+, amenities D-, commute F.
- Charlotte (suburban): math 54% / reading 54% proficiency, ranked #22 of 73 in FL (top 30%) — acceptable for families but not a draw, mixed tenant base, ~2y average lease.
- Zoned schools: East Elementary School (math 67% / reading 68%, grade B+, #435 of 2,144 statewide, top 21%, 761 students, 52% FRL); Punta Gorda Middle School (math 54% / reading 52%, grade C+, #209 of 571 statewide, top 37%, 1,120 students, 41% FRL); Charlotte High School (math 44% / reading 46%, grade D-, #228 of 667 statewide, top 35%, 1,994 students, 41% FRL).
- Market conditions: 1490 active listings in the ZIP; 13 comparable units currently listed for rent nearby; rentals at typical pace (median 23d on market — plan ~3-4 weeks tenant-placement turnaround); solid renter incomes; 4,585 units permitted in Charlotte County in 2024 (703 in 5+ unit buildings).
- This rent runs 42% of the median local income ($77k/yr) — at the standard rent-burdened threshold; future hikes will face affordability resistance.
Forward outlook
- Local home prices are declining (-3.0%/yr); year-one equity from $2k of loan paydown is wiped out by about $9k of value loss. Plan a longer hold.
- Charlotte County population projected at +24% by 2050 — long-run rental-demand tailwind backs the buy-and-hold thesis.
Negotiation context
- It's been on market 146 days — a 12% lower offer ($277k) is reasonable based on typical stale-listing flexibility.
- 2 sale attempts; this cycle's ask has dropped $34k (10%) from the opening price — seller is motivated, your offer sets the floor, not the list.
- Current owner paid $244k; 29% above their basis — modest negotiation headroom, anchor on the comps not their cost.
Risks & watch-outs
- Watch-outs: flood insurance adds $66/mo.
- Climate carrying-cost: severe flood risk; severe wind risk, 99% chance of damaging wind over 30y; extreme-heat days projected 7→28/yr by 2055 (HVAC capex compounding) — expect insurance premiums to compound above CPI over the hold.
Questions for the listing agent
- What do current leases actually rent for vs. the listed asking? Can we see a recent rent roll and the last 12 months of T-12 income?
- It's been on market 146 days. Have you received any prior offers? Is the seller open to a 14% concession, seller financing, or rate buy-down credit?
- What's the actual annual flood-insurance premium (NFIP or private), and is the property in a SFHA with mandatory coverage?
- What does the HOA fee cover, when was the last increase, and are there any pending special assessments or reserve-fund shortfalls?
- Why hasn't it sold? Are there any deal-killer items the seller is aware of (foundation, flood, title, zoning, code violations)?
- Is there a deadline driving the sale (1031 exchange, divorce, estate, relocation)? That informs how much negotiation room exists.
- Schools are A-rated — typically a magnet for longer-tenancy family renters. What's the average tenant stay here, and is there a school-zone premium baked into asking?
- The area grade is low — what's the realistic commute time and amenity access for the typical tenant pool here? Any planned neighborhood developments (good or bad) we should know about?
- What's the average days-on-market for RENTAL listings here right now (not sales)? A rising rental-DOM trend means longer vacancies and softer asking-rent achievability than the comps imply.
- What's the recent tenant-quality profile in this submarket — average credit score on applications, eviction rate, late-payment / NSF rate, and stable-employment percentage? A property-management company in the area should have these aggregated.
- How much new for-sale + rental construction is in the pipeline within 1–3 miles? Heavy new supply typically softens prices + rents 12–24 months out; constrained supply supports both.
Investment metrics
- 1% rule
- 0.86% ✗
- Cap rate
- 6.35%
- Cash-on-cash
- 0.20%
- DSCR
- 1.01
- GRM
- 9.7
CMA / ARV
- ARV (on-the-fly)
- $387,100
- Comps found
- 10
Show comp detail 10 sales within ~0.75 mi
| Address | Dist | Beds/Ba | Sqft | Sold | Price | $/sf | Match |
|---|---|---|---|---|---|---|---|
| 26244 Stillwater Cir | 0.20mi | 3/2.0 | 1,965 (-0%) | 1mo | $340,000 | $173 | 89 |
| 26243 Stillwater Cir | 0.20mi | 2/2.0 (-1) | 1,879 (-5%) | 2mo | $385,000 | $205 | 76 |
| 2910 Acline Rd | 0.29mi | 3/2.0 | 2,022 (+2%) | 12mo | $283,000 | $140 | 72 |
| 26241 Feathersound Dr | 0.56mi | 3/2.0 | 1,982 (+0%) | 4mo | $350,000 | $177 | 70 |
| 7101 N Plum Tree | 0.61mi | 3/2.0 | 1,896 (-4%) | 13mo | $519,000 | $274 | 54 |
| 433 Scarlet Sage | 0.68mi | 3/2.0 | 1,952 (-1%) | 15mo | $355,000 | $182 | 54 |
| 26165 Feathersound Dr | 0.53mi | 3/2.0 | 2,214 (+12%) | 5mo | $449,000 | $203 | 51 |
| 7130 Scarlet Sage Ct | 0.61mi | 3/2.0 | 2,246 (+14%) | 4mo | $440,000 | $196 | 45 |
| 744 Monaco Dr | 0.71mi | 3/2.0 | 2,246 (+14%) | 4mo | $500,000 | $223 | 40 |
| 757 Monaco Dr | 0.67mi | 3/2.0 | 1,708 (-14%) | 16mo | $299,900 | $176 | 33 |
Match score weights: distance 35% · size 25% · config 20% · recency 20%. Top-matched comps best support the ARV.
Projected returns pro-forma
-3.0% appreciation · 3.0% rent growth · sell at horizon
- IRR
- -17.4%
- Equity multiple
- 0.38×
- Total profit
- $-54,299
- Equity at exit
- $46,968
- IRR
- -9.4%
- Equity multiple
- 0.42×
- Total profit
- $-51,323
- Equity at exit
- $27,235
Cash invested: $88,200 (down + closing). Projections, not guarantees.
Landlord ↔ Tenant lean methodology
- Overall (STATE)
- 87 Strongly Landlord-Friendly
- State Florida
- 87 Strongly Landlord-Friendly · R+3
- County
- — inherits STATE
- City
- — inherits STATE
ZIP-level market 33955
- Home prices YoY
- -24.5%
- Active inventory
- 1490
- Price-to-rent
- 9.7×
Monthly cashflow live
- Estimated rent
- $2,717 high interval (Pro) →
- Mortgage (P&I)
- −$1,652
- Tax from tax record
- −$197 /mo · $2,360/yr
- Insurance
- −$131
- Flood insurance flood zone
- −$66 /mo · $798/yr
- HOA
- −$152
- Vacancy / Maint / Mgmt
- −$571
- Net cashflow
- $-52
Break-even live
Sensitivity live
| Price | -10% $126 | -5% $37 | +0% $-52 | +5% $-141 | +10% $-230 |
|---|---|---|---|---|---|
| Rent | -10% $-267 | -5% $-159 | +0% $-52 | +5% $55 | +10% $163 |
| Rate | -1.0pp $107 | -0.5pp $28 | base $-52 | +0.5pp $-134 | +1.0pp $-217 |
UW: 25.0% down · 7.5% · 30yr · 1.5% tax · 5.0% vac · 8.0% maint · 8.0% mgmt
Financing live
Cash to close
- Down payment
- $78,750
- Closing costs
- $9,450
- Reserves months
- —
- Total cash needed
- —
Loan-product check · same deal, 3 products live
Conventional
25% down · 7.5% · 30yr
- Down + closing
- —
- Monthly P&I
- —
- Monthly cashflow
- —
- DSCR
- —
- Eligible?
- —
Personal DTI + credit; lowest rate.
DSCR
20% down · 8.5% · 30yr
- Down + closing
- —
- Monthly P&I
- —
- Monthly cashflow
- —
- DSCR
- —
- Eligible?
- —
No personal income docs; deal must DSCR.
Hard money
10% down · 12.0% · 12mo
- Down + closing
- —
- Monthly P&I
- —
- Monthly cashflow
- —
- DSCR
- —
- Eligible?
- —
Short-term bridge; refi at stabilization.
Rent comps 13 comps
| Address | Beds | Baths | Sqft | Rent | $/sqft | DOM | Units | Dist |
|---|---|---|---|---|---|---|---|---|
| 26162 Stillwater Cir Punta Gorda, FL | 2.0 | 2.0 | 1266 | $2,000 | $1.58 | 23d | 1 | 0.39mi |
| 9489 Turtle Grass Cir Punta Gorda, FL | 4.0 | 2.0 | 1828 | $2,500 | $1.37 | 15d | 1 | 0.69mi |
| 3845 Albacete Cir #50 Punta Gorda, FL | 2.0 | 2.0 | 1451 | $2,200 | $1.52 | 23d | 1 | 0.82mi |
| 3800 Tripoli Blvd #35 Punta Gorda, FL | 2.0 | 2.0 | 1451 | $4,200 | $2.89 | 23d | 1 | 0.87mi |
| 26120 Jones Loop Rd Punta Gorda, FL | 3.0 | 1.0–2.0 | 1105 | $2,275 | $2.06 | 15d | 27 | 0.99mi |
| 3701 Albacete Cir #98 Punta Gorda, FL | 2.0 | 2.0 | 1451 | $3,250 | $2.24 | 23d | 1 | 1.13mi |
| 7361 S Plum Tree Punta Gorda, FL | 3.0 | 2.0 | 1373 | $1,900 | $1.38 | 23d | 1 | 1.19mi |
| 9975 Bishop Creek Way Punta Gorda, FL | 3.0 | 2.0 | 1899 | $2,300 | $1.21 | 23d | 1 | 1.19mi |
| 3900 Madrid Ct Punta Gorda, FL | 3.0 | 2.5 | 2362 | $3,000 | $1.27 | 23d | 1 | 1.22mi |
| 9984 Spring Gulch Ln Punta Gorda, FL | 3.0 | 2.0 | 1507 | $1,849 | $1.23 | 23d | 1 | 1.24mi |
| 9996 Spring Gulch Ln Punta Gorda, FL | 4.0 | 2.0 | 1950 | $1,895 | $0.97 | 23d | 1 | 1.24mi |
| 3836 Paola Dr Punta Gorda, FL | 3.0 | 2.5 | 2558 | $5,000 | $1.95 | 23d | 1 | 1.34mi |
| 3500 Mondovi Ct #811 Punta Gorda, FL | 3.0 | 2.0 | 1596 | $3,200 | $2.01 | 23d | 1 | 1.44mi |
HOA detail
- Monthly dues
- $152 · $1,824/yr
- Likely covers
- waterlandscapingsecurity
Listing history 10 events
-
2026-05-16status Pending
-
2026-03-02price $315,000
-
2026-01-25price $335,000
-
2025-12-21$349,000 Active
-
2025-09-29historical
-
2025-08-19price $370,000
-
2025-05-22$385,000 Active
-
2003-11-22soldstatus $244,000
-
1999-07-19soldstatus $182,000
-
1998-06-26soldstatus $178,571
ⓘ Source: listings_history table (triggers on properties + properties_extension) + one-shot
backfill from property_details.listing_events for pre-trigger history.
Tax reassessment forecast FL · Resets to sale price
- Current annual tax
- $2,360 · $197/mo
- Projected year-2 tax
- $2,614 · $218/mo
- Expected delta
- +$254/yr (+$21/mo · 10.8%)
ⓘ Screening estimate from a state-policy table — verify with the county assessor before closing.
Climate risk First Street
- Flood 8/10 Severe FEMA zone X (shaded) · 97% chance over 30 yrs
- Wildfire 4/10 Moderate
- Heat 10/10 Extreme 7 d/yr ≥107°F today · 28 d/yr by 30 yrs out
- Wind 10/10 Extreme 99% chance of damaging wind over 30 yrs
- Air quality 3/10 Moderate 2 unhealthy d/yr today · 2 by 30 yrs out
Nearby sold comps map
Loading sold comps map…
Walkable amenities ~0.75 mi
Loading nearby amenities…
Taxation est. · year 1
- Rental income
- $32,603
- − Mortgage interest
- −$17,645
- − Property taxes
- −$2,360
- − Insurance
- −$2,372
- − Repairs & maintenance
- −$2,608
- − Management
- −$2,608
- − HOA
- −$1,824
- − Depreciation
- −$9,164
- Taxable loss
- −$5,979
- Est. tax savings @ 24.0%
- +$1,435
- After-tax cash flow
- $812/yr
For passive investors: Depreciation is non-cash, so a rental often shows a tax loss while cash-flowing — sheltering income. Rental losses are passive: they offset passive income freely, and up to $25,000/yr can offset ordinary (W-2) income if you actively participate and your MAGI is under $100k (phasing out to $0 by $150k); unused losses carry forward. On sale, claimed depreciation is recaptured at up to 25%, and gains may owe capital-gains tax (a 1031 exchange can defer both). Figures are a year-1 estimate at your 24.0% rate — not tax advice; consult a CPA.
Schools (NCES district)
- District
- Charlotte
- NCES district ID
- 1200240
- Math proficiency
- 54% ▼ -6.00%
- Reading proficiency
- 54% ▼ -1.00%
- Median HH income
- $44,864
- Composite
- 45.62/100
- National rank
- #2586
- State rank
- #22 of 73 in FL
Livability — Punta Gorda
- Score
- 76/100
- State rank
- #225
- US rank
- #3567
Category grades
Schools grade is shown separately in the Schools card above.
Census & demographics
- Census place
- Punta Gorda, FL
- County
- Charlotte County · 196,994 people
- City population
- 68,831
- Metro
- Punta Gorda, FL
- Population (ZIP)
- 12,399
- Household income
- $76,943
- Rent vs Own
- Severe rent burden
- 226.0
Population outlook (Charlotte County) Hauer SSP2
- Today (2025)
- 198,646 people
- By 2030
- 210,507 · +6.0%
- By 2040
- 230,857 · +16.2%
- By 2050
- 247,148 · +24.4%
- By 2075
- 281,777 · +41.8%
- By 2100
- 293,609 · +47.8%
Race, ethnicity, and origin ACS 2023
- Neighborhood character
- Predominantly White (84%)
- Race & ethnicity
- White 84% Hispanic / Latino 10% Two or more races 9% Black 2%
- Hispanic origin (detail)
- Mexican 4% Puerto Rican 2% Cuban 4%
- Common ancestry
- Romanian 5% Italian 3% Serbian 3%
- Foreign-born
- 8% · Canada
- Languages at home
- 91% English-only · Spanish 5% Other Indo-European 1%
Political lean MEDSL · Charlotte
- 2024 margin
- Solid R (+34.0) · D 32.7% · R 66.7%
- 2008→2024 swing
- -26.7pp toward R · 2008: -7.2pp · 2024: -34.0pp
- All cycles
- 2024: R+34.0 2020: R+26.6 2016: R+27.8 2012: R+14.3 2008: R+7.2
Not yet ingested
- Civics
- —
Market trends
- HPI YoY
- ▼ -78.71%
- Current HPI
- 242.9043
- Rent YoY
- —
- Metro
- Punta Gorda, FL
- State GDP YoY
- ▲ 3.28%
- F500 in state
- 36
Industry mix (Fortune 500 HQ in FL)
| Industry | F500 HQs | Revenue |
|---|---|---|
| Industrial Technology | 2 | $29B |
|
||
| Insurance | 2 | $17B |
|
||
| Retail | 1 | $60B |
|
||
| Technology Distribution | 1 | $58B |
|
||
| Homebuilding | 1 | $35B |
|
||
| Technology Manufacturing | 1 | $35B |
|
||
Price history
+76.4% since first listed10 events — show timeline
- 2026-05-16 Pending — Stellar MLS as Distributed by MLS Grid
- 2026-03-02 Price Changed $315,000 Stellar MLS as Distributed by MLS Grid
- 2026-01-25 Price Changed $335,000 Stellar MLS as Distributed by MLS Grid
- 2025-12-21 Listed $349,000 Stellar MLS as Distributed by MLS Grid
- 2025-09-29 Listing Removed — Stellar MLS as Distributed by MLS Grid
- 2025-08-19 Price Changed $370,000 Stellar MLS as Distributed by MLS Grid
- 2025-05-22 Listed $385,000 Stellar MLS as Distributed by MLS Grid
- 2003-11-22 Sold (Public Records) $244,000 Public Records
- 1999-07-19 Sold (Public Records) $182,000 Public Records
- 1998-06-26 Sold (Public Records) $178,571 Public Records
Property tax history
+1.8%/yrLatest (2025): $2,360 · +2.8% YoY. Source: county tax records.
Cash-flow waterfall
monthlySold comps — $/sqft
last 12 mo · ≤1 miLoading sold comps…