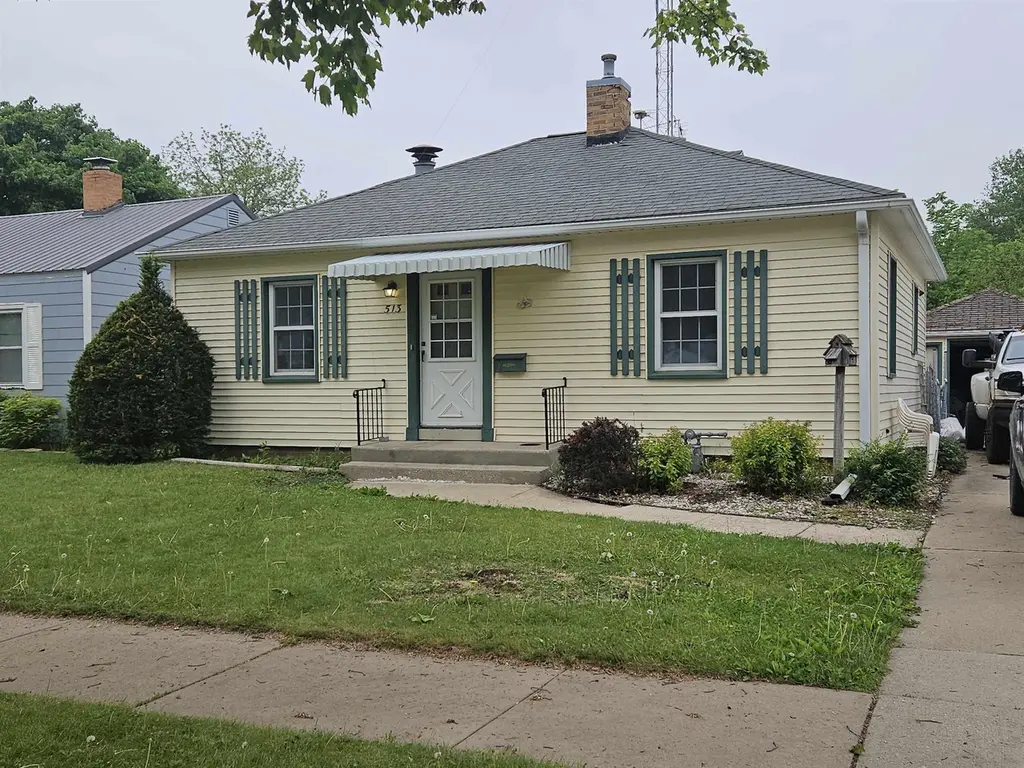
513 6th Ave · Charles City, IA
Flood risk 1/10 · Minimal
- FEMA flood zone
- X (unshaded)
- Chance of flooding over 30 yrs
- 0.0%
- Est. flood insurance / yr
- $473 – $860
Fire risk 4/10 · Minor
- Est. fire insurance / yr
- $902 – $1,676
Heat risk 2/10 · Minimal
- Hot days now (above 101°F)
- 7 days/yr
- Hot days in 30 yrs
- 16 days/yr
Wind risk 2/10 · Minimal
- Chance of severe wind over 30 yrs
- —
Air-quality risk 1/10 · Minimal
- Unhealthy air days now
- 0 days/yr
- Unhealthy air days in 30 yrs
- 0 days/yr
Risk factors via First Street. Map © Google.
Why this score? — see what drove the B grade
The composite is a weighted blend of 9 inputs, each scored 0–100. Each bar is that input's sub-score; the figure is the points it added to the 100-point composite (weight × sub-score).
- Cash flow +30.0/30.0
- DSCR +10.0/10.0
- ARV discount +10.0/15.0
- 1% rule +8.7/10.0
- Schools +4.7/10.0
- Livability +3.9/5.0
- Rent growth +2.5/5.0
- Condition / age +2.5/5.0
- Appreciation +0.0/10.0
$82,000
🖨 Deal sheet 📄 Offer letter ✓ Due diligence
Listing remarks MLS
This home is super clean and move-in ready! Nice floor plan featuring 1,189 square feet of finished living space. On the main level you will find a nice sized living room, separate dining room, a hall bathroom with walk-in shower, two nice sized bedrooms and a well-organized kitchen with wood cabinetry. The home’s lower level has a family room with wood burning stove, third (non-conforming) bedroom or office area, workshop, laundry and excellent storage. Exterior amenities include a one stall detached garage, a backyard concrete patio, storage shed, rear alley access and is nicely landscaped. Call today for your personal tour and opportunity to call this home your home!
Key facts
- Pull out table
- New bathtub
- Curb appeal
Tags
Property features AI
Exterior
- Parking: Detached carport (1 carport space)
- Security: Smoke detectors
- Utilities: Public water; Public sewer
- Home design: Single-family residence; One story
- Construction: Vinyl siding; Asphalt roof
- Exterior features: Storage structure on property; Lot roughly 50 x 124 (approximately 0.142 acres); Sidewalks in the community
Interior
- Kitchen: Free-standing range; Refrigerator; Disposal
- Flooring: Hardwood flooring
- Bathrooms: 1 full bathroom
- Heating & cooling: Forced air heating (natural gas); Central air conditioning
- Interior features: Fireplace (1); Partially finished basement with concrete floor and interior entry
- Laundry & utility: Washer; Dryer; Electric water heater; Laundry located on lower level
Neighborhood map
What this means for you Summary
Snapshot
- This is a 2-bed/1.5-bath single-family listed at $82k.
Deal economics
- At list price, monthly cash flow is $319 ($4k/yr) — positive.
- The deal already cash-flows at list — no discount required.
- Meets the 1% rule at list price ($1k rent vs $82k).
- Cap rate 11.0% vs local median 6.5% in Charles City — top-decile yield for the area; either an underpriced asset or a hidden risk that comps aren't pricing in. Stress-test before assuming the spread holds.
Location & tenants
- Location reads 77/100 on livability (#161 in IA, #2,944 nationally) — a middle-class / working-renter tenant base. Strengths: cost of living A+, health & safety A+, housing A; Watch: amenities F, commute F, employment F.
- Charles City Community School District (town): math 52% / reading 61% proficiency, ranked #262 of 289 in IA (top 91%) — acceptable for families but not a draw, mixed tenant base, ~2y average lease.
- Zoned schools: Charles City Ms (math 51% / reading 59%, grade B-, #201 of 246 statewide, top 82%, 423 students, 54% FRL); Charles City High School (math 47% / reading 67%, grade C, #279 of 336 statewide, top 85%, 534 students, 47% FRL).
- Market conditions: 70 active listings in the ZIP; 2 comparable units currently listed for rent nearby; 38 units permitted in Floyd County in 2024 (0 in 5+ unit buildings).
Forward outlook
- Local home prices are declining (-3.0%/yr); year-one equity from $567 of loan paydown is wiped out by about $2k of value loss. Plan a longer hold.
- Floyd County population projected to shrink 6% by 2050 — rents likely to lag national; underwrite the cash flow, not the appreciation.
- At projected returns (-3.0% appreciation + 3.0% rent growth), your $23k cash investment doubles in ~8 years — after that, you're playing with house money.
Negotiation context
- Only 8 days on market — expect competitive offers; lowballing is unlikely to land.
- 2 sale attempts since 5y ago with the ask held roughly flat each time — persistent listings suggest the price (not the market) is what's stuck; bring a comps-based counter.
- Current owner paid $70k; 17% above their basis — modest negotiation headroom, anchor on the comps not their cost.
Risks & watch-outs
- Watch-outs: built in 1940 — expect roof / HVAC / electrical / plumbing capex.
Questions for the listing agent
- Built in 1940 — when were the roof, HVAC, electrical panel, plumbing, and water heater last replaced?
- Is there a deadline driving the sale (1031 exchange, divorce, estate, relocation)? That informs how much negotiation room exists.
- What's the average days-on-market for RENTAL listings here right now (not sales)? A rising rental-DOM trend means longer vacancies and softer asking-rent achievability than the comps imply.
- What's the recent tenant-quality profile in this submarket — average credit score on applications, eviction rate, late-payment / NSF rate, and stable-employment percentage? A property-management company in the area should have these aggregated.
- How much new for-sale + rental construction is in the pipeline within 1–3 miles? Heavy new supply typically softens prices + rents 12–24 months out; constrained supply supports both.
Investment metrics
- 1% rule
- 1.37% ✓
- Cap rate
- 10.96%
- Cash-on-cash
- 16.68%
- DSCR
- 1.74
- GRM
- 6.1
CMA / ARV
- ARV (on-the-fly)
- $86,797
- Comps found
- 12
Show comp detail 12 sales within ~0.75 mi
| Address | Dist | Beds/Ba | Sqft | Sold | Price | $/sf | Match |
|---|---|---|---|---|---|---|---|
| 513 3rd Ave | 0.18mi | 2/1.0 | 1,179 (-1%) | 2mo | $120,000 | $102 | 87 |
| 1008 Ellis Dr. Apt #6 Dr | 0.39mi | 2/1.0 | 1,144 (-4%) | 7mo | $115,000 | $101 | 67 |
| 702 D St | 0.15mi | 2/1.0 | 1,061 (-11%) | 13mo | $50,000 | $47 | 62 |
| 900 6th Avenue Ave | 0.29mi | 2/2.0 | 1,120 (-6%) | 16mo | $130,000 | $116 | 62 |
| 303 7th Ave Ave | 0.22mi | 3/1.5 (+1) | 1,051 (-12%) | 9mo | $65,500 | $62 | 58 |
| 1203 E Street St | 0.50mi | 2/1.0 | 1,118 (-6%) | 10mo | $54,000 | $48 | 57 |
| 903 6th Ave | 0.30mi | 3/1.0 (+1) | 1,092 (-8%) | 16mo | $139,900 | $128 | 52 |
| 406 16th Ave | 0.67mi | 3/1.0 (+1) | 1,176 (-1%) | 14mo | $65,000 | $55 | 48 |
| 405 Richings | 0.69mi | 2/2.0 | 1,122 (-6%) | 16mo | $69,300 | $62 | 43 |
| 305 16th Ave | 0.72mi | 3/2.0 (+1) | 1,232 (+4%) | 17mo | $90,000 | $73 | 39 |
| 1215 N Grand Ave | 0.68mi | 3/1.0 (+1) | 1,096 (-8%) | 14mo | $75,000 | $68 | 36 |
| 602 Freeman St | 0.74mi | 3/1.5 (+1) | 1,056 (-11%) | 10mo | $147,500 | $140 | 33 |
Match score weights: distance 35% · size 25% · config 20% · recency 20%. Top-matched comps best support the ARV.
Projected returns pro-forma
-3.0% appreciation · 3.0% rent growth · sell at horizon
- IRR
- 7.8%
- Equity multiple
- 1.31×
- Total profit
- $7,056
- Equity at exit
- $12,226
- IRR
- 17.1%
- Equity multiple
- 2.41×
- Total profit
- $32,387
- Equity at exit
- $7,090
Cash invested: $22,960 (down + closing). Projections, not guarantees.
Landlord ↔ Tenant lean methodology
- Overall (STATE)
- 83 Strongly Landlord-Friendly
- State Iowa
- 83 Strongly Landlord-Friendly · R+6
- County
- — inherits STATE
- City
- — inherits STATE
ZIP-level market 50616
- Home prices YoY
- -19.7%
- Active inventory
- 70
- Price-to-rent
- 6.1×
Monthly cashflow live
- Estimated rent
- $1,121 medium interval (Pro) →
- Mortgage (P&I)
- −$430
- Tax from tax record
- −$102 /mo · $1,228/yr
- Insurance
- −$34
- HOA
- −$0
- Vacancy / Maint / Mgmt
- −$235
- Net cashflow
- $319
Break-even live
UW: 25.0% down · 7.5% · 30yr · 1.5% tax · 5.0% vac · 8.0% maint · 8.0% mgmt
Financing live
Cash to close
- Down payment
- $20,500
- Closing costs
- $2,460
- Reserves months
- —
- Total cash needed
- —
Loan-product check · same deal, 3 products live
Conventional
25% down · 7.5% · 30yr
- Down + closing
- —
- Monthly P&I
- —
- Monthly cashflow
- —
- DSCR
- —
- Eligible?
- —
Personal DTI + credit; lowest rate.
DSCR
20% down · 8.5% · 30yr
- Down + closing
- —
- Monthly P&I
- —
- Monthly cashflow
- —
- DSCR
- —
- Eligible?
- —
No personal income docs; deal must DSCR.
Hard money
10% down · 12.0% · 12mo
- Down + closing
- —
- Monthly P&I
- —
- Monthly cashflow
- —
- DSCR
- —
- Eligible?
- —
Short-term bridge; refi at stabilization.
Rent comps 2 comps
| Address | Beds | Baths | Sqft | Rent | $/sqft | DOM | Units | Dist |
|---|---|---|---|---|---|---|---|---|
| 1030 13th Ave Charles City, IA | 1.0–3.0 | 1.0–2.0 | 926 | $1,200 | $1.29 | 44d | 28 | 0.56mi |
| 1004 20th Ave Charles City, IA | 3.0 | 2.0 | 960 | $975 | $1.02 | 23d | 1 | 1.08mi |
Listing history 4 events
-
2026-05-18$82,000 Active
-
2021-09-16soldstatus $70,000
-
2021-09-01soldstatus $70,000 684-char remark
Show marketing remark (684 chars)
This home is super clean and move-in ready! Nice floor plan featuring 1,189 square feet of finished living space. On the main level you will find a nice sized living room, separate dining room, a hall bathroom with walk-in shower, two nice sized bedrooms and a well-organized kitchen with wood cabinetry. The home’s lower level has a family room with wood burning stove, third (non-conforming) bedroom or office area, workshop, laundry and excellent storage. Exterior amenities include a one stall detached garage, a backyard concrete patio, storage shed, rear alley access and is nicely landscaped. Call today for your personal tour and opportunity to call this home your home!
-
2021-06-07$67,000 684-char remark
Show marketing remark (684 chars)
This home is super clean and move-in ready! Nice floor plan featuring 1,189 square feet of finished living space. On the main level you will find a nice sized living room, separate dining room, a hall bathroom with walk-in shower, two nice sized bedrooms and a well-organized kitchen with wood cabinetry. The home’s lower level has a family room with wood burning stove, third (non-conforming) bedroom or office area, workshop, laundry and excellent storage. Exterior amenities include a one stall detached garage, a backyard concrete patio, storage shed, rear alley access and is nicely landscaped. Call today for your personal tour and opportunity to call this home your home!
ⓘ Source: listings_history table (triggers on properties + properties_extension) + one-shot
backfill from property_details.listing_events for pre-trigger history.
Tax reassessment forecast IA · Partial reset (capped growth)
- Current annual tax
- $1,228 · $102/mo
- Projected year-2 tax
- $1,258 · $105/mo
- Expected delta
- +$30/yr (+$2/mo · 2.4%)
ⓘ Screening estimate from a state-policy table — verify with the county assessor before closing.
Climate risk First Street
- Flood 1/10 Low FEMA zone X (unshaded) · 0% chance over 30 yrs
- Wildfire 4/10 Moderate
- Heat 2/10 Low 7 d/yr ≥101°F today · 16 d/yr by 30 yrs out
- Wind 2/10 Low
- Air quality 1/10 Low 0 unhealthy d/yr today · 0 by 30 yrs out
Nearby sold comps map
Loading sold comps map…
Walkable amenities ~0.75 mi
Loading nearby amenities…
Taxation est. · year 1
- Rental income
- $13,453
- − Mortgage interest
- −$4,593
- − Property taxes
- −$1,228
- − Insurance
- −$410
- − Repairs & maintenance
- −$1,076
- − Management
- −$1,076
- − Depreciation
- −$2,385
- Taxable income
- $2,684
- Est. tax owed @ 24.0%
- −$644
- After-tax cash flow
- $3,186/yr
For passive investors: Depreciation is non-cash, so a rental often shows a tax loss while cash-flowing — sheltering income. Rental losses are passive: they offset passive income freely, and up to $25,000/yr can offset ordinary (W-2) income if you actively participate and your MAGI is under $100k (phasing out to $0 by $150k); unused losses carry forward. On sale, claimed depreciation is recaptured at up to 25%, and gains may owe capital-gains tax (a 1031 exchange can defer both). Figures are a year-1 estimate at your 24.0% rate — not tax advice; consult a CPA.
Schools (NCES district)
- District
- Charles City Community School District
- NCES district ID
- 1907080
- Math proficiency
- 52% ▼ -3.00%
- Reading proficiency
- 61% ▲ 9.00%
- Median HH income
- $41,414
- Composite
- 47.32/100
- National rank
- #2299
- State rank
- #262 of 289 in IA
Livability — Charles City
- Score
- 77/100
- State rank
- #161
- US rank
- #2944
Category grades
Schools grade is shown separately in the Schools card above.
Census & demographics
- Census place
- Charles City, IA
- City population
- 9,419
- Population (ZIP)
- 9,419
Population outlook (Floyd County) Hauer SSP2
- Today (2025)
- 15,524 people
- By 2030
- 15,254 · -1.7%
- By 2040
- 14,830 · -4.5%
- By 2050
- 14,660 · -5.6%
- By 2075
- 15,548 · +0.2%
- By 2100
- 17,406 · +12.1%
Race, ethnicity, and origin ACS 2023
- Neighborhood character
- Predominantly White (87%)
- Race & ethnicity
- White 87% Two or more races 6% Hispanic / Latino 5% Asian 2% Black 2%
- Hispanic origin (detail)
- Mexican 4%
- Common ancestry
- Portuguese 6% Scandinavian 2% Lithuanian 2%
- Foreign-born
- 5% · Canada
- Languages at home
- 94% English-only · Spanish 2% Other Asian/Pacific 1% Tagalog/Filipino 1%
Political lean MEDSL · Floyd
- 2024 margin
- Strong R (+25.7) · D 36.5% · R 62.2% · Other 1.3%
- 2008→2024 swing
- -47.6pp toward R · 2008: 21.9pp · 2024: -25.7pp
- All cycles
- 2024: R+25.7 2020: R+19.4 2016: R+14.9 2012: D+14.7 2008: D+21.9
Not yet ingested
- Civics
- —
Market trends
- HPI YoY
- ▼ -46.03%
- Current HPI
- 187.4742
- Rent YoY
- —
- Metro
- —
- State GDP YoY
- ▲ 2.48%
- F500 in state
- 4
Industry mix (Fortune 500 HQ in IA)
| Industry | F500 HQs | Revenue |
|---|---|---|
| Financial Services | 1 | $16B |
|
||
| Retail / Convenience | 1 | $15B |
|
||
Price history
+22.4% since first listed4 events — show timeline
- 2026-05-18 Listed $82,000 NEIRBR as distributed by MLS GRID
- 2021-09-16 Sold (Public Records) $70,000 Public Records
- 2021-09-01 Sold (MLS) $70,000 NEIRBR as distributed by MLS GRID
- 2021-06-07 Listed $67,000 NEIRBR as distributed by MLS GRID
Property tax history
+3.3%/yrLatest (2025): $1,228 · +0.7% YoY. Source: county tax records.
Cash-flow waterfall
monthlySold comps — $/sqft
last 12 mo · ≤1 miLoading sold comps…