11377 Township Road 266 #47 · Chippewa Park, OH
Flood risk 1/10 · Minimal
- FEMA flood zone
- X (unshaded)
- Chance of flooding over 30 yrs
- 0.0%
- Est. flood insurance / yr
- $507 – $1,088
Fire risk 1/10 · Minimal
- Est. fire insurance / yr
- $713 – $1,323
Heat risk 3/10 · Minor
- Hot days now (above 99°F)
- 7 days/yr
- Hot days in 30 yrs
- 18 days/yr
Wind risk 2/10 · Minimal
- Chance of severe wind over 30 yrs
- —
Air-quality risk 2/10 · Minimal
- Unhealthy air days now
- 1 days/yr
- Unhealthy air days in 30 yrs
- 2 days/yr
Risk factors via First Street. Map © Google.
Why this score? — see what drove the C+ grade
The composite is a weighted blend of 9 inputs, each scored 0–100. Each bar is that input's sub-score; the figure is the points it added to the 100-point composite (weight × sub-score).
- Cash flow +30.0/30.0
- DSCR +10.0/10.0
- 1% rule +8.7/10.0
- Schools +5.3/10.0
- Condition / age +4.0/5.0
- Rent growth +2.5/5.0
- Livability +2.5/5.0
- ARV discount +0.0/15.0
- Appreciation +0.0/10.0
$89,900
🖨 Deal sheet (PDF) 📄 Offer letter ✓ Due diligence
Listing remarks
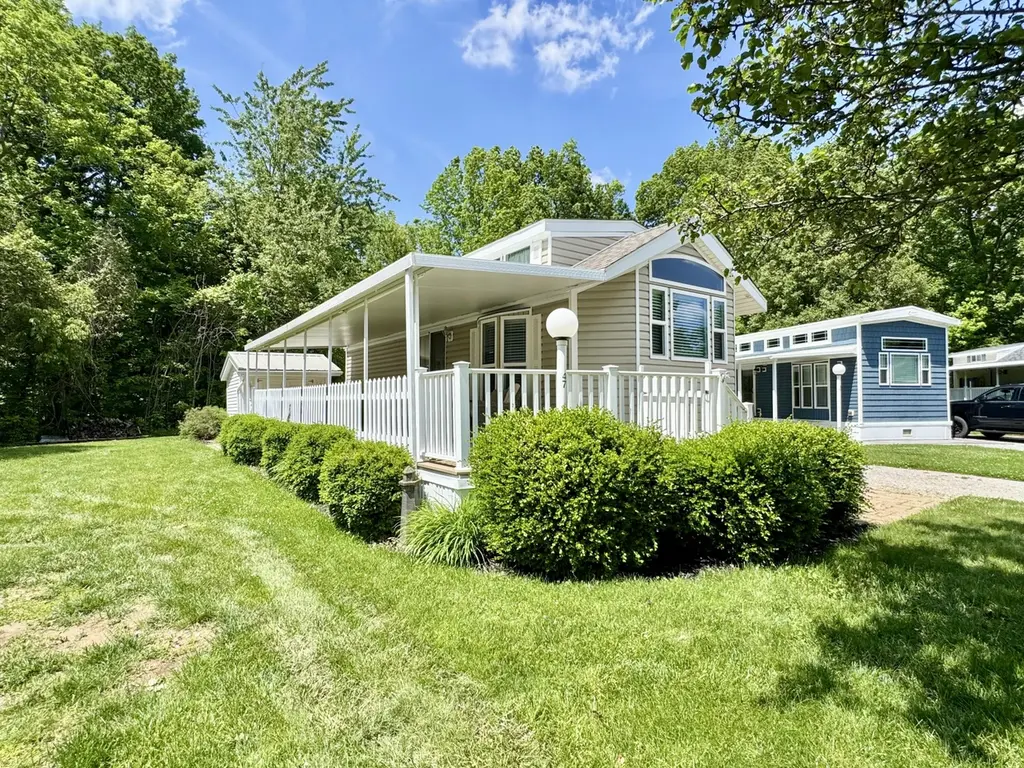
Your Lake Life awaits at Indian Lake Estates! Whether your looking for a weekend retreat, summer escape, or a year round sanctuary, look no further! This furnished 2017 Kropf Island Park Model is ready for new owners. Outside features of this home include: a large covered composite deck-perfect for sitting outside yet shaded from the sun, a shed with electric, an outside rear fenced patio area with privacy fencing on one side, and a large back yard that backs up to the tree line offering both shade & privacy. Some inside features include: vaulted ceilings in the main living area, a lofted second bedroom, a sofa sleeper, and an electric fireplace, Lot 48 directly next door is also
Key facts
- Shed with electric
- Large back yard
- Vaulted ceilings
Tags
Property features AI
Finance
- Other: Located in a community with guest parking
- HOA & community: Association maintains grounds and pool; Association covers snow removal, sewer, water, and trash
Exterior
- Utilities: Supplied water; Public sewer; Propane; Sewer connected
- Home design: Residential mobile home; Built in 2017; Leased lot
- Construction: Vinyl siding
- Exterior features: Patio; Deck; Shed(s); Fenced yard; Association in-ground pool; Lake access (waterfront, lake related)
Interior
- Kitchen: Microwave; Range; Refrigerator
- Bathrooms: 1 full bathroom
- Heating & cooling: Central air; Wall unit(s); Forced air heating; Propane heating
- Interior features: Cathedral ceilings; Ceiling fans; Electric fireplace
- Laundry & utility: Electric water heater
Neighborhood map
What this means for you Summary
Snapshot
- This is a 2-bed/1.0-bath manufactured listed at $90k. Condition is rated good.
Deal economics
- At list price, monthly cash flow is $355 ($4k/yr) — positive.
- The deal already cash-flows at list — no discount required.
- Meets the 1% rule at list price ($1k rent vs $90k).
- Recommended offer: $89k (1.5% below list) — sets the bar for market timing.
- Cap rate 11.0% vs local median 5.5% in Chippewa Park — top-decile yield for the area; either an underpriced asset or a hidden risk that comps aren't pricing in. Stress-test before assuming the spread holds.
Location & tenants
- Location reads 49/100 on livability (#1,173 in OH) — a working-class tenant base; expect higher turnover. Strengths: cost of living A+, crime A; Watch: schools F, amenities F, commute F.
- Indian Lake Local (rural): math 59% / reading 66% proficiency, ranked #261 of 656 in OH (top 40%) — acceptable for families but not a draw, mixed tenant base, ~2y average lease.
- Market conditions: 112 active listings in the ZIP; 121 units permitted in Logan County in 2024 (0 in 5+ unit buildings).
Forward outlook
- Local home prices are declining (-3.0%/yr); year-one equity from $622 of loan paydown is wiped out by about $3k of value loss. Plan a longer hold.
- Logan County population projected at -15% by 2050 — secular population decline; favor cash flow + early exit over multi-decade hold.
- At projected returns (-3.0% appreciation + 3.0% rent growth), your $25k cash investment doubles in ~8 years — after that, you're playing with house money.
Negotiation context
- It's been on market 29 days — a 2% lower offer ($89k) is reasonable based on typical stale-listing flexibility.
Questions for the listing agent
- Is there a deadline driving the sale (1031 exchange, divorce, estate, relocation)? That informs how much negotiation room exists.
- Schools are F-rated, which usually means shorter tenancies and higher turnover. Who's the typical renter profile here, and what's been the actual vacancy rate?
- What's the average days-on-market for RENTAL listings here right now (not sales)? A rising rental-DOM trend means longer vacancies and softer asking-rent achievability than the comps imply.
- What's the recent tenant-quality profile in this submarket — average credit score on applications, eviction rate, late-payment / NSF rate, and stable-employment percentage? A property-management company in the area should have these aggregated.
- How much new for-sale + rental construction is in the pipeline within 1–3 miles? Heavy new supply typically softens prices + rents 12–24 months out; constrained supply supports both.
Investment metrics
- 1% rule
- 1.37% ✓
- Cap rate
- 11.03%
- Cash-on-cash
- 16.92%
- DSCR
- 1.75
- GRM
- 6.1
CMA / ARV
- ARV (on-the-fly)
- $62,400
- Comps found
- 5
Show comp detail 5 sales within ~0.75 mi
| Address | Dist | Beds/Ba | Sqft | Sold | Price | $/sf | Match |
|---|---|---|---|---|---|---|---|
| 11377 Township Road 266 #77 | 0.06mi | 1/1.0 (-1) | 432 (-10%) | 8mo | $57,000 | $132 | 69 |
| 11377 Township Road 266 #61 | 0.06mi | 1/1.0 (-1) | 432 (-10%) | 9mo | $56,000 | $130 | 68 |
| 11377 Township Road 266 #15 | 0.06mi | 1/1.0 (-1) | 432 (-10%) | 9mo | $45,000 | $104 | 68 |
| 11377 Township Road 266 #22 | 0.06mi | 1/1.0 (-1) | 538 (+12%) | 8mo | $19,000 | $35 | 66 |
| 11065 County Road 293 #13 | 0.35mi | 1/1.0 (-1) | 540 (+12%) | 3mo | $85,000 | $157 | 56 |
Match score weights: distance 35% · size 25% · config 20% · recency 20%. Top-matched comps best support the ARV.
Projected returns pro-forma
-3.0% appreciation · 3.0% rent growth · sell at horizon
- IRR
- 8.2%
- Equity multiple
- 1.32×
- Total profit
- $8,052
- Equity at exit
- $13,404
- IRR
- 17.4%
- Equity multiple
- 2.44×
- Total profit
- $36,190
- Equity at exit
- $7,773
Cash invested: $25,172 (down + closing). Projections, not guarantees.
Landlord ↔ Tenant lean methodology
- Overall (STATE)
- 73 Landlord-Friendly
- State Ohio
- 73 Landlord-Friendly · R+6
- County
- — inherits STATE
- City
- — inherits STATE
ZIP-level market 43331
- Home prices YoY
- -30.0%
- Active inventory
- 112
- Price-to-rent
- 6.1×
Monthly cashflow live
- Estimated rent
- $1,236 medium interval (Pro) →
- Mortgage (P&I)
- −$471
- Tax est. 1.5%
- −$112 /mo · $1,348/yr
- Insurance
- −$37
- HOA
- −$0
- Vacancy / Maint / Mgmt
- −$259
- Net cashflow
- $355
Break-even live
Sensitivity live
| Price | -10% $417 | -5% $386 | +0% $355 | +5% $324 | +10% $293 |
|---|---|---|---|---|---|
| Rent | -10% $257 | -5% $306 | +0% $355 | +5% $404 | +10% $452 |
| Rate | -1.0pp $400 | -0.5pp $378 | base $355 | +0.5pp $332 | +1.0pp $308 |
UW: 25.0% down · 7.5% · 30yr · 1.5% tax · 5.0% vac · 8.0% maint · 8.0% mgmt
Financing live
Cash to close
- Down payment
- $22,475
- Closing costs
- $2,697
- Reserves months
- —
- Total cash needed
- —
Loan-product check · same deal, 3 products live
Conventional
25% down · 7.5% · 30yr
- Down + closing
- —
- Monthly P&I
- —
- Monthly cashflow
- —
- DSCR
- —
- Eligible?
- —
Personal DTI + credit; lowest rate.
DSCR
20% down · 8.5% · 30yr
- Down + closing
- —
- Monthly P&I
- —
- Monthly cashflow
- —
- DSCR
- —
- Eligible?
- —
No personal income docs; deal must DSCR.
Hard money
10% down · 12.0% · 12mo
- Down + closing
- —
- Monthly P&I
- —
- Monthly cashflow
- —
- DSCR
- —
- Eligible?
- —
Short-term bridge; refi at stabilization.
Listing history 15 events
-
2026-06-18days on market $89,900 Active 29 DOM
-
2026-06-17days on market $89,900 Active 28 DOM
-
2026-06-16days on market $89,900 Active 27 DOM
-
2026-06-15days on market $89,900 Active 26 DOM
-
2026-06-13days on market $89,900 Active 24 DOM
-
2026-06-12days on market $89,900 Active 23 DOM
-
2026-06-09days on market $89,900 Active 20 DOM
-
2026-06-08days on market $89,900 Active 19 DOM
-
2026-06-08days on market $89,900 Active 18 DOM
-
2026-06-07days on market $89,900 Active 17 DOM
-
2026-06-04days on market $89,900 Active 14 DOM
-
2026-06-02days on market $89,900 Active 13 DOM
-
2026-06-01days on market $89,900 Active 12 DOM
-
2026-05-31days on market $89,900 Active 11 DOM
-
2026-05-20$89,900 Active
ⓘ Source: listings_history table (triggers on properties + properties_extension) + one-shot
backfill from property_details.listing_events for pre-trigger history.
Climate risk First Street
- Flood 1/10 Low FEMA zone X (unshaded) · 0% chance over 30 yrs
- Wildfire 1/10 Low
- Heat 3/10 Moderate 7 d/yr ≥99°F today · 18 d/yr by 30 yrs out
- Wind 2/10 Low
- Air quality 2/10 Low 1 unhealthy d/yr today · 2 by 30 yrs out
Nearby sold comps map
Loading sold comps map…
Walkable amenities ~0.75 mi
Loading nearby amenities…
Taxation est. · year 1
- Rental income
- $14,827
- − Mortgage interest
- −$5,036
- − Property taxes
- −$1,348
- − Insurance
- −$450
- − Repairs & maintenance
- −$1,186
- − Management
- −$1,186
- − Depreciation
- −$2,615
- Taxable income
- $3,006
- Est. tax owed @ 24.0%
- −$721
- After-tax cash flow
- $3,537/yr
For passive investors: Depreciation is non-cash, so a rental often shows a tax loss while cash-flowing — sheltering income. Rental losses are passive: they offset passive income freely, and up to $25,000/yr can offset ordinary (W-2) income if you actively participate and your MAGI is under $100k (phasing out to $0 by $150k); unused losses carry forward. On sale, claimed depreciation is recaptured at up to 25%, and gains may owe capital-gains tax (a 1031 exchange can defer both). Figures are a year-1 estimate at your 24.0% rate — not tax advice; consult a CPA.
Condition & rehab AI · 13 photos
This 2017 Kropf Island Park Model is move-in ready with good condition and a good location. It offers a large covered deck, a fenced patio area, and a large back yard with privacy. The interior is modern and well-maintained.
Value-add opportunities
- Both Painting the exterior siding — Enhances curb appeal and can increase both resale and rental value
- Both Landscaping improvements — Enhances curb appeal and can increase both resale and rental value
Renovation cost estimate screening
Value-add ROI direction
- Both Painting the exterior siding — Enhances curb appeal and can increase both resale and rental value ↑
- Both Landscaping improvements — Enhances curb appeal and can increase both resale and rental value ↑
ⓘ Cost ranges are severity-bucket heuristics (US national rule-of-thumb). Get contractor quotes + a written scope before underwriting a rehab budget.
Schools (NCES district)
- District
- Indian Lake Local
- NCES district ID
- 3904808
- Math proficiency
- 59% ▼ -14.00%
- Reading proficiency
- 66% ▼ -4.00%
- Median HH income
- $44,496
- Composite
- 52.6/100
- National rank
- #1559
- State rank
- #261 of 656 in OH
Livability — Chippewa Park
- Score
- 49/100
- State rank
- #1173
- US rank
- #25758
Category grades
Schools grade is shown separately in the Schools card above.
Census & demographics
- County
- Logan · 47,256 people
- Population (ZIP)
- 4,012
- Household income
- $60,159
- Rent vs Own
- Severe rent burden
- 16.1
Population outlook (Logan County) Hauer SSP2
- Today (2025)
- 44,240 people
- By 2030
- 43,166 · -2.4%
- By 2040
- 40,495 · -8.5%
- By 2050
- 37,511 · -15.2%
- By 2075
- 30,453 · -31.2%
- By 2100
- 23,081 · -47.8%
Race, ethnicity, and origin ACS 2023
- Neighborhood character
- Predominantly White (94%)
- Race & ethnicity
- White 94% Hispanic / Latino 4% Two or more races 2% Black 1%
- Common ancestry
- Lithuanian 2% Slovak 2% Iranian 1%
- Foreign-born
- 2% · Canada
- Languages at home
- 96% English-only · Spanish 4%
Political lean MEDSL · Logan
- 2024 margin
- Solid R (+56.2) · D 21.5% · R 77.7%
- 2008→2024 swing
- -29.6pp toward R · 2008: -26.6pp · 2024: -56.2pp
- All cycles
- 2024: R+56.2 2020: R+55.2 2016: R+52.6 2012: R+31.8 2008: R+26.6
Not yet ingested
- Civics
- —
Market trends
- HPI YoY
- ▼ -109.75%
- Current HPI
- 256.2406
- Rent YoY
- —
- Metro
- —
- State GDP YoY
- ▲ 1.98%
- F500 in state
- 48
Industry mix (Fortune 500 HQ in OH)
| Industry | F500 HQs | Revenue |
|---|---|---|
| Insurance | 3 | $145B |
|
||
| Industrial Machinery | 3 | $49B |
|
||
| Financial Services | 3 | $24B |
|
||
| Consumer Goods | 2 | $93B |
|
||
| Aerospace / Defense | 2 | $47B |
|
||
| Utilities | 2 | $33B |
|
||
Price history
1 event — show timeline
- 2026-05-20 Listed $89,900 WRIST
Cash-flow waterfall
monthlySold comps — $/sqft
last 12 mo · ≤1 miLoading sold comps…