4451 Airport Rd · Coosada, AL
Flood risk 1/10 · Minimal
- FEMA flood zone
- X (unshaded)
- Chance of flooding over 30 yrs
- 0.0%
- Est. flood insurance / yr
- $507 – $1,088
Fire risk 4/10 · Minor
- Est. fire insurance / yr
- $916 – $1,700
Heat risk 7/10 · Major
- Hot days now (above 108°F)
- 7 days/yr
- Hot days in 30 yrs
- 20 days/yr
Wind risk 6/10 · Moderate
- Chance of severe wind over 30 yrs
- 70.0%
Air-quality risk 3/10 · Minor
- Unhealthy air days now
- 2 days/yr
- Unhealthy air days in 30 yrs
- 3 days/yr
Risk factors via First Street. Map © Google.
Why this score? — see what drove the C grade
The composite is a weighted blend of 9 inputs, each scored 0–100. Each bar is that input's sub-score; the figure is the points it added to the 100-point composite (weight × sub-score).
- Cash flow +20.5/30.0
- ARV discount +13.0/15.0
- DSCR +6.5/10.0
- Rent growth +4.8/5.0
- 1% rule +4.1/10.0
- Schools +3.5/10.0
- Livability +3.0/5.0
- Condition / age +2.5/5.0
- Appreciation +0.0/10.0
$190,000
🖨 Deal sheet 📄 Offer letter ✓ Due diligence
Listing remarks
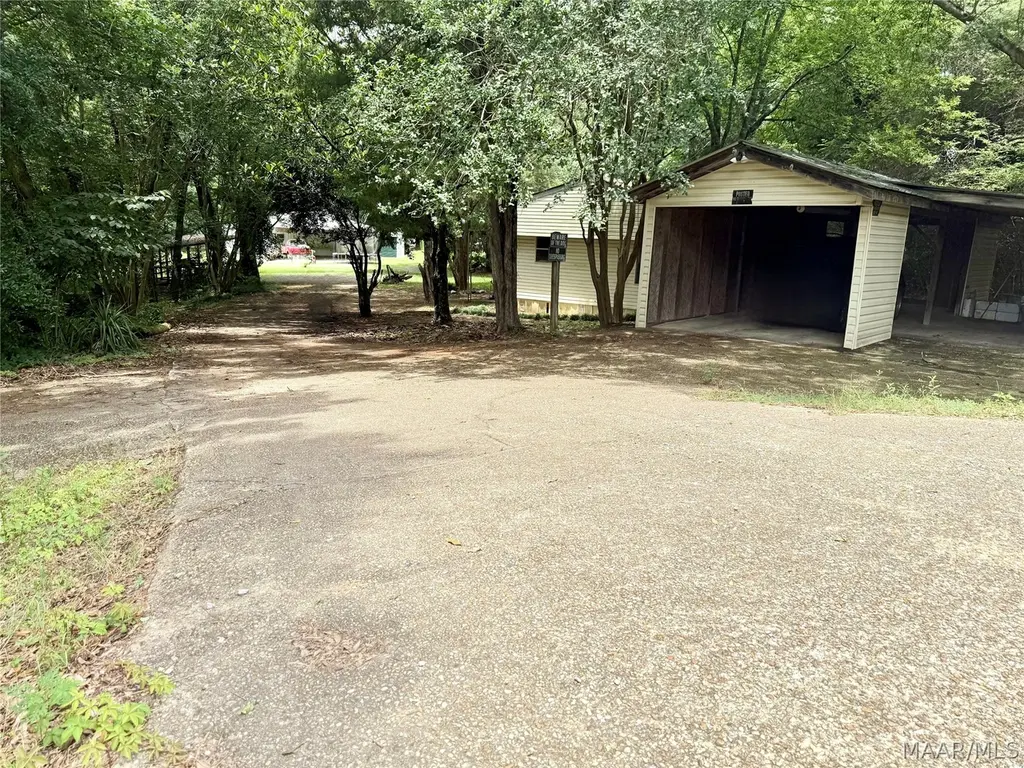
Rare opportunity to own 2.44+/- acres outside city limits featuring a stocked private pond, chicken coops, and a 2,160+/- sq. ft. wired workshop with 5 roll up doors and covered area. The property offers a peaceful rural setting with plenty of room to enjoy country living. The home will require repairs and/or replacements and is being sold AS-IS. Buyers are encouraged to conduct their own inspections and due diligence. Whether you’re looking for a project, workshop space, or acreage with existing improvements, this property offers plenty of potential. 4 Parcels totaling 2.44 +/- acres Parcel # 15-08-34-0-003-009001-0 Parcel # 15-08-34-0-003-009004-0 Parcel # 15-08-34-0-003-009003-0
Key facts
- Chicken coops
- Private pond
- Wired workshop
Tags
Property features AI
Exterior
- Parking: Attached carport; Detached carport; 3 carport spaces
- Security: Fire alarm
- Utilities: Public water; Septic tank; Natural gas available
- Home design: Single-story; Vinyl siding; Property includes four parcels; Waterfront on a pond; Private road access
- Construction: Vinyl siding construction
- Exterior features: Covered patio; Patio; Storage; Above-ground pool; Pond on lot; Mature trees; Outside city limits
Interior
- Kitchen: Double oven; Plumbed for ice maker; Refrigerator; Gas water heater
- Flooring: Carpet; Tile; Vinyl; Wood
- Bathrooms: Two full bathrooms
- Heating & cooling: Central heating (gas); Window unit cooling
- Interior features: Blinds and window treatments; Double-pane windows; Linen closet; Workshop; Multiple fireplaces (per property)
- Laundry & utility: Washer hookup; Dryer hookup
Neighborhood map
What this means for you Summary
Snapshot
- This is a 3-bed/2.0-bath single-family listed at $190k.
Deal economics
- At list price, monthly cash flow is $250 ($3k/yr) — positive.
- The deal already cash-flows at list — no discount required.
- To meet the 1% rule (rent ≥ 1% of price), the offer needs to be $172k (9.3% below list).
- Recommended offer: $172k (9.3% below list) — sets the bar for 1% rule.
Location & tenants
- Location reads 60/100 on livability (#285 in AL) — a middle-class / working-renter tenant base. Strengths: cost of living A+, housing A+, crime B; Watch: schools D+, amenities F, commute F.
- Elmore County (town): math 27% / reading 54% proficiency, ranked #21 of 129 in AL (top 16%) — families likely to look elsewhere, expect single-tenant / working-renter base with shorter leases.
- Market conditions: Rents rising fast (+9.0%/yr); 84 active listings in the ZIP; 5 comparable units currently listed for rent nearby; rentals leasing fast (median 14d on market — plan ~1-2 weeks tenant-placement turnaround); 92 units permitted in Elmore County in 2024 (0 in 5+ unit buildings).
- This rent runs 30% of the median local income ($68k/yr) — at the standard rent-burdened threshold; future hikes will face affordability resistance.
Forward outlook
- Local home prices are declining (-3.0%/yr); year-one equity from $1k of loan paydown is wiped out by about $6k of value loss. Plan a longer hold.
- Elmore County population projected at +6% by 2050 — modest demand growth; plan on rents tracking national, not racing it.
- At projected returns (-3.0% appreciation + 8.0% rent growth), your $53k cash investment doubles in ~9 years — after that, you're playing with house money.
Negotiation context
- Only 10 days on market — expect competitive offers; lowballing is unlikely to land.
Risks & watch-outs
- Climate carrying-cost: major wind risk, 70% chance of damaging wind over 30y; extreme-heat days projected 7→20/yr by 2055 (HVAC capex compounding) — expect insurance premiums to compound above CPI over the hold.
Questions for the listing agent
- Is there a deadline driving the sale (1031 exchange, divorce, estate, relocation)? That informs how much negotiation room exists.
- Schools are D-rated, which usually means shorter tenancies and higher turnover. Who's the typical renter profile here, and what's been the actual vacancy rate?
- What's the average days-on-market for RENTAL listings here right now (not sales)? A rising rental-DOM trend means longer vacancies and softer asking-rent achievability than the comps imply.
- What's the recent tenant-quality profile in this submarket — average credit score on applications, eviction rate, late-payment / NSF rate, and stable-employment percentage? A property-management company in the area should have these aggregated.
- How much new for-sale + rental construction is in the pipeline within 1–3 miles? Heavy new supply typically softens prices + rents 12–24 months out; constrained supply supports both.
Investment metrics
- 1% rule
- 0.91% ✗
- Cap rate
- 7.87%
- Cash-on-cash
- 5.64%
- DSCR
- 1.25
- GRM
- 9.2
CMA / ARV
- ARV (on-the-fly)
- $216,603
- Comps found
- 9
Show comp detail 9 sales within ~0.75 mi
| Address | Dist | Beds/Ba | Sqft | Sold | Price | $/sf | Match |
|---|---|---|---|---|---|---|---|
| 163 Magnolia Loop | 0.26mi | 3/2.0 | 1,860 (+6%) | 8mo | $258,000 | $139 | 72 |
| 4351 Forest Dr | 0.27mi | 3/2.0 | 1,631 (-7%) | 6mo | $109,600 | $67 | 70 |
| 90 Ginfield Ct | 0.20mi | 3/2.0 | 1,716 (-3%) | 24mo | $230,000 | $134 | 66 |
| 4010 Rose Hill Ct | 0.59mi | 3/2.0 | 1,839 (+4%) | 2mo | $192,000 | $104 | 64 |
| 263 Live Oaks Dr | 0.67mi | 4/2.0 (+1) | 1,703 (-3%) | 0mo | $238,000 | $140 | 58 |
| 4730 Bibb Dr | 0.44mi | 3/2.0 | 1,670 (-5%) | 16mo | $206,000 | $123 | 57 |
| 4080 Rose Hill Ct | 0.52mi | 3/2.0 | 1,900 (+8%) | 24mo | $183,000 | $96 | 43 |
| 5121 Mcadams Rd | 0.62mi | 3/2.0 | 1,949 (+11%) | 22mo | $160,000 | $82 | 35 |
| 264 Live Oaks Dr | 0.66mi | 3/2.5 | 1,947 (+11%) | 22mo | $285,000 | $146 | 31 |
Match score weights: distance 35% · size 25% · config 20% · recency 20%. Top-matched comps best support the ARV.
Projected returns pro-forma
-3.0% appreciation · 8.0% rent growth · sell at horizon
- IRR
- -2.8%
- Equity multiple
- 0.89×
- Total profit
- $-5,856
- Equity at exit
- $28,330
- IRR
- 11.3%
- Equity multiple
- 2.06×
- Total profit
- $56,445
- Equity at exit
- $16,428
Cash invested: $53,200 (down + closing). Projections, not guarantees.
Landlord ↔ Tenant lean methodology
- Overall (STATE)
- 90 Strongly Landlord-Friendly
- State Alabama
- 90 Strongly Landlord-Friendly · R+15
- County
- — inherits STATE
- City
- — inherits STATE
ZIP-level market 36054
- Home prices YoY
- -26.9%
- Rents YoY
- 9.0%
- Active inventory
- 84
- Price-to-rent
- 9.2×
Monthly cashflow live
- Estimated rent
- $1,723 high interval (Pro) →
- Mortgage (P&I)
- −$996
- Tax from tax record
- −$35 /mo · $424/yr
- Insurance
- −$79
- HOA
- −$0
- Vacancy / Maint / Mgmt
- −$362
- Net cashflow
- $250
Break-even live
UW: 25.0% down · 7.5% · 30yr · 1.5% tax · 5.0% vac · 8.0% maint · 8.0% mgmt
Financing live
Cash to close
- Down payment
- $47,500
- Closing costs
- $5,700
- Reserves months
- —
- Total cash needed
- —
Loan-product check · same deal, 3 products live
Conventional
25% down · 7.5% · 30yr
- Down + closing
- —
- Monthly P&I
- —
- Monthly cashflow
- —
- DSCR
- —
- Eligible?
- —
Personal DTI + credit; lowest rate.
DSCR
20% down · 8.5% · 30yr
- Down + closing
- —
- Monthly P&I
- —
- Monthly cashflow
- —
- DSCR
- —
- Eligible?
- —
No personal income docs; deal must DSCR.
Hard money
10% down · 12.0% · 12mo
- Down + closing
- —
- Monthly P&I
- —
- Monthly cashflow
- —
- DSCR
- —
- Eligible?
- —
Short-term bridge; refi at stabilization.
Rent comps 5 comps
| Address | Beds | Baths | Sqft | Rent | $/sqft | DOM | Units | Dist |
|---|---|---|---|---|---|---|---|---|
| 63 Lilly Pad Cir Millbrook, AL | 3.0 | 2.0 | 1521 | $1,700 | $1.12 | 13d | 1 | 0.87mi |
| 223 S Springfield Dr Millbrook, AL | 3.0 | 2.0 | 1761 | $1,950 | $1.11 | 43d | 1 | 0.89mi |
| 3321 Branch St Millbrook, AL | 3.0 | 1.0 | 1300 | $1,200 | $0.92 | 21d | 1 | 1.23mi |
| 33 Jamestown Loop Millbrook, AL | 2.0 | 2.0 | 1245 | $1,375 | $1.10 | 13d | 1 | 1.28mi |
| 80 Blackmon Dr Coosada, AL | 3.0 | 2.5 | 1845 | $2,200 | $1.19 | 13d | 1 | 1.48mi |
Listing history 9 events
-
2026-06-18days on market $190,000 Active 10 DOM
-
2026-06-17days on market $190,000 Active 9 DOM
-
2026-06-16days on market $190,000 Active 8 DOM
-
2026-06-15days on market $190,000 Active 7 DOM
-
2026-06-14days on market $190,000 Active 5 DOM
-
2026-06-13days on market $190,000 Active 4 DOM
-
2026-06-10days on market $190,000 Active 2 DOM
-
2026-06-09remarks 693-char remark
-
2026-06-09$190,000 Active 1 DOM
ⓘ Source: listings_history table (triggers on properties + properties_extension) + one-shot
backfill from property_details.listing_events for pre-trigger history.
Tax reassessment forecast AL · Resets to sale price
- Current annual tax
- $424 · $35/mo
- Projected year-2 tax
- $779 · $65/mo
- Expected delta
- +$355/yr (+$30/mo · 83.7%)
ⓘ Screening estimate from a state-policy table — verify with the county assessor before closing.
Climate risk First Street
- Flood 1/10 Low FEMA zone X (unshaded) · 0% chance over 30 yrs
- Wildfire 4/10 Moderate
- Heat 7/10 Severe 7 d/yr ≥108°F today · 20 d/yr by 30 yrs out
- Wind 6/10 Major 70% chance of damaging wind over 30 yrs
- Air quality 3/10 Moderate 2 unhealthy d/yr today · 3 by 30 yrs out
Nearby sold comps map
Loading sold comps map…
Walkable amenities ~0.75 mi
Loading nearby amenities…
Taxation est. · year 1
- Rental income
- $20,672
- − Mortgage interest
- −$10,643
- − Property taxes
- −$424
- − Insurance
- −$950
- − Repairs & maintenance
- −$1,654
- − Management
- −$1,654
- − Depreciation
- −$5,527
- Taxable loss
- −$179
- Est. tax savings @ 24.0%
- +$43
- After-tax cash flow
- $3,044/yr
For passive investors: Depreciation is non-cash, so a rental often shows a tax loss while cash-flowing — sheltering income. Rental losses are passive: they offset passive income freely, and up to $25,000/yr can offset ordinary (W-2) income if you actively participate and your MAGI is under $100k (phasing out to $0 by $150k); unused losses carry forward. On sale, claimed depreciation is recaptured at up to 25%, and gains may owe capital-gains tax (a 1031 exchange can defer both). Figures are a year-1 estimate at your 24.0% rate — not tax advice; consult a CPA.
Schools (NCES district)
- District
- Elmore County
- NCES district ID
- 0101290
- Math proficiency
- 27% ▼ -25.00%
- Reading proficiency
- 54% ▲ 3.00%
- Median HH income
- $54,898
- Composite
- 35.27/100
- National rank
- #4974
- State rank
- #21 of 129 in AL
Livability — Coosada
- Score
- 60/100
- State rank
- #285
- US rank
- #18673
Category grades
Schools grade is shown separately in the Schools card above.
Census & demographics
- Census place
- Coosada, AL
- County
- Elmore County · 36,842 people
- City population
- 1,090
- Metro
- Montgomery, AL
- Population (ZIP)
- 14,600
- Household income
- $68,438
- Rent vs Own
- Severe rent burden
- 201.0
Population outlook (Elmore County) Hauer SSP2
- Today (2025)
- 85,154 people
- By 2030
- 86,667 · +1.8%
- By 2040
- 89,014 · +4.5%
- By 2050
- 90,331 · +6.1%
- By 2075
- 96,096 · +12.8%
- By 2100
- 95,290 · +11.9%
Race, ethnicity, and origin ACS 2023
- Neighborhood character
- Diverse neighborhood (Simpson 0.56)
- Race & ethnicity
- White 60% Black 27% Hispanic / Latino 7% Two or more races 5% Asian 1%
- Hispanic origin (detail)
- Mexican 5%
- Common ancestry
- Italian 2% Slovak 1% Lithuanian 1%
- Foreign-born
- 3% · Canada
- Languages at home
- 94% English-only · Spanish 5% Other Indo-European 0%
Political lean MEDSL · Elmore
- 2024 margin
- Solid R (+52.1) · D 23.6% · R 75.6%
- 2008→2024 swing
- -1.1pp toward R · 2008: -50.9pp · 2024: -52.1pp
- All cycles
- 2024: R+52.1 2020: R+48.2 2016: R+52.0 2012: R+48.8 2008: R+50.9
Not yet ingested
- Civics
- —
Market trends
- HPI YoY
- ▼ -55.96%
- Current HPI
- 151.6671
- Rent YoY
- ▲ 9.03%
- Metro
- Montgomery, AL
- State GDP YoY
- ▲ 2.94%
- F500 in state
- 4
Industry mix (Fortune 500 HQ in AL)
| Industry | F500 HQs | Revenue |
|---|---|---|
| Financial Services | 1 | $8B |
|
||
| Healthcare | 1 | $5B |
|
||
Price history
1 event — show timeline
- 2026-06-08 Listed $190,000 MAAR
Property tax history
+7.3%/yrLatest (2025): $424 · +3.2% YoY. Source: county tax records.
Cash-flow waterfall
monthlySold comps — $/sqft
last 12 mo · ≤1 miLoading sold comps…