3819 Crouch Dr · Nashville-Davidson metropolitan government (balance), TN
Flood risk 3/10 · Minor
- FEMA flood zone
- X (unshaded)
- Chance of flooding over 30 yrs
- 0.1%
- Est. flood insurance / yr
- $507 – $1,088
Fire risk 1/10 · Minimal
- Est. fire insurance / yr
- $949 – $1,763
Heat risk 6/10 · Moderate
- Hot days now (above 106°F)
- 7 days/yr
- Hot days in 30 yrs
- 20 days/yr
Wind risk 4/10 · Minor
- Chance of severe wind over 30 yrs
- 9.0%
Air-quality risk 2/10 · Minimal
- Unhealthy air days now
- 1 days/yr
- Unhealthy air days in 30 yrs
- 2 days/yr
Risk factors via First Street. Map © Google.
Why this score? — see what drove the B- grade
The composite is a weighted blend of 9 inputs, each scored 0–100. Each bar is that input's sub-score; the figure is the points it added to the 100-point composite (weight × sub-score).
- Cash flow +26.8/30.0
- ARV discount +15.0/15.0
- DSCR +9.2/10.0
- 1% rule +6.6/10.0
- Rent growth +2.8/5.0
- Livability +2.5/5.0
- Condition / age +2.5/5.0
- Schools +1.4/10.0
- Appreciation +0.0/10.0
$190,000
🖨 Deal sheet 📄 Offer letter ✓ Due diligence
Listing remarks
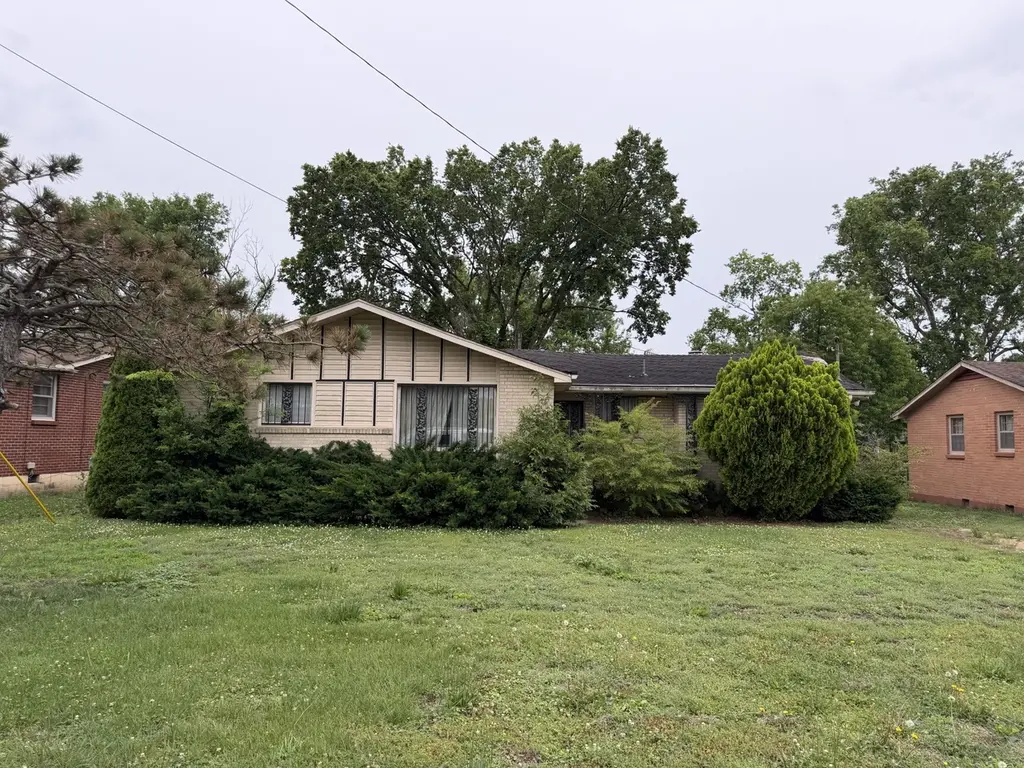
* * * Multiple offers received. Please submit your highest and best offers by noon on June 10. They will be presented to the Seller and you will be notified of the results by 6:30 PM on June 10. * * * This home is a total renovation. This all brick 3 bedroom home need your help!!! Come and make it yours! The roof and HVAC are in need of total replacement. It’s located just minutes from downtown Nashville in the established Haynes Manor subdivision. No HOA. This is the perfect situation for an investor or a homeowner who wants to start from scratch and personalize it in every detail. Has a nice backyard. This house has not been cleared out and is being sold as is. The seller wil
Key facts
- 8,712 sq ft lot
- Parking
- Built 1966
Property features AI
Finance
- Other: Property type listed as residential; Above-grade living area reported as 1,430 square feet (assessor)
- Financial info: No financial rental/income details listed
- HOA & community: No HOA information listed
Exterior
- Parking: Attached carport with 1 covered space (1 total parking space)
- Security: No security features listed
- Utilities: Public water; Public sewer; Water available
- Home design: Single-family residence; One story
- Construction: Brick construction; Brick/mortar foundation; Approximate year built
- Exterior features: Lot approximately 0.2 acres; Lot dimensions about 65 x 132
Interior
- Kitchen: No appliances listed
- Bedrooms: 3 bedrooms, all on the main level
- Flooring: Wood flooring; Vinyl flooring
- Bathrooms: 1 full bathroom; 1 half bathroom
- Heating & cooling: No heating listed; No cooling listed
- Interior features: Wood and vinyl flooring
- Laundry & utility: No laundry or utility appliances listed
Neighborhood map
What this means for you Summary
Snapshot
- This is a 3-bed/1.5-bath single-family listed at $190k.
Deal economics
- At list price, monthly cash flow is $517 ($6k/yr) — positive.
- The deal already cash-flows at list — no discount required.
- Meets the 1% rule at list price ($2k rent vs $190k).
- Cap rate 9.6% vs local median 2.9% in Nashville-Davidson metropolitan government (balance) — top-decile yield for the area; either an underpriced asset or a hidden risk that comps aren't pricing in. Stress-test before assuming the spread holds.
Location & tenants
- Location reads: area grade B — affects rentability + tenant quality, not the cash-flow math above.
- Davidson County (urban): math 12% / reading 19% proficiency, ranked #126 of 139 in TN (top 91%) — low school quality limits family demand, transient renter base, plan for 1-2y turnover; 66% free/reduced lunch — lower-income household profile, screen leases tightly.
- Zoned schools: Cumberland Elementary (math 2% / reading 2%, grade F, #926 of 952 statewide, top 100%, 438 students, 0% FRL); Whites Creek High (math 2% / reading 12%, grade F, #294 of 332 statewide, top 91%, 587 students, 0% FRL) — zoned schools average 0% FRL vs 66% district-wide (66 pts lower); this property's tenant base skews higher-income than the district average.
- Market conditions: Rents rising (+1.3%/yr); 535 active listings in the ZIP; 16 comparable units currently listed for rent nearby; rentals at typical pace (median 17d on market — plan ~3-4 weeks tenant-placement turnaround); 6,873 units permitted in Davidson County in 2024 (4,138 in 5+ unit buildings).
- This rent runs 43% of the median local income ($62k/yr) — at the standard rent-burdened threshold; future hikes will face affordability resistance.
Forward outlook
- Local home prices are declining (-3.0%/yr); year-one equity from $1k of loan paydown is wiped out by about $6k of value loss. Plan a longer hold.
- Davidson County population projected at +42% by 2050 — long-run rental-demand tailwind backs the buy-and-hold thesis.
Negotiation context
- Only 5 days on market — expect competitive offers; lowballing is unlikely to land.
Risks & watch-outs
- Climate carrying-cost: extreme-heat days projected 7→20/yr by 2055 (HVAC capex compounding) — expect insurance premiums to compound above CPI over the hold.
Questions for the listing agent
- Built in 1966 — when were the roof, HVAC, electrical panel, plumbing, and water heater last replaced?
- Is there a deadline driving the sale (1031 exchange, divorce, estate, relocation)? That informs how much negotiation room exists.
- What's the average days-on-market for RENTAL listings here right now (not sales)? A rising rental-DOM trend means longer vacancies and softer asking-rent achievability than the comps imply.
- What's the recent tenant-quality profile in this submarket — average credit score on applications, eviction rate, late-payment / NSF rate, and stable-employment percentage? A property-management company in the area should have these aggregated.
- How much new for-sale + rental construction is in the pipeline within 1–3 miles? Heavy new supply typically softens prices + rents 12–24 months out; constrained supply supports both.
Investment metrics
- 1% rule
- 1.16% ✓
- Cap rate
- 9.56%
- Cash-on-cash
- 11.67%
- DSCR
- 1.52
- GRM
- 7.2
CMA / ARV
- ARV (on-the-fly)
- $321,750
- Comps found
- 12
Show comp detail 12 sales within ~0.75 mi
| Address | Dist | Beds/Ba | Sqft | Sold | Price | $/sf | Match |
|---|---|---|---|---|---|---|---|
| 708 Moormans Arm Rd | 0.27mi | 3/1.0 | 1,430 (0%) | 3mo | $212,500 | $149 | 83 |
| 3805 Dubois Dr | 0.25mi | 3/2.0 | 1,437 (+0%) | 11mo | $324,500 | $226 | 76 |
| 3849 Woodward Dr | 0.42mi | 4/1.5 (+1) | 1,398 (-2%) | 1mo | $340,000 | $243 | 71 |
| 3836 Buena Vista Pike | 0.20mi | 4/1.5 (+1) | 1,509 (+6%) | 8mo | $280,000 | $186 | 70 |
| 3806 Crouch Dr | 0.10mi | 2/2.0 (-1) | 1,356 (-5%) | 14mo | $325,000 | $240 | 68 |
| 3933 Augusta Dr | 0.47mi | 3/2.0 | 1,335 (-7%) | 4mo | $385,000 | $288 | 61 |
| 718 Vanderhorst Dr | 0.23mi | 4/1.5 (+1) | 1,621 (+13%) | 2mo | $230,000 | $142 | 60 |
| 601 Rowan Ct | 0.48mi | 2/2.0 (-1) | 1,484 (+4%) | 13mo | $305,900 | $206 | 54 |
| 3853 Woodward Dr | 0.43mi | 4/2.5 (+1) | 1,570 (+10%) | 5mo | $360,000 | $229 | 50 |
| 737 Troy Dr | 0.52mi | 3/2.0 | 1,590 (+11%) | 12mo | $325,000 | $204 | 45 |
| 3048 Chateau Valley Dr | 0.38mi | 4/2.0 (+1) | 1,643 (+15%) | 8mo | $369,900 | $225 | 44 |
| 692 Rowan Dr | 0.36mi | 4/1.0 (+1) | 1,222 (-14%) | 10mo | $250,000 | $205 | 44 |
Match score weights: distance 35% · size 25% · config 20% · recency 20%. Top-matched comps best support the ARV.
Projected returns pro-forma
-3.0% appreciation · 1.33% rent growth · sell at horizon
- IRR
- -0.8%
- Equity multiple
- 0.97×
- Total profit
- $-1,504
- Equity at exit
- $28,330
- IRR
- 7.2%
- Equity multiple
- 1.50×
- Total profit
- $26,565
- Equity at exit
- $16,428
Cash invested: $53,200 (down + closing). Projections, not guarantees.
Landlord ↔ Tenant lean methodology
- Overall (STATE)
- 87 Strongly Landlord-Friendly
- State Tennessee
- 87 Strongly Landlord-Friendly · R+13
- County
- — inherits STATE
- City
- — inherits STATE
ZIP-level market 37207
- Home prices YoY
- -27.8%
- Rents YoY
- 1.3%
- Active inventory
- 535
- Price-to-rent
- 7.2×
Monthly cashflow live
- Estimated rent
- $2,207 high interval (Pro) →
- Mortgage (P&I)
- −$996
- Tax from tax record
- −$150 /mo · $1,806/yr
- Insurance
- −$79
- HOA
- −$0
- Vacancy / Maint / Mgmt
- −$463
- Net cashflow
- $517
Break-even live
UW: 25.0% down · 7.5% · 30yr · 1.5% tax · 5.0% vac · 8.0% maint · 8.0% mgmt
Financing live
Cash to close
- Down payment
- $47,500
- Closing costs
- $5,700
- Reserves months
- —
- Total cash needed
- —
Loan-product check · same deal, 3 products live
Conventional
25% down · 7.5% · 30yr
- Down + closing
- —
- Monthly P&I
- —
- Monthly cashflow
- —
- DSCR
- —
- Eligible?
- —
Personal DTI + credit; lowest rate.
DSCR
20% down · 8.5% · 30yr
- Down + closing
- —
- Monthly P&I
- —
- Monthly cashflow
- —
- DSCR
- —
- Eligible?
- —
No personal income docs; deal must DSCR.
Hard money
10% down · 12.0% · 12mo
- Down + closing
- —
- Monthly P&I
- —
- Monthly cashflow
- —
- DSCR
- —
- Eligible?
- —
Short-term bridge; refi at stabilization.
Rent comps 16 comps
| Address | Beds | Baths | Sqft | Rent | $/sqft | DOM | Units | Dist |
|---|---|---|---|---|---|---|---|---|
| 780 Garrison Dr Nashville, TN | 2.0 | 1.5 | 1100 | $1,120 | $1.02 | 21d | 1 | 0.47mi |
| 4010 Tucker Rd Nashville, TN | 3.0 | 1.0 | 1200 | $1,850 | $1.54 | 21d | 1 | 0.57mi |
| 812 Shawnwood Cir Nashville, TN | 3.0 | 2.0 | 1100 | $1,795 | $1.63 | 20d | 1 | 0.58mi |
| 2641 Old Buena Vista Rd Nashville, TN | 3.0 | 1.0 | 1200 | $1,700 | $1.42 | 23d | 1 | 0.59mi |
| 970 Youngs Ln Unit A Nashville, TN | 4.0 | 4.0 | 1772 | $4,200 | $2.37 | 17d | 1 | 0.83mi |
| 968 Youngs Ln Unit 1051746P Nashville, TN | 4.0 | 4.0 | 1711 | $6,192 | $3.62 | 3d | 1 | 0.85mi |
| 966 Youngs Ln Unit 1051745P Nashville, TN | 4.0 | 4.0 | 1754 | $7,110 | $4.05 | 7d | 1 | 0.85mi |
| 888 W Trinity Ln Nashville, TN | 1.0–2.0 | 1.0–2.0 | 845 | $1,671 | $1.98 | 1d | 27 | 0.87mi |
| 906A Youngs Ln Nashville, TN | 3.0 | 2.5 | 1850 | $4,500 | $2.43 | 23d | 1 | 1.05mi |
| 2323 Ilolo St Unit 1 Nashville, TN | 3.0 | 1.5 | 1116 | $1,995 | $1.79 | 23d | 1 | 1.17mi |
| 2327 Whites Creek Pike Nashville, TN | 2.0 | 2.0 | 1391 | $1,950 | $1.40 | 7d | 1 | 1.19mi |
| 3212A Lincoln Ave Nashville, TN | 4.0 | 3.0 | 1871 | $2,895 | $1.55 | 7d | 1 | 1.28mi |
| 4064 Cedar Cir Nashville, TN | 3.0 | 2.5 | 1500 | $2,400 | $1.60 | 14d | 1 | 1.36mi |
| 305 Vista Cv Nashville, TN | 3.0 | 2.0 | 1215 | $2,000 | $1.65 | 17d | 1 | 1.37mi |
| 541 Great Circle Rd Nashville, TN | 2.0 | 1.0–2.0 | 800 | $2,050 | $2.56 | 1d | 30 | 1.48mi |
| 613 Youngs Ln Nashville, TN | 2.0 | 2.0 | 1056 | $1,350 | $1.28 | 7d | 1 | 1.49mi |
Listing history 5 events
-
2026-06-13statusdays on market $190,000 Pending 5 DOM
-
2026-06-13days on market $190,000 Active 4 DOM
-
2026-06-10remarks 693-char remark
-
2026-06-08remarks 582-char remark
-
2026-06-08$190,000 Active 1 DOM
ⓘ Source: listings_history table (triggers on properties + properties_extension) + one-shot
backfill from property_details.listing_events for pre-trigger history.
Tax reassessment forecast TN · Resets to sale price
- Current annual tax
- $1,806 · $150/mo
- Projected year-2 tax
- $1,806 · $150/mo
- Expected delta
- $0/yr ($0/mo · 0.0%)
ⓘ Screening estimate from a state-policy table — verify with the county assessor before closing.
Climate risk First Street
- Flood 3/10 Moderate FEMA zone X (unshaded) · 10% chance over 30 yrs
- Wildfire 1/10 Low
- Heat 6/10 Major 7 d/yr ≥106°F today · 20 d/yr by 30 yrs out
- Wind 4/10 Moderate 9% chance of damaging wind over 30 yrs
- Air quality 2/10 Low 1 unhealthy d/yr today · 2 by 30 yrs out
Nearby sold comps map
Loading sold comps map…
Walkable amenities ~0.75 mi
Loading nearby amenities…
Taxation est. · year 1
- Rental income
- $26,482
- − Mortgage interest
- −$10,643
- − Property taxes
- −$1,806
- − Insurance
- −$950
- − Repairs & maintenance
- −$2,119
- − Management
- −$2,119
- − Depreciation
- −$5,527
- Taxable income
- $3,319
- Est. tax owed @ 24.0%
- −$797
- After-tax cash flow
- $5,412/yr
For passive investors: Depreciation is non-cash, so a rental often shows a tax loss while cash-flowing — sheltering income. Rental losses are passive: they offset passive income freely, and up to $25,000/yr can offset ordinary (W-2) income if you actively participate and your MAGI is under $100k (phasing out to $0 by $150k); unused losses carry forward. On sale, claimed depreciation is recaptured at up to 25%, and gains may owe capital-gains tax (a 1031 exchange can defer both). Figures are a year-1 estimate at your 24.0% rate — not tax advice; consult a CPA.
Schools (NCES district)
- District
- Davidson County
- NCES district ID
- 4703180
- Math proficiency
- 12% ▼ -17.00%
- Reading proficiency
- 19% ▼ -7.00%
- Median HH income
- $48,667
- Composite
- 14.03/100
- National rank
- #9472
- State rank
- #126 of 139 in TN
Livability — Nashville-Davidson metropolitan government (balance)
No livability data for this city. (Only ~50 U.S. cities are tracked.)
Census & demographics
- Census place
- Nashville-Davidson metropolitan government (balance), TN
- County
- Davidson County · 680,067 people
- City population
- 677,595
- Metro
- Nashville-Davidson--Murfreesboro--Franklin, TN
- Population (ZIP)
- 41,366
- Household income
- $61,744
- Rent vs Own
- Severe rent burden
- 1969.0
Population outlook (Davidson County) Hauer SSP2
- Today (2025)
- 808,568 people
- By 2030
- 874,489 · +8.2%
- By 2040
- 1,009,046 · +24.8%
- By 2050
- 1,147,294 · +41.9%
- By 2075
- 1,475,439 · +82.5%
- By 2100
- 1,714,101 · +112.0%
Race, ethnicity, and origin ACS 2023
- Neighborhood character
- Diverse neighborhood (Simpson 0.60)
- Race & ethnicity
- Black 57% White 24% Hispanic / Latino 13% Two or more races 8%
- Hispanic origin (detail)
- Mexican 6%
- Common ancestry
- Slovak 2% Serbian 1% Romanian 1%
- Foreign-born
- 10% · Canada, Jamaica
- Languages at home
- 88% English-only · Spanish 10%
Political lean MEDSL · Davidson
- 2024 margin
- Strong D (+27.4) · D 62.7% · R 35.3% · Other 2.0%
- 2008→2024 swing
- +6.5pp toward D · 2008: 21.0pp · 2024: 27.4pp
- All cycles
- 2024: D+27.4 2020: D+32.1 2016: D+26.0 2012: D+18.7 2008: D+21.0
Not yet ingested
- Civics
- —
Market trends
- HPI YoY
- ▼ -135.21%
- Current HPI
- 351.9628
- Rent YoY
- ▲ 1.33%
- Metro
- Nashville-Davidson--Murfreesboro--Franklin, TN
- State GDP YoY
- ▲ 2.78%
- F500 in state
- 22
Industry mix (Fortune 500 HQ in TN)
| Industry | F500 HQs | Revenue |
|---|---|---|
| Healthcare | 3 | $91B |
|
||
| Retail | 3 | $72B |
|
||
| Transportation / Logistics | 1 | $88B |
|
||
| Paper / Packaging | 1 | $19B |
|
||
| Insurance | 1 | $13B |
|
||
| Energy | 1 | $12B |
|
||
Price history
+0.0% since first listed2 events — show timeline
- 2026-06-08 Listed $190,000 REALTRACS as Distributed by MLS Grid
- 2026-06-08 Coming Soon $190,000 REALTRACS as Distributed by MLS Grid
Property tax history
+4.8%/yrLatest (2025): $1,806 · +12.7% YoY. Source: county tax records.
Cash-flow waterfall
monthlySold comps — $/sqft
last 12 mo · ≤1 miLoading sold comps…