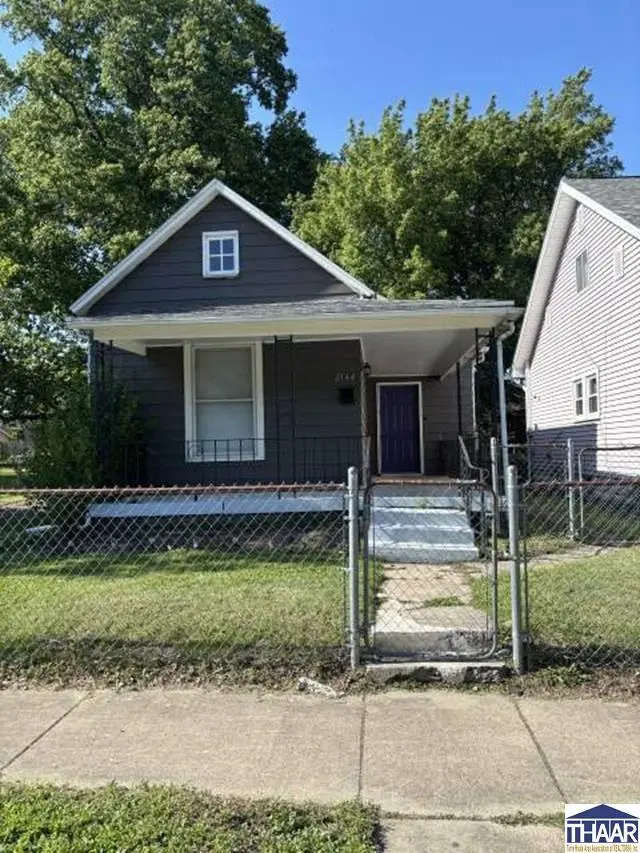
2144 Spruce St · Terre Haute, IN
Flood risk 4/10 · Minor
- FEMA flood zone
- X (unshaded)
- Chance of flooding over 30 yrs
- 0.22%
- Est. flood insurance / yr
- $473 – $860
Fire risk 1/10 · Minimal
- Est. fire insurance / yr
- $717 – $1,331
Heat risk 4/10 · Minor
- Hot days now (above 104°F)
- 7 days/yr
- Hot days in 30 yrs
- 19 days/yr
Wind risk 2/10 · Minimal
- Chance of severe wind over 30 yrs
- 1.0%
Air-quality risk 3/10 · Minor
- Unhealthy air days now
- 3 days/yr
- Unhealthy air days in 30 yrs
- 4 days/yr
Risk factors via First Street. Map © Google.
Why this score? — see what drove the A- grade
The composite is a weighted blend of 9 inputs, each scored 0–100. Each bar is that input's sub-score; the figure is the points it added to the 100-point composite (weight × sub-score).
- Cash flow +30.0/30.0
- ARV discount +13.6/15.0
- 1% rule +10.0/10.0
- DSCR +10.0/10.0
- Appreciation +7.1/10.0
- Livability +3.8/5.0
- Rent growth +3.4/5.0
- Schools +2.9/10.0
- Condition / age +2.5/5.0
$49,900
🖨 Deal sheet 📄 Offer letter ✓ Due diligence
Listing remarks MLS
2 BEDROOM, 1 BATH, COTTAGE STYLE HOME. LARGE LIVING ROOM WITH PLENTY OF ROOM FOR YOU FAMILY. BOTH BEDROOMS ARE A GOOD SIZE. KITCHEN IS A BLANK CANVAS, JUST WAITING FOR YOUR TO DESIGN YOUR DREAM KITCHEN. WAS FORMERLY A DAYCARE, HAS 2 ADDITIONAL ROOMS THAT COULD POSSIBLY, BECOME BEDROOMS. GREAT OPPORTUNITY WITH LOTS OF POTENTIAL.
Key facts
- Covered front porch
- Separate dining room
- Basement
Tags
Property features AI
Exterior
- Parking: Gravel parking
- Security: Smoke detectors
- Utilities: Public sewer
- Home design: Single-family residence; One story
- Construction: Metal siding; Shingle roof
- Exterior features: Covered patio/porch; 50 x 140 lot; R1 zoning
Interior
- Kitchen: Electric range; Electric oven; Refrigerator
- Flooring: Carpet; Vinyl
- Bathrooms: 1 full bathroom
- Heating & cooling: Natural gas heating; Wall/Window air conditioning
- Interior features: Fireplace (1); Partial basement
Neighborhood map
What this means for you Summary
Snapshot
- This is a 2-bed/1.0-bath single-family listed at $50k.
Deal economics
- At list price, monthly cash flow is $322 ($4k/yr) — positive.
- The deal already cash-flows at list — no discount required.
- Meets the 1% rule at list price ($904 rent vs $50k).
- Recommended offer: $49k (1.5% below list) — sets the bar for market timing.
- Cap rate 14.0% vs local median 4.7% in Terre Haute — top-decile yield for the area; either an underpriced asset or a hidden risk that comps aren't pricing in. Stress-test before assuming the spread holds.
Location & tenants
- Location reads 75/100 on livability (#63 in IN, #4,186 nationally) — a middle-class / working-renter tenant base. Strengths: cost of living A+, housing A+, health & safety A+; Watch: crime F, employment F.
- Vigo County School Corporation (urban): math 32% / reading 37% proficiency, ranked #202 of 301 in IN (top 67%) — families likely to look elsewhere, expect single-tenant / working-renter base with shorter leases.
- Zoned schools: Woodrow Wilson Middle School (math 21% / reading 31%, grade F, #240 of 330 statewide, top 73%, 701 students, 62% FRL); Terre Haute North Vigo High School (math 25% / reading 62%, grade F, #191 of 369 statewide, top 52%, 1,507 students, 51% FRL).
- Market conditions: Rents rising (+3.7%/yr); 78 active listings in the ZIP; 13 comparable units currently listed for rent nearby; rentals lingering (median 44d on market — plan ~5-8 weeks vacancy on turnover, expect pricing pressure); 100% of comp listings sitting > 30 days — soft ceiling on asking rent; lower-income renter base — watch delinquency; 60 units permitted in Vigo County in 2024 (0 in 5+ unit buildings).
- This rent runs 44% of the median local income ($25k/yr) — at the standard rent-burdened threshold; future hikes will face affordability resistance.
Forward outlook
- In year one you build about $2k of equity ($345 loan paydown + $2k appreciation (4.1% local appreciation)).
- Vigo County population projected to shrink 5% by 2050 — rents likely to lag national; underwrite the cash flow, not the appreciation.
- At projected returns (4.1% appreciation + 3.7% rent growth), your $14k cash investment doubles in ~3 years — after that, you're playing with house money.
Negotiation context
- It's been on market 24 days — a 2% lower offer ($49k) is reasonable based on typical stale-listing flexibility.
- 3 sale attempts since 9y ago with the ask held roughly flat each time — persistent listings suggest the price (not the market) is what's stuck; bring a comps-based counter.
- Current owner paid $8k; list at $50k implies a 565% gain — meaningful room to come down on a strong offer.
Risks & watch-outs
- Watch-outs: property tax is 2.6% of price; built in 1905 — expect roof / HVAC / electrical / plumbing capex.
Questions for the listing agent
- Built in 1905 — when were the roof, HVAC, electrical panel, plumbing, and water heater last replaced?
- Property tax is high relative to price — has the assessment been appealed recently, and will the sale trigger a re-assessment?
- Is there a deadline driving the sale (1031 exchange, divorce, estate, relocation)? That informs how much negotiation room exists.
- Schools are D-rated, which usually means shorter tenancies and higher turnover. Who's the typical renter profile here, and what's been the actual vacancy rate?
- Crime grade is F in this area — have there been break-ins, vandalism, or insurance claims at this property in the last 3 years? What carrier currently insures it and at what premium?
- What's the average days-on-market for RENTAL listings here right now (not sales)? A rising rental-DOM trend means longer vacancies and softer asking-rent achievability than the comps imply.
- What's the recent tenant-quality profile in this submarket — average credit score on applications, eviction rate, late-payment / NSF rate, and stable-employment percentage? A property-management company in the area should have these aggregated.
- How much new for-sale + rental construction is in the pipeline within 1–3 miles? Heavy new supply typically softens prices + rents 12–24 months out; constrained supply supports both.
Investment metrics
- 1% rule
- 1.81% ✓
- Cap rate
- 14.04%
- Cash-on-cash
- 27.68%
- DSCR
- 2.23
- GRM
- 4.6
CMA / ARV
- ARV (median comp)
- $57,662
- List price
- $49,900
- Delta
- -13.46%
- Verdict
- UNDERPRICED
- Comps
- 20 within 1.0 mi
Show comp detail 12 sales within ~0.75 mi
| Address | Dist | Beds/Ba | Sqft | Sold | Price | $/sf | Match |
|---|---|---|---|---|---|---|---|
| 2250 Tippecanoe St | 0.13mi | 2/1.0 | 1,090 (+2%) | 2mo | $60,000 | $55 | 89 |
| 2802 Fenwood Ave | 0.56mi | 2/1.0 | 1,040 (-2%) | 0mo | $94,500 | $91 | 70 |
| 2321 Tippecanoe St | 0.18mi | 2/1.0 | 912 (-14%) | 1mo | $90,000 | $99 | 67 |
| 136 Monterey Ave | 0.52mi | 2/1.0 | 979 (-8%) | 3mo | $159,000 | $162 | 60 |
| 19 Marigold Pl | 0.56mi | 2/1.0 | 1,008 (-5%) | 6mo | $140,000 | $139 | 60 |
| 1543 3 Ave | 0.54mi | 3/2.0 (+1) | 1,092 (+3%) | 4mo | $103,000 | $94 | 58 |
| 3014 Schaal Ave | 0.71mi | 2/1.0 | 1,120 (+5%) | 3mo | $30,000 | $27 | 56 |
| 1337 3rd Ave | 0.74mi | 2/1.0 | 1,123 (+6%) | 4mo | $69,500 | $62 | 53 |
| 2801 Fenwood Ave | 0.56mi | 2/1.0 | 934 (-12%) | 1mo | $118,000 | $126 | 53 |
| 2031 5th Ave | 0.56mi | 2/1.0 | 926 (-13%) | 0mo | $7,000 | $8 | 52 |
| 2334 5th Ave | 0.57mi | 2/1.0 | 952 (-10%) | 6mo | $10,500 | $11 | 50 |
| 1509 2nd Ave | 0.54mi | 2/2.0 | 1,200 (+13%) | 5mo | $30,000 | $25 | 46 |
Match score weights: distance 35% · size 25% · config 20% · recency 20%. Top-matched comps best support the ARV.
Projected returns pro-forma
4.14% appreciation · 3.74% rent growth · sell at horizon
- IRR
- 36.3%
- Equity multiple
- 3.17×
- Total profit
- $30,338
- Equity at exit
- $25,716
- IRR
- 35.7%
- Equity multiple
- 6.49×
- Total profit
- $76,681
- Equity at exit
- $42,396
Cash invested: $13,972 (down + closing). Projections, not guarantees.
Landlord ↔ Tenant lean methodology
- Overall (STATE)
- 90 Strongly Landlord-Friendly
- State Indiana
- 90 Strongly Landlord-Friendly · R+11
- County
- — inherits STATE
- City
- — inherits STATE
ZIP-level market 47807
- Home prices YoY
- 2.8%
- Rents YoY
- 3.7%
- Active inventory
- 78
- Price-to-rent
- 4.6×
Monthly cashflow live
- Estimated rent
- $904 high interval (Pro) →
- Mortgage (P&I)
- −$262
- Tax from tax record
- −$109 /mo · $1,312/yr
- Insurance
- −$21
- HOA
- −$0
- Vacancy / Maint / Mgmt
- −$190
- Net cashflow
- $322
Break-even live
UW: 25.0% down · 7.5% · 30yr · 1.5% tax · 5.0% vac · 8.0% maint · 8.0% mgmt
Financing live
Cash to close
- Down payment
- $12,475
- Closing costs
- $1,497
- Reserves months
- —
- Total cash needed
- —
Loan-product check · same deal, 3 products live
Conventional
25% down · 7.5% · 30yr
- Down + closing
- —
- Monthly P&I
- —
- Monthly cashflow
- —
- DSCR
- —
- Eligible?
- —
Personal DTI + credit; lowest rate.
DSCR
20% down · 8.5% · 30yr
- Down + closing
- —
- Monthly P&I
- —
- Monthly cashflow
- —
- DSCR
- —
- Eligible?
- —
No personal income docs; deal must DSCR.
Hard money
10% down · 12.0% · 12mo
- Down + closing
- —
- Monthly P&I
- —
- Monthly cashflow
- —
- DSCR
- —
- Eligible?
- —
Short-term bridge; refi at stabilization.
Rent comps 13 comps
| Address | Beds | Baths | Sqft | Rent | $/sqft | DOM | Units | Dist |
|---|---|---|---|---|---|---|---|---|
| 2124 1st Ave Terre Haute, IN | 2.0 | 1.0 | 1208 | $899 | $0.74 | 43d | 1 | 0.32mi |
| 1701 Ohio St Unit C Terre Haute, IN | 2.0 | 1.0 | 880 | $950 | $1.08 | 43d | 1 | 0.67mi |
| 1609 Ohio St Unit 1 Terre Haute, IN, USA Terre Haute, IN | 1.0 | 1.0 | 700 | $785 | $1.12 | 43d | 1 | 0.70mi |
| 1432 4th Ave Terre Haute, IN | 3.0 | 1.0 | 1144 | $1,000 | $0.87 | 43d | 1 | 0.71mi |
| 1915 Poplar St Unit A Terre Haute, IN | 3.0 | 1.0 | 1412 | $1,200 | $0.85 | 43d | 1 | 0.80mi |
| 435 S 18th St Terre Haute, IN | 3.0 | 1.0 | 1108 | $1,050 | $0.95 | 43d | 1 | 0.88mi |
| 433 S 25th St Terre Haute, IN | 2.0 | 1.0 | 760 | $995 | $1.31 | 43d | 1 | 0.89mi |
| 501 S 19th St Terre Haute, IN | 2.0 | 1.0 | 1200 | $975 | $0.81 | 43d | 1 | 0.92mi |
| 2003 N 22nd St Terre Haute, IN | 1.0 | 1.0 | 846 | $650 | $0.77 | 43d | 1 | 1.04mi |
| 1028 N 9th St Terre Haute, IN | 2.0 | 1.0 | 960 | $1,200 | $1.25 | 43d | 1 | 1.11mi |
| 1723 N 11th St Unit 3 Terre Haute, IN | 2.0 | 1.0 | 800 | $800 | $1.00 | 43d | 1 | 1.26mi |
| 1723 N 11th St Unit 2 Terre Haute, IN | 1.0 | 1.0 | 700 | $800 | $1.14 | 43d | 1 | 1.26mi |
| 1320 S 19th St Terre Haute, IN | 2.0 | 1.0 | 830 | $700 | $0.84 | 43d | 1 | 1.45mi |
Listing history 14 events
-
2026-06-09status $49,900 Pending 24 DOM
-
2026-06-08days on market $49,900 Active 24 DOM
-
2026-06-07days on market $49,900 Active 23 DOM
-
2026-06-05days on market $49,900 Active 20 DOM
-
2026-06-02days on market $49,900 Active 18 DOM
-
2026-06-01days on market $49,900 Active 17 DOM
-
2026-05-31days on market $49,900 Active 16 DOM
-
2026-05-30days on market $49,900 Active 15 DOM
-
2026-05-15$49,900 Active 453-char remark
-
2022-09-23status Pending
-
2022-09-19$34,900 Active
-
2018-01-09soldstatus $7,500
-
2017-12-29soldstatus $7,500
Show marketing remark (329 chars)
2 BEDROOM, 1 BATH, COTTAGE STYLE HOME. LARGE LIVING ROOM WITH PLENTY OF ROOM FOR YOU FAMILY. BOTH BEDROOMS ARE A GOOD SIZE. KITCHEN IS A BLANK CANVAS, JUST WAITING FOR YOUR TO DESIGN YOUR DREAM KITCHEN. WAS FORMERLY A DAYCARE, HAS 2 ADDITIONAL ROOMS THAT COULD POSSIBLY, BECOME BEDROOMS. GREAT OPPORTUNITY WITH LOTS OF POTENTIAL.
-
2017-04-25$10,900
Show marketing remark (329 chars)
2 BEDROOM, 1 BATH, COTTAGE STYLE HOME. LARGE LIVING ROOM WITH PLENTY OF ROOM FOR YOU FAMILY. BOTH BEDROOMS ARE A GOOD SIZE. KITCHEN IS A BLANK CANVAS, JUST WAITING FOR YOUR TO DESIGN YOUR DREAM KITCHEN. WAS FORMERLY A DAYCARE, HAS 2 ADDITIONAL ROOMS THAT COULD POSSIBLY, BECOME BEDROOMS. GREAT OPPORTUNITY WITH LOTS OF POTENTIAL.
ⓘ Source: listings_history table (triggers on properties + properties_extension) + one-shot
backfill from property_details.listing_events for pre-trigger history.
Tax reassessment forecast IN · Partial reset (capped growth)
- Current annual tax
- $1,312 · $109/mo
- Projected year-2 tax
- $1,312 · $109/mo
- Expected delta
- $0/yr ($0/mo · 0.0%)
ⓘ Screening estimate from a state-policy table — verify with the county assessor before closing.
Climate risk First Street
- Flood 4/10 Moderate FEMA zone X (unshaded) · 22% chance over 30 yrs
- Wildfire 1/10 Low
- Heat 4/10 Moderate 7 d/yr ≥104°F today · 19 d/yr by 30 yrs out
- Wind 2/10 Low 100% chance of damaging wind over 30 yrs
- Air quality 3/10 Moderate 3 unhealthy d/yr today · 4 by 30 yrs out
Nearby sold comps map
Loading sold comps map…
Walkable amenities ~0.75 mi
Loading nearby amenities…
Taxation est. · year 1
- Rental income
- $10,847
- − Mortgage interest
- −$2,795
- − Property taxes
- −$1,312
- − Insurance
- −$250
- − Repairs & maintenance
- −$868
- − Management
- −$868
- − Depreciation
- −$1,452
- Taxable income
- $3,303
- Est. tax owed @ 24.0%
- −$793
- After-tax cash flow
- $3,074/yr
For passive investors: Depreciation is non-cash, so a rental often shows a tax loss while cash-flowing — sheltering income. Rental losses are passive: they offset passive income freely, and up to $25,000/yr can offset ordinary (W-2) income if you actively participate and your MAGI is under $100k (phasing out to $0 by $150k); unused losses carry forward. On sale, claimed depreciation is recaptured at up to 25%, and gains may owe capital-gains tax (a 1031 exchange can defer both). Figures are a year-1 estimate at your 24.0% rate — not tax advice; consult a CPA.
Schools (NCES district)
- District
- Vigo County School Corporation
- NCES district ID
- 1812090
- Math proficiency
- 32% ▼ -10.00%
- Reading proficiency
- 37% ▼ -8.00%
- Median HH income
- $40,100
- Composite
- 28.97/100
- National rank
- #6625
- State rank
- #202 of 301 in IN
Livability — Terre Haute
- Score
- 75/100
- State rank
- #63
- US rank
- #4186
Category grades
Schools grade is shown separately in the Schools card above.
Census & demographics
- Census place
- Terre Haute, IN
- County
- Vigo County · 91,193 people
- City population
- 91,193
- Metro
- Terre Haute, IN
- Population (ZIP)
- 13,140
- Household income
- $24,706
- Rent vs Own
- Severe rent burden
- 1836.0
Population outlook (Vigo County) Hauer SSP2
- Today (2025)
- 106,366 people
- By 2030
- 105,674 · -0.7%
- By 2040
- 103,731 · -2.5%
- By 2050
- 101,200 · -4.9%
- By 2075
- 95,674 · -10.1%
- By 2100
- 85,910 · -19.2%
Race, ethnicity, and origin ACS 2023
- Neighborhood character
- Predominantly White (74%)
- Race & ethnicity
- White 74% Black 14% Two or more races 8% Hispanic / Latino 4%
- Common ancestry
- Slovak 4% Romanian 2% Lithuanian 1%
- Foreign-born
- 3% · Canada
- Languages at home
- 94% English-only · Spanish 4% Arabic 1%
Political lean MEDSL · Vigo
- 2024 margin
- R (+18.1) · D 40.0% · R 58.1% · Other 2.0%
- 2008→2024 swing
- -33.9pp toward R · 2008: 15.8pp · 2024: -18.1pp
- All cycles
- 2024: R+18.1 2020: R+14.7 2016: R+15.2 2012: D+0.8 2008: D+15.8
Not yet ingested
- Civics
- —
Market trends
- HPI YoY
- ▲ 4.14%
- Current HPI
- 152.8073
- Rent YoY
- ▲ 3.74%
- Metro
- Terre Haute, IN
- State GDP YoY
- ▲ 2.90%
- F500 in state
- 18
Industry mix (Fortune 500 HQ in IN)
| Industry | F500 HQs | Revenue |
|---|---|---|
| Industrial Machinery | 2 | $37B |
|
||
| Healthcare | 1 | $177B |
|
||
| Pharmaceuticals | 1 | $45B |
|
||
| Metals / Steel | 1 | $18B |
|
||
| Agriculture | 1 | $17B |
|
||
| Packaging | 1 | $12B |
|
||
Price history
+357.8% since first listed7 events — show timeline
- 2026-06-08 Pending — THAAR
- 2026-05-15 Listed $49,900 THAAR
- 2022-09-23 Pending — THAAR
- 2022-09-19 Listed $34,900 THAAR
- 2018-01-09 Sold (Public Records) $7,500 Public Records
- 2017-12-29 Sold (MLS) $7,500 THAAR
- 2017-04-25 Listed $10,900 THAAR
Property tax history
-0.9%/yrLatest (2024): $1,312 · +40.8% YoY. Source: county tax records.
Cash-flow waterfall
monthlySold comps — $/sqft
last 12 mo · ≤1 miLoading sold comps…