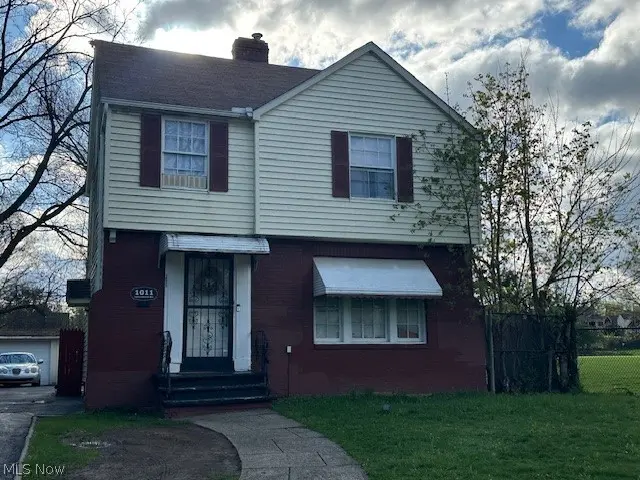
1011 Yellowstone Rd · Cleveland Heights, OH
Flood risk 1/10 · Minimal
- FEMA flood zone
- X (unshaded)
- Chance of flooding over 30 yrs
- 0.0%
- Est. flood insurance / yr
- $473 – $860
Fire risk 1/10 · Minimal
- Est. fire insurance / yr
- $713 – $1,323
Heat risk 2/10 · Minimal
- Hot days now (above 95°F)
- 7 days/yr
- Hot days in 30 yrs
- 15 days/yr
Wind risk 1/10 · Minimal
- Chance of severe wind over 30 yrs
- —
Air-quality risk 3/10 · Minor
- Unhealthy air days now
- 2 days/yr
- Unhealthy air days in 30 yrs
- 5 days/yr
Risk factors via First Street. Map © Google.
Why this score? — see what drove the C- grade
The composite is a weighted blend of 9 inputs, each scored 0–100. Each bar is that input's sub-score; the figure is the points it added to the 100-point composite (weight × sub-score).
- Cash flow +18.8/30.0
- ARV discount +8.9/15.0
- 1% rule +7.3/10.0
- DSCR +5.9/10.0
- Livability +4.5/5.0
- Rent growth +4.2/5.0
- Schools +2.8/10.0
- Condition / age +2.5/5.0
- Appreciation +0.0/10.0
$135,000
🖨 Deal sheet 📄 Offer letter ✓ Due diligence
Listing remarks MLS
Inveestor Delight! Good Location, Next Door To Monticello Middle School. Present All Offers!!!!!
Key facts
- 0.46 acre lot
- 2 garage spots
- Built 1936
Property features AI
Exterior
- Parking: Detached garage and driveway; 2-car garage
- Utilities: Public water; Public sewer
- Home design: Faces northwest
- Construction: Built with aluminum siding; Asphalt/fiberglass roof; Block foundation; Year built per public records
- Exterior features: Property has a view
Interior
- Kitchen: Kitchen on first level
- Bedrooms: Bedrooms on second level (multiple)
- Flooring: Hardwood flooring in living room, dining room and multiple bedrooms; Ceramic tile in second-level bathroom
- Bathrooms: 1 full bathroom; 1 half bathroom; 1 main-level bathroom
- Heating & cooling: Forced air heating; Central air conditioning
- Interior features: Has basement; Has fireplace (1)
- Laundry & utility: Laundry in basement
Neighborhood map
What this means for you Summary
Snapshot
- This is a 3-bed/1.0-bath single-family listed at $135k.
Deal economics
- At list price, monthly cash flow is $135 ($2k/yr) — positive.
- The deal already cash-flows at list — no discount required.
- Meets the 1% rule at list price ($2k rent vs $135k).
- Recommended offer: $131k (3.0% below list) — sets the bar for market timing.
- Cap rate 7.5% vs local median 4.4% in Cleveland Heights — top-decile yield for the area; either an underpriced asset or a hidden risk that comps aren't pricing in. Stress-test before assuming the spread holds.
Location & tenants
- Location reads 89/100 on livability (#12 in OH, #124 nationally) — a professional / high-income tenant draw. Strengths: amenities A+, commute A+, cost of living A+.
- Cleveland Heights-University Heights City (suburban): math 23% / reading 41% proficiency, ranked #568 of 656 in OH (top 87%) — families likely to look elsewhere, expect single-tenant / working-renter base with shorter leases; 64% free/reduced lunch — lower-income household profile, screen leases tightly.
- Market conditions: Rents rising fast (+6.8%/yr); 148 active listings in the ZIP; 37 comparable units currently listed for rent nearby; rentals at typical pace (median 16d on market — plan ~3-4 weeks tenant-placement turnaround); solid renter incomes; 1,441 units permitted in Cuyahoga County in 2024 (700 in 5+ unit buildings).
Forward outlook
- Local home prices are declining (-3.0%/yr); year-one equity from $933 of loan paydown is wiped out by about $4k of value loss. Plan a longer hold.
- Cuyahoga County population projected to shrink 8% by 2050 — rents likely to lag national; underwrite the cash flow, not the appreciation.
- At projected returns (-3.0% appreciation + 6.8% rent growth), your $38k cash investment doubles in ~10 years — after that, you're playing with house money.
Negotiation context
- It's been on market 38 days — a 3% lower offer ($131k) is reasonable based on typical stale-listing flexibility.
- 6 sale attempts since 36y ago with the ask held roughly flat each time — persistent listings suggest the price (not the market) is what's stuck; bring a comps-based counter.
- Current owner paid $60k; list at $135k implies a 125% gain — meaningful room to come down on a strong offer.
Risks & watch-outs
- Watch-outs: property tax is 3.6% of price; built in 1936 — expect roof / HVAC / electrical / plumbing capex.
Questions for the listing agent
- It's been on market 38 days. Have you received any prior offers? Is the seller open to a 3% concession, seller financing, or rate buy-down credit?
- Built in 1936 — when were the roof, HVAC, electrical panel, plumbing, and water heater last replaced?
- Property tax is high relative to price — has the assessment been appealed recently, and will the sale trigger a re-assessment?
- Is there a deadline driving the sale (1031 exchange, divorce, estate, relocation)? That informs how much negotiation room exists.
- Schools are A-rated — typically a magnet for longer-tenancy family renters. What's the average tenant stay here, and is there a school-zone premium baked into asking?
- What's the average days-on-market for RENTAL listings here right now (not sales)? A rising rental-DOM trend means longer vacancies and softer asking-rent achievability than the comps imply.
- What's the recent tenant-quality profile in this submarket — average credit score on applications, eviction rate, late-payment / NSF rate, and stable-employment percentage? A property-management company in the area should have these aggregated.
- How much new for-sale + rental construction is in the pipeline within 1–3 miles? Heavy new supply typically softens prices + rents 12–24 months out; constrained supply supports both.
Investment metrics
- 1% rule
- 1.23% ✓
- Cap rate
- 7.49%
- Cash-on-cash
- 4.28%
- DSCR
- 1.19
- GRM
- 6.8
CMA / ARV
- ARV (on-the-fly)
- $139,358
- Comps found
- 12
Show comp detail 12 sales within ~0.75 mi
| Address | Dist | Beds/Ba | Sqft | Sold | Price | $/sf | Match |
|---|---|---|---|---|---|---|---|
| 994 Yellowstone Ave | 0.04mi | 3/2.0 | 1,190 (+1%) | 2mo | $140,000 | $118 | 91 |
| 2400 Noble Rd | 0.07mi | 4/1.0 (+1) | 1,220 (+3%) | 3mo | $139,900 | $115 | 83 |
| 3639 Randolph Rd | 0.25mi | 3/1.0 | 1,248 (+6%) | 2mo | $130,000 | $104 | 77 |
| 952 Elbon Rd | 0.24mi | 3/2.0 | 1,222 (+4%) | 2mo | $162,000 | $133 | 77 |
| 953 Whitby Rd | 0.41mi | 2/1.5 (-1) | 1,188 (+1%) | 3mo | $145,000 | $122 | 71 |
| 3513 Boynton Rd | 0.42mi | 3/3.0 | 1,178 (-0%) | 2mo | $268,900 | $228 | 70 |
| 3570 Randolph Rd | 0.34mi | 3/1.0 | 1,286 (+9%) | 1mo | $147,500 | $115 | 68 |
| 1004 Woodview Rd | 0.30mi | 3/1.0 | 1,309 (+11%) | 1mo | $91,000 | $70 | 67 |
| 3752 Wallingford Rd | 0.49mi | 3/1.5 | 1,314 (+11%) | 1mo | $190,000 | $145 | 55 |
| 965 Whitby Rd | 0.41mi | 3/1.0 | 1,355 (+15%) | 2mo | $120,000 | $89 | 55 |
| 1090 Hillstone Rd | 0.63mi | 4/1.5 (+1) | 1,309 (+11%) | 2mo | $185,000 | $141 | 44 |
| 945 Dresden Rd | 0.71mi | 3/1.0 | 1,344 (+14%) | 3mo | $85,000 | $63 | 42 |
Match score weights: distance 35% · size 25% · config 20% · recency 20%. Top-matched comps best support the ARV.
Projected returns pro-forma
-3.0% appreciation · 6.85% rent growth · sell at horizon
- IRR
- -4.3%
- Equity multiple
- 0.83×
- Total profit
- $-6,446
- Equity at exit
- $20,129
- IRR
- 10.1%
- Equity multiple
- 1.95×
- Total profit
- $35,765
- Equity at exit
- $11,672
Cash invested: $37,800 (down + closing). Projections, not guarantees.
Landlord ↔ Tenant lean methodology
- Overall (STATE)
- 73 Landlord-Friendly
- State Ohio
- 73 Landlord-Friendly · R+6
- County
- — inherits STATE
- City
- — inherits STATE
ZIP-level market 44121
- Rents YoY
- 6.8%
- Active inventory
- 148
- Price-to-rent
- 6.8×
Monthly cashflow live
- Estimated rent
- $1,657 high interval (Pro) →
- Mortgage (P&I)
- −$708
- Tax from tax record
- −$410 /mo · $4,917/yr
- Insurance
- −$56
- HOA
- −$0
- Vacancy / Maint / Mgmt
- −$348
- Net cashflow
- $135
Break-even live
UW: 25.0% down · 7.5% · 30yr · 1.5% tax · 5.0% vac · 8.0% maint · 8.0% mgmt
Financing live
Cash to close
- Down payment
- $33,750
- Closing costs
- $4,050
- Reserves months
- —
- Total cash needed
- —
Loan-product check · same deal, 3 products live
Conventional
25% down · 7.5% · 30yr
- Down + closing
- —
- Monthly P&I
- —
- Monthly cashflow
- —
- DSCR
- —
- Eligible?
- —
Personal DTI + credit; lowest rate.
DSCR
20% down · 8.5% · 30yr
- Down + closing
- —
- Monthly P&I
- —
- Monthly cashflow
- —
- DSCR
- —
- Eligible?
- —
No personal income docs; deal must DSCR.
Hard money
10% down · 12.0% · 12mo
- Down + closing
- —
- Monthly P&I
- —
- Monthly cashflow
- —
- DSCR
- —
- Eligible?
- —
Short-term bridge; refi at stabilization.
Rent comps 37 comps
| Address | Beds | Baths | Sqft | Rent | $/sqft | DOM | Units | Dist |
|---|---|---|---|---|---|---|---|---|
| 994 Yellowstone Rd Cleveland, OH | 3.0 | 2.0 | 1475 | $1,395 | $0.95 | 2d | 1 | 0.06mi |
| 2481 Noble Rd Cleveland, OH | 1.0–2.0 | 1.0 | 785 | $950 | $1.21 | 16d | 5 | 0.17mi |
| 1007 Elbon Rd Cleveland, OH | 3.0 | 1.0 | 1386 | $1,400 | $1.01 | 10d | 1 | 0.21mi |
| 1035 Elbon Rd Cleveland, OH | 4.0 | 1.5 | 1304 | $1,675 | $1.28 | 16d | 1 | 0.22mi |
| 2270 Noble Rd Cleveland, OH | 2.0 | 1.0 | 800 | $850 | $1.06 | 16d | 1 | 0.30mi |
| 1099 Woodview Rd Cleveland, OH | 4.0 | 1.0 | 1500 | $2,500 | $1.67 | 1d | 1 | 0.34mi |
| 967 Selwyn Rd Cleveland, OH | 3.0 | 1.5 | 1214 | $1,595 | $1.31 | 16d | 1 | 0.37mi |
| 963 Selwyn Rd Cleveland, OH | 4.0 | 1.0 | 1300 | $2,650 | $2.04 | 1d | 1 | 0.37mi |
| 953 Whitby Rd Cleveland, OH | 3.0 | 2.0 | 1188 | $1,575 | $1.33 | 23d | 1 | 0.43mi |
| 2657 Noble Rd Cleveland, OH | 2.0 | 1.0 | 850 | $975 | $1.15 | 19d | 1 | 0.47mi |
| 983 Greyton Rd Cleveland, OH | 3.0 | 2.0 | 1457 | $1,495 | $1.03 | 16d | 1 | 0.49mi |
| 3406 Henderson Rd Cleveland, OH | 4.0 | 1.5 | 1343 | $2,250 | $1.68 | 16d | 1 | 0.51mi |
| 915 Nela View Rd Cleveland, OH | 4.0 | 1.0 | 1300 | $2,600 | $2.00 | 16d | 1 | 0.54mi |
| 3337 Sylvanhurst Rd Cleveland, OH | 3.0 | 1.0 | 1334 | $1,800 | $1.35 | 7d | 1 | 0.61mi |
| 886 Helmsdale Rd Cleveland Heights, OH | 2.0 | 1.0 | 1037 | $995 | $0.96 | 16d | 1 | 0.62mi |
| 2401 N Taylor Rd Cleveland, OH | 3.0 | 1.0 | 1347 | $1,325 | $0.98 | 7d | 1 | 0.66mi |
| 3810 Parkdale Rd Cleveland, OH | 3.0 | 1.5 | 1281 | $2,067 | $1.61 | 2d | 1 | 0.69mi |
| 876 Eloise Dr Unit Upper Cleveland Heights, OH | 2.0 | 1.0 | 1233 | $1,200 | $0.97 | 16d | 1 | 0.72mi |
| 2868 Noble Rd Unit 16 Cleveland Heights, OH | 3.0 | 1.5 | 1200 | $1,750 | $1.46 | 1d | 1 | 0.81mi |
| 2868 Noble Rd Cleveland, OH | 3.0 | 1.5 | 1200 | $1,250 | $1.04 | 23d | 1 | 0.81mi |
| 3755 Mayfield Rd Cleveland Heights, OH | 1.0–2.0 | 1.0 | 800 | $1,175 | $1.47 | 23d | 1 | 0.84mi |
| 1462 Parkhill Rd Cleveland, OH | 4.0 | 1.0 | 1451 | $1,950 | $1.34 | 1d | 1 | 0.94mi |
| 35 Severance Cir Cleveland Heights, OH | 1.0–2.0 | 1.0–2.0 | 832 | $1,570 | $1.89 | 1d | 26 | 1.03mi |
| 16000 Terrace Rd Cleveland, OH | 1.0–3.0 | 1.0–2.0 | 1000 | $1,210 | $1.21 | 1d | 39 | 1.04mi |
| 1497 S Noble Rd Cleveland, OH | 4.0 | 1.0 | 1250 | $2,650 | $2.12 | 1d | 1 | 1.08mi |
| 303 S Green Rd Cleveland, OH | 4.0 | 2.0 | 1381 | $1,700 | $1.23 | 1d | 1 | 1.12mi |
| 1584 Maple Rd Cleveland, OH | 3.0 | 2.0 | 1359 | $1,700 | $1.25 | 23d | 1 | 1.15mi |
| 1867 N Taylor Rd Apt 309 Cleveland, OH | 2.0 | 1.0 | 850 | $700 | $0.82 | 43d | 1 | 1.17mi |
| 1478 Sherbrook Rd Cleveland, OH | 3.0 | 1.0 | 1170 | $1,195 | $1.02 | 43d | 1 | 1.19mi |
| 30 Severance Cir Cleveland Heights, OH | 1.0–2.0 | 1.0–2.0 | 762 | $1,700 | $2.23 | 2d | 18 | 1.19mi |
| 1462 Felton Rd Cleveland, OH | 3.0 | 1.0 | 1222 | $1,500 | $1.23 | 16d | 1 | 1.26mi |
| 1405 Villa Dr Cleveland, OH | 4.0 | 1.5 | 1480 | $1,790 | $1.21 | 16d | 1 | 1.26mi |
| 1801 Stanwood Rd Unit 13 East Cleveland, OH | 2.0 | 1.0 | 800 | $900 | $1.12 | 43d | 1 | 1.39mi |
| 1726 Taylor Rd East Cleveland, OH | 2.0 | 1.0 | 900 | $972 | $1.08 | 43d | 1 | 1.43mi |
| 15421 Plymouth Pl East Cleveland, OH | 2.0 | 1.0 | 950 | $972 | $1.02 | 43d | 1 | 1.44mi |
| 3411 Beechwood Ave Unit 2nd floor Cleveland Heights, OH | 3.0 | 1.0 | 1452 | $1,687 | $1.16 | 4d | 1 | 1.47mi |
| 1599 Felton Rd Cleveland, OH | 3.0 | 1.5 | 1248 | $1,650 | $1.32 | 43d | 1 | 1.48mi |
Listing history 20 events
-
2026-06-05statusdays on market $135,000 Pending 38 DOM
-
2026-06-03days on market $135,000 Active 37 DOM
-
2026-06-02days on market $135,000 Active 36 DOM
-
2026-06-01days on market $135,000 Active 35 DOM
-
2026-05-31days on market $135,000 Active 34 DOM
-
2026-04-23$135,000 Active
-
2017-08-31soldstatus $59,900
-
2007-06-30historical
-
2007-01-31$129,000
-
2006-09-13soldstatus $66,210
-
2003-10-07soldstatus $83,800 97-char remark
Show marketing remark (97 chars)
Inveestor Delight! Good Location, Next Door To Monticello Middle School. Present All Offers!!!!!
-
2003-10-07soldstatus $83,800
Show marketing remark (97 chars)
Inveestor Delight! Good Location, Next Door To Monticello Middle School. Present All Offers!!!!!
-
2003-07-03$79,000 97-char remark
Show marketing remark (97 chars)
Inveestor Delight! Good Location, Next Door To Monticello Middle School. Present All Offers!!!!!
-
1994-08-28historical
-
1994-06-20historical
-
1994-03-17$82,900
-
1994-02-25$84,900
-
1991-08-26soldstatus $65,500
-
1991-06-10historical
-
1990-11-30$66,000
ⓘ Source: listings_history table (triggers on properties + properties_extension) + one-shot
backfill from property_details.listing_events for pre-trigger history.
Tax reassessment forecast OH · Partial reset (capped growth)
- Current annual tax
- $4,917 · $410/mo
- Projected year-2 tax
- $4,917 · $410/mo
- Expected delta
- $0/yr ($0/mo · 0.0%)
ⓘ Screening estimate from a state-policy table — verify with the county assessor before closing.
Climate risk First Street
- Flood 1/10 Low FEMA zone X (unshaded) · 0% chance over 30 yrs
- Wildfire 1/10 Low
- Heat 2/10 Low 7 d/yr ≥95°F today · 15 d/yr by 30 yrs out
- Wind 1/10 Low
- Air quality 3/10 Moderate 2 unhealthy d/yr today · 5 by 30 yrs out
Nearby sold comps map
Loading sold comps map…
Walkable amenities ~0.75 mi
Loading nearby amenities…
Taxation est. · year 1
- Rental income
- $19,881
- − Mortgage interest
- −$7,562
- − Property taxes
- −$4,917
- − Insurance
- −$675
- − Repairs & maintenance
- −$1,590
- − Management
- −$1,590
- − Depreciation
- −$3,927
- Taxable loss
- −$381
- Est. tax savings @ 24.0%
- +$92
- After-tax cash flow
- $1,710/yr
For passive investors: Depreciation is non-cash, so a rental often shows a tax loss while cash-flowing — sheltering income. Rental losses are passive: they offset passive income freely, and up to $25,000/yr can offset ordinary (W-2) income if you actively participate and your MAGI is under $100k (phasing out to $0 by $150k); unused losses carry forward. On sale, claimed depreciation is recaptured at up to 25%, and gains may owe capital-gains tax (a 1031 exchange can defer both). Figures are a year-1 estimate at your 24.0% rate — not tax advice; consult a CPA.
Schools (NCES district)
- District
- Cleveland Heights-University Heights City
- NCES district ID
- 3904379
- Math proficiency
- 23% ▼ -22.00%
- Reading proficiency
- 41% ▼ -12.00%
- Median HH income
- $53,451
- Composite
- 28.12/100
- National rank
- #6822
- State rank
- #568 of 656 in OH
Livability — Cleveland Heights
- Score
- 89/100
- State rank
- #12
- US rank
- #124
Category grades
Schools grade is shown separately in the Schools card above.
Census & demographics
- Census place
- Cleveland Heights, OH
- County
- Cuyahoga County · 1,090,369 people
- City population
- 32,312
- Metro
- Cleveland-Elyria, OH
- Population (ZIP)
- 32,312
- Household income
- $76,767
- Rent vs Own
- Severe rent burden
- 672.0
Population outlook (Cuyahoga County) Hauer SSP2
- Today (2025)
- 1,244,621 people
- By 2030
- 1,230,093 · -1.2%
- By 2040
- 1,189,108 · -4.5%
- By 2050
- 1,145,706 · -7.9%
- By 2075
- 1,076,557 · -13.5%
- By 2100
- 978,987 · -21.3%
Race, ethnicity, and origin ACS 2023
- Neighborhood character
- Diverse neighborhood (Simpson 0.56)
- Race & ethnicity
- Black 55% White 36% Two or more races 4% Hispanic / Latino 3% Asian 2%
- Common ancestry
- Romanian 3% Italian 2% Scotch-Irish 2%
- Foreign-born
- 5% · Canada, China, India
- Languages at home
- 92% English-only · Spanish 2% Chinese 1% Other Indo-European 1%
Political lean MEDSL · Cuyahoga
- 2024 margin
- Solid D (+31.5) · D 65.4% · R 33.9%
- 2008→2024 swing
- -7.4pp toward R · 2008: 38.9pp · 2024: 31.5pp
- All cycles
- 2024: D+31.5 2020: D+34.1 2016: D+35.0 2012: D+38.7 2008: D+38.9
Not yet ingested
- Civics
- —
Market trends
- HPI YoY
- ▼ -180.15%
- Current HPI
- 173.7405
- Rent YoY
- ▲ 6.85%
- Metro
- Cleveland-Elyria, OH
- State GDP YoY
- ▲ 1.98%
- F500 in state
- 48
Industry mix (Fortune 500 HQ in OH)
| Industry | F500 HQs | Revenue |
|---|---|---|
| Insurance | 3 | $145B |
|
||
| Industrial Machinery | 3 | $49B |
|
||
| Financial Services | 3 | $24B |
|
||
| Consumer Goods | 2 | $93B |
|
||
| Aerospace / Defense | 2 | $47B |
|
||
| Utilities | 2 | $33B |
|
||
Price history
+104.5% since first listed15 events — show timeline
- 2026-04-23 Listed $135,000 MLSNOW
- 2017-08-31 Sold (Public Records) $59,900 Public Records
- 2007-06-30 Listing Removed — MLSNOW
- 2007-01-31 Listed $129,000 MLSNOW
- 2006-09-13 Sold (Public Records) $66,210 Public Records
- 2003-10-07 Sold (Public Records) $83,800 Public Records
- 2003-10-07 Sold (MLS) $83,800 MLSNOW
- 2003-07-03 Listed $79,000 MLSNOW
- 1994-08-28 Listing Removed — MLSNOW
- 1994-06-20 Listing Removed — MLSNOW
- 1994-03-17 Listed $82,900 MLSNOW
- 1994-02-25 Listed $84,900 MLSNOW
- 1991-08-26 Sold (Public Records) $65,500 Public Records
- 1991-06-10 Listing Removed — MLSNOW
- 1990-11-30 Listed $66,000 MLSNOW
Property tax history
+8.6%/yrLatest (2025): $4,917 · -1.7% YoY. Source: county tax records.
Cash-flow waterfall
monthlySold comps — $/sqft
last 12 mo · ≤1 miLoading sold comps…