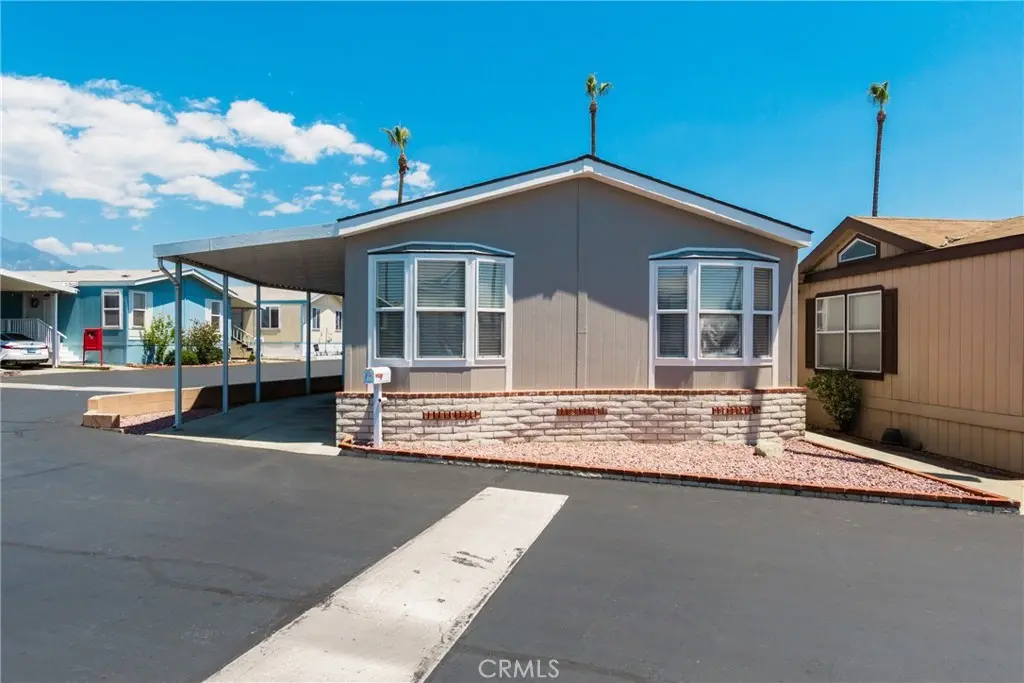
1565 W Arrow Hwy Space C23 Unit C23 · Upland, CA
Flood risk 1/10 · Minimal
- FEMA flood zone
- X (unshaded)
- Chance of flooding over 30 yrs
- 0.0%
- Est. flood insurance / yr
- $507 – $1,088
Fire risk 1/10 · Minimal
- Est. fire insurance / yr
- $659 – $1,223
Heat risk 7/10 · Major
- Hot days now (above 99°F)
- 6 days/yr
- Hot days in 30 yrs
- 18 days/yr
Wind risk 1/10 · Minimal
- Chance of severe wind over 30 yrs
- —
Air-quality risk 8/10 · Major
- Unhealthy air days now
- 16 days/yr
- Unhealthy air days in 30 yrs
- 19 days/yr
Risk factors via First Street. Map © Google.
Why this score? — see what drove the D+ grade
The composite is a weighted blend of 9 inputs, each scored 0–100. Each bar is that input's sub-score; the figure is the points it added to the 100-point composite (weight × sub-score).
- Cash flow +23.3/30.0
- DSCR +7.5/10.0
- 1% rule +6.1/10.0
- Schools +4.3/10.0
- Livability +3.6/5.0
- Condition / age +2.5/5.0
- Rent growth +2.4/5.0
- ARV discount +0.0/15.0
- Appreciation +0.0/10.0
$209,000
🖨 Deal sheet 📄 Offer letter ✓ Due diligence
Listing remarks
Welcome to this tastefully updated manufactured home located in the Oasis Mobile Estates park of west Upland. Featuring three bedrooms, two bathrooms, a spacious kitchen and living room, a laundry room, and so much more. Moving to the exterior of the property you have one covered parking space and two additional spots (one sized for a compact car) to the side of the home along with a storage shed. The property has recently been upgraded with fresh exterior and interior paint, new interior electrical outlets and switches ("Leviton" brand), and a brand new dishwasher. The Hot water heater has been replaced within the past two years, and the HVAC on the property works great. Washer,
Key facts
- Brand new dishwasher
- Spacious kitchen
- Storage shed
Tags
Property features AI
Finance
- Other: Urban community setting; Park name: Oasis Mobile Estates
- HOA & community: Part of Oasis Mobile Estates association; Association fees paid monthly; Park requires manager approval; Land lease of $1,125 per month (park-provided)
Exterior
- Parking: Located in Oasis Mobile Estates
- Utilities: Public sewer
- Home design: Single-story mobile home; Model 13403B; Mobile home remains on site
- Construction: Year built as provided by builder
- Exterior features: Community pool; Corner lot; Has a view
Interior
- Kitchen: Microwave; Gas range and gas oven; Dishwasher
- Bathrooms: 2 full bathrooms
- Heating & cooling: Central cooling; Central furnace heating
- Interior features: Front and back door entry; Single-level entry
- Laundry & utility: Washer included; Dryer included
Neighborhood map
What this means for you Summary
Snapshot
- This is a 2-bed/2.0-bath manufactured listed at $209k.
Deal economics
- At list price, monthly cash flow is $381 ($5k/yr) — positive.
- The deal already cash-flows at list — no discount required.
- Meets the 1% rule at list price ($2k rent vs $209k).
- Recommended offer: $203k (3.0% below list) — sets the bar for market timing.
- Cap rate 8.5% vs local median 2.7% in Upland — top-decile yield for the area; either an underpriced asset or a hidden risk that comps aren't pricing in. Stress-test before assuming the spread holds.
Location & tenants
- Location reads 72/100 on livability (#184 in CA) — a middle-class / working-renter tenant base. Strengths: amenities A+, commute A+, employment A; Watch: crime C-, health & safety C-, cost of living F.
- Upland Unified (suburban): math 39% / reading 53% proficiency, ranked #493 of 1,400 in CA (top 35%) — families likely to look elsewhere, expect single-tenant / working-renter base with shorter leases.
- Market conditions: Rents soft (-0.3%/yr); 84 active listings in the ZIP; 40 comparable units currently listed for rent nearby; rentals at typical pace (median 18d on market — plan ~3-4 weeks tenant-placement turnaround); solid renter incomes; 5,458 units permitted in San Bernardino County in 2024 (1,500 in 5+ unit buildings).
Forward outlook
- Local home prices are declining (-3.0%/yr); year-one equity from $1k of loan paydown is wiped out by about $6k of value loss. Plan a longer hold.
- San Bernardino County population projected at +15% by 2050 — modest demand growth; plan on rents tracking national, not racing it.
Negotiation context
- It's been on market 47 days — a 3% lower offer ($203k) is reasonable based on typical stale-listing flexibility.
Risks & watch-outs
- Climate carrying-cost: extreme-heat days projected 6→18/yr by 2055 (HVAC capex compounding) — expect insurance premiums to compound above CPI over the hold.
Questions for the listing agent
- It's been on market 47 days. Have you received any prior offers? Is the seller open to a 3% concession, seller financing, or rate buy-down credit?
- Is there a deadline driving the sale (1031 exchange, divorce, estate, relocation)? That informs how much negotiation room exists.
- The area grade is low — what's the realistic commute time and amenity access for the typical tenant pool here? Any planned neighborhood developments (good or bad) we should know about?
- What's the average days-on-market for RENTAL listings here right now (not sales)? A rising rental-DOM trend means longer vacancies and softer asking-rent achievability than the comps imply.
- What's the recent tenant-quality profile in this submarket — average credit score on applications, eviction rate, late-payment / NSF rate, and stable-employment percentage? A property-management company in the area should have these aggregated.
- How much new for-sale + rental construction is in the pipeline within 1–3 miles? Heavy new supply typically softens prices + rents 12–24 months out; constrained supply supports both.
Investment metrics
- 1% rule
- 1.11% ✓
- Cap rate
- 8.48%
- Cash-on-cash
- 7.82%
- DSCR
- 1.35
- GRM
- 7.5
CMA / ARV
- ARV (median comp)
- $170,000
- List price
- $209,000
- Delta
- 22.94%
- Verdict
- OVERPRICED
- Comps
- 4 within 1.0 mi
Projected returns pro-forma
-3.0% appreciation · 0.0% rent growth · sell at horizon
- IRR
- -7.8%
- Equity multiple
- 0.72×
- Total profit
- $-16,326
- Equity at exit
- $31,163
- IRR
- -2.6%
- Equity multiple
- 0.85×
- Total profit
- $-8,984
- Equity at exit
- $18,071
Cash invested: $58,520 (down + closing). Projections, not guarantees.
Landlord ↔ Tenant lean methodology
- Overall (STATE)
- 18 Strongly Tenant-Friendly
- State California
- 18 Strongly Tenant-Friendly · D+13
- County
- — inherits STATE
- City
- — inherits STATE
ZIP-level market 91786
- Rents YoY
- -0.3%
- Active inventory
- 84
- Price-to-rent
- 7.5×
Monthly cashflow live
- Estimated rent
- $2,311 high interval (Pro) →
- Mortgage (P&I)
- −$1,096
- Tax est. 1.5%
- −$261 /mo · $3,135/yr
- Insurance
- −$87
- HOA
- −$0
- Vacancy / Maint / Mgmt
- −$485
- Net cashflow
- $381
Break-even live
UW: 25.0% down · 7.5% · 30yr · 1.5% tax · 5.0% vac · 8.0% maint · 8.0% mgmt
Financing live
Cash to close
- Down payment
- $52,250
- Closing costs
- $6,270
- Reserves months
- —
- Total cash needed
- —
Loan-product check · same deal, 3 products live
Conventional
25% down · 7.5% · 30yr
- Down + closing
- —
- Monthly P&I
- —
- Monthly cashflow
- —
- DSCR
- —
- Eligible?
- —
Personal DTI + credit; lowest rate.
DSCR
20% down · 8.5% · 30yr
- Down + closing
- —
- Monthly P&I
- —
- Monthly cashflow
- —
- DSCR
- —
- Eligible?
- —
No personal income docs; deal must DSCR.
Hard money
10% down · 12.0% · 12mo
- Down + closing
- —
- Monthly P&I
- —
- Monthly cashflow
- —
- DSCR
- —
- Eligible?
- —
Short-term bridge; refi at stabilization.
Rent comps 40 comps
| Address | Beds | Baths | Sqft | Rent | $/sqft | DOM | Units | Dist |
|---|---|---|---|---|---|---|---|---|
| 850 N Benson Ave Upland, CA | 1.0–2.0 | 1.0 | 815 | $2,445 | $3.00 | 4d | 14 | 0.23mi |
| 435 N Terry Way Unit 449-C Upland, CA | 2.0 | 1.5 | 1007 | $2,100 | $2.09 | 43d | 1 | 0.29mi |
| 1790 W Arrow Rte Upland, CA | 2.0 | 2.0 | 1070 | $2,402 | $2.25 | 5d | 3 | 0.31mi |
| 1358 W Arrow Hwy Unit A Upland, CA | 2.0 | 1.5 | 1007 | $2,100 | $2.09 | 24d | 1 | 0.34mi |
| 1324 W Winn Dr Unit D Upland, CA | 2.0 | 1.5 | 900 | $2,395 | $2.66 | 43d | 1 | 0.37mi |
| 638 Silverwood Ave Unit 3 Upland, CA | 1.0 | 1.0 | 600 | $1,725 | $2.88 | 43d | 1 | 0.41mi |
| 638 Silverwood Ave Apt 5 Upland, CA | 2.0 | 1.0 | 750 | $1,950 | $2.60 | 43d | 1 | 0.41mi |
| 550 Silverwood Ave Unit A Upland, CA | 1.0 | 1.0 | 700 | $1,725 | $2.46 | 43d | 1 | 0.41mi |
| 538 Silverwood Ave Unit C Upland, CA | 2.0 | 1.0 | 850 | $1,975 | $2.32 | 43d | 1 | 0.41mi |
| 1430 W Foothill Blvd Upland, CA | 1.0 | 1.0 | 585 | $2,295 | $3.92 | 1d | 1 | 0.42mi |
| 1256 W Arrow Hwy Upland, CA | 2.0 | 1.0–2.0 | 730 | $2,015 | $2.76 | 2d | 5 | 0.47mi |
| 1334 W Foothill Blvd Upland, CA | 1.0–2.0 | 1.0–2.0 | 770 | $2,365 | $3.07 | 1d | 19 | 0.50mi |
| 1233 Woodbury Ct Upland, CA | 2.0 | 2.0 | 975 | $2,250 | $2.31 | 22d | 1 | 0.51mi |
| 859 N Mountain Ave Upland, CA | 1.0–2.0 | 1.0–2.0 | 865 | $2,490 | $2.88 | 5d | 1 | 0.54mi |
| 1394 Springfield St Upland, CA | 2.0 | 1.5 | 1007 | $2,150 | $2.14 | 1d | 1 | 0.55mi |
| 1425 Springfield St Upland, CA | 2.0 | 2.0 | 970 | $1,950 | $2.01 | 24d | 1 | 0.56mi |
| 194 Genoa Way Unit B Upland, CA | 2.0 | 1.5 | 749 | $2,400 | $3.20 | 43d | 1 | 0.58mi |
| 1540 W 8th St Upland, CA | 2.0 | 1.0–2.0 | 790 | $2,649 | $3.35 | 1d | 10 | 0.61mi |
| 104 Sinclair Ave #1 Upland, CA | 2.0 | 1.0 | 810 | $2,500 | $3.09 | 18d | 1 | 0.65mi |
| 104 Sinclair Ave Upland, CA | 2.0 | 1.0 | 840 | $2,500 | $2.98 | 16d | 1 | 0.65mi |
| 1301 W 8th St Upland, CA | 2.0 | 1.0 | 882 | $2,400 | $2.72 | 43d | 1 | 0.70mi |
| 2100 W Arrow Rte Upland, CA | 1.0–2.0 | 1.0–2.0 | 940 | $2,840 | $3.02 | 1d | 10 | 0.70mi |
| 1386 W 8th St Upland, CA | 3.0 | 2.0 | 1125 | $2,700 | $2.40 | 43d | 1 | 0.70mi |
| 162 Linda Way Upland, CA | 2.0 | 1.5 | 800 | $2,250 | $2.81 | 24d | 1 | 0.74mi |
| 1539 W 7th St Upland, CA | 2.0 | 1.0–1.5 | 772 | $2,480 | $3.21 | 20d | 10 | 0.76mi |
| 1082 W Pine St Unit B Upland, CA | 1.0 | 1.0 | 800 | $1,800 | $2.25 | 43d | 1 | 0.93mi |
| 1076 W Pine St Unit B Upland, CA | 1.0 | 1.0 | 800 | $1,700 | $2.12 | 2d | 1 | 0.93mi |
| 5038 Birch St Montclair, CA | 3.0 | 1.0–2.0 | 887 | $3,372 | $3.80 | 1d | 106 | 0.96mi |
| 1061 W Bennington St Apt B Upland, CA | 2.0 | 1.0 | 960 | $2,200 | $2.29 | 5d | 1 | 1.01mi |
| 2398 W Arrow Rte Upland, CA | 1.0–3.0 | 1.0–3.5 | 1231 | $3,262 | $2.65 | 1d | 6 | 1.04mi |
| 1015 W Bennington St Unit D Upland, CA | 2.0 | 1.0 | 800 | $2,385 | $2.98 | 2d | 1 | 1.06mi |
| 854 Orchid Ct Unit G Upland, CA | 2.0 | 2.0 | 1050 | $1,900 | $1.81 | 24d | 1 | 1.07mi |
| 811 Orchid Ct Unit J Upland, CA | 2.0 | 2.0 | 830 | $2,300 | $2.77 | 22d | 1 | 1.13mi |
| 360 N San Antonio Ave Unit I Upland, CA | 1.0 | 1.0 | 535 | $1,795 | $3.36 | 43d | 1 | 1.13mi |
| 1040 W 7th St Upland, CA | 1.0–2.0 | 1.0 | 790 | $2,099 | $2.66 | 4d | 2 | 1.17mi |
| 1390 W 15th St Upland, CA | 1.0 | 1.0 | 670 | $1,850 | $2.76 | 18d | 1 | 1.17mi |
| 250 N College Park Dr Upland, CA | 1.0–3.0 | 1.0–2.0 | 1044 | $3,131 | $3.00 | 1d | 28 | 1.21mi |
| 968 W 7th St Upland, CA | 1.0–2.0 | 1.0 | 850 | $2,595 | $3.05 | 2d | 1 | 1.22mi |
| 4914 Olive St Montclair, CA | 1.0–3.0 | 1.0–3.0 | 1001 | $3,152 | $3.15 | 1d | 20 | 1.24mi |
| 4868 Cypress St Montclair, CA | 2.0 | 1.0–2.5 | 962 | $3,615 | $3.76 | 1d | 17 | 1.25mi |
Listing history 15 events
-
2026-06-18days on market $209,000 Active 47 DOM
-
2026-06-17days on market $209,000 Active 46 DOM
-
2026-06-16days on market $209,000 Active 45 DOM
-
2026-06-15days on market $209,000 Active 44 DOM
-
2026-06-13days on market $209,000 Active 42 DOM
-
2026-06-13pricedays on market $209,000 Active 41 DOM
-
2026-06-09days on market $215,000 Active 38 DOM
-
2026-06-08days on market $215,000 Active 37 DOM
-
2026-06-07days on market $215,000 Active 36 DOM
-
2026-06-04days on market $215,000 Active 33 DOM
-
2026-06-03days on market $215,000 Active 32 DOM
-
2026-06-02days on market $215,000 Active 31 DOM
-
2026-06-01days on market $215,000 Active 30 DOM
-
2026-05-31days on market $215,000 Active 29 DOM
-
2026-05-02$220,000 Active 926-char remark
ⓘ Source: listings_history table (triggers on properties + properties_extension) + one-shot
backfill from property_details.listing_events for pre-trigger history.
Climate risk First Street
- Flood 1/10 Low FEMA zone X (unshaded) · 0% chance over 30 yrs
- Wildfire 1/10 Low
- Heat 7/10 Severe 6 d/yr ≥99°F today · 18 d/yr by 30 yrs out
- Wind 1/10 Low
- Air quality 8/10 Severe 16 unhealthy d/yr today · 19 by 30 yrs out
Nearby sold comps map
Loading sold comps map…
Walkable amenities ~0.75 mi
Loading nearby amenities…
Taxation est. · year 1
- Rental income
- $27,730
- − Mortgage interest
- −$11,707
- − Property taxes
- −$3,135
- − Insurance
- −$1,045
- − Repairs & maintenance
- −$2,218
- − Management
- −$2,218
- − Depreciation
- −$6,080
- Taxable income
- $1,326
- Est. tax owed @ 24.0%
- −$318
- After-tax cash flow
- $4,256/yr
For passive investors: Depreciation is non-cash, so a rental often shows a tax loss while cash-flowing — sheltering income. Rental losses are passive: they offset passive income freely, and up to $25,000/yr can offset ordinary (W-2) income if you actively participate and your MAGI is under $100k (phasing out to $0 by $150k); unused losses carry forward. On sale, claimed depreciation is recaptured at up to 25%, and gains may owe capital-gains tax (a 1031 exchange can defer both). Figures are a year-1 estimate at your 24.0% rate — not tax advice; consult a CPA.
Schools (NCES district)
- District
- Upland Unified
- NCES district ID
- 0600016
- Math proficiency
- 39% ▲ 1.00%
- Reading proficiency
- 53% ▬ 0.00%
- Median HH income
- $66,267
- Composite
- 43.17/100
- National rank
- #6593
- State rank
- #493 of 1400 in CA
Livability — Upland
- Score
- 72/100
- State rank
- #184
- US rank
- #6041
Category grades
Schools grade is shown separately in the Schools card above.
Census & demographics
- Census place
- Upland, CA
- County
- San Bernardino County · 2,030,291 people
- City population
- 82,715
- Metro
- Riverside-San Bernardino-Ontario, CA
- Population (ZIP)
- 55,829
- Household income
- $92,458
- Rent vs Own
- Severe rent burden
- 2409.0
Population outlook (San Bernardino County) Hauer SSP2
- Today (2025)
- 2,300,329 people
- By 2030
- 2,378,907 · +3.4%
- By 2040
- 2,523,137 · +9.7%
- By 2050
- 2,642,388 · +14.9%
- By 2075
- 2,880,769 · +25.2%
- By 2100
- 2,909,436 · +26.5%
Race, ethnicity, and origin ACS 2023
- Neighborhood character
- Diverse neighborhood (Simpson 0.65)
- Race & ethnicity
- Hispanic / Latino 50% White 30% Two or more races 20% Asian 8% Black 7% Native American 1%
- Hispanic origin (detail)
- Mexican 40%
- Common ancestry
- Romanian 1% Lithuanian 1% Italian 1%
- Foreign-born
- 19% · Canada, China, South Korea
- Languages at home
- 66% English-only · Spanish 24% Chinese 2% Other Indo-European 2%
Political lean MEDSL · San Bernardino
- 2024 margin
- Toss-up / Even · D 47.5% · R 49.7% · Other 2.8%
- 2008→2024 swing
- -8.5pp toward R · 2008: 6.3pp · 2024: -2.1pp
- All cycles
- 2024: R+2.1 2020: D+10.7 2016: D+9.8 2012: D+5.4 2008: D+6.3
Not yet ingested
- Civics
- —
Market trends
- HPI YoY
- ▼ -771.58%
- Current HPI
- 379.2283
- Rent YoY
- ▼ -0.27%
- Metro
- Riverside-San Bernardino-Ontario, CA
- State GDP YoY
- ▲ 3.21%
- F500 in state
- 116
Industry mix (Fortune 500 HQ in CA)
| Industry | F500 HQs | Revenue |
|---|---|---|
| Technology | 27 | $1,492B |
|
||
| Financial Services | 3 | $174B |
|
||
| Retail | 3 | $44B |
|
||
| Insurance | 3 | $26B |
|
||
| Media / Entertainment | 2 | $115B |
|
||
| Pharmaceuticals / Biotech | 2 | $62B |
|
||
Price history
-5.0% since first listed3 events — show timeline
- 2026-06-10 Price Changed $209,000 CRMLS
- 2026-05-27 Price Changed $215,000 CRMLS
- 2026-05-02 Listed $220,000 CRMLS
Property tax history
-1.5%/yrLatest (2025): $394 · +1.3% YoY. Source: county tax records.
Cash-flow waterfall
monthlySold comps — $/sqft
last 12 mo · ≤1 miLoading sold comps…